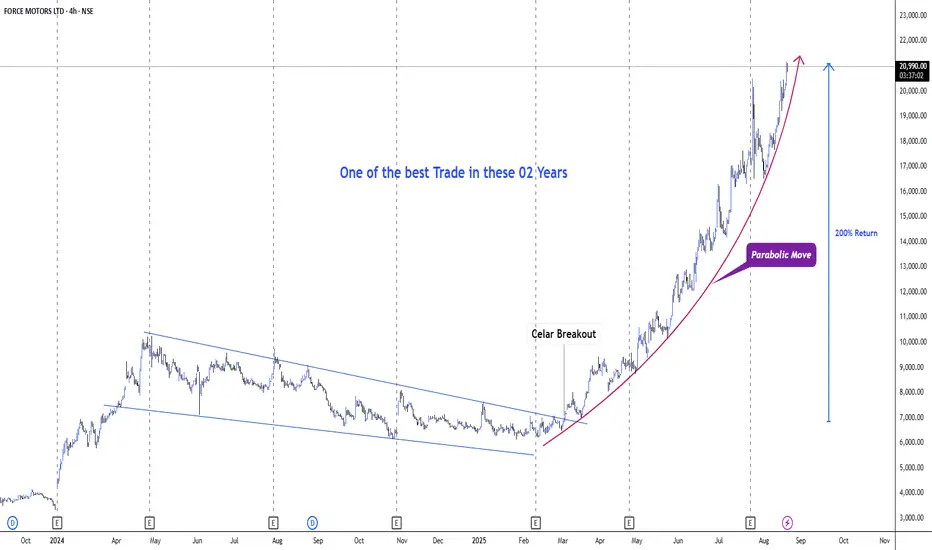
Channel Breakout → Parabolic Advance. Ride the curveSummary
Structure flipped from a lengthy falling channel to a sustained uptrend after a clear breakout.
Post-breakout trend evolved into a parabolic advance with accelerating momentum.
Trend remains bullish but risk of sharp mean‑reversion increases as curvature steepens.
Plan: Buy-the-dip toward dynamic supports with strict risk control; avoid chasing vertical candles.
What the chart shows
Downtrend phase: A well-defined descending channel persisted for several months into early 2025.
Breakout: Price broke above the channel with expansion in range and follow‑through—textbook “change of character”.
Trend maturation: The advance has transitioned into a parabolic curve with higher highs/lows compressing in time, indicating momentum clustering and potential late‑stage acceleration.
Return magnitude: The move from breakout base to current print approximates a 200% run, per the annotation, consistent with parabolic behavior.
Key Levels (from the image)
Immediate resistance: Area near 20,800–21,000 where price is currently pressing along the parabolic arc.
Rising dynamic support: Parabolic guide curve; secondary support around prior swing clusters roughly 17,000–18,000.
Deeper support/invalidations: Breakout shelf and last higher‑low zone around 13,500–14,500. Loss of this zone would damage the uptrend structure.
Momentum & Risk Read
Strong momentum regime: Tight, shallow pullbacks; frequent small-bodied consolidations followed by quick breakouts—sign of aggressive dip buying.
Parabolic risk: As curvature steepens, the probability of a swift vertical drop to the curve or to the last consolidation increases. Expect 10–20% whips possible without trend break.
Volume/OBV not visible in the image; plan assumes momentum still intact but reactive.
Trading Plan (for TradingView post)
Bias: Bullish, momentum continuation with caution.
Do not chase extended candles at the top of the arc. Prefer pullbacks to structure.
Entries
Pullback-to-curve buy: Stagger bids on a retrace to the parabolic guide or the most recent 4h demand block.
Breakout‑continuation: If price flags below 21,000 and breaks out on expanding 4h range, enter on break with tight risk.
Stops
Tactical stop: Below the most recent 4h swing low that anchors the parabolic curve (keep risk ≤1R of average upswing).
Structural stop: Below 17,000 (loss of mid‑trend shelf) if position trades are taken.
Hard invalidation: Close below 13,500–14,500 zone would signal trend deterioration; reduce exposure materially.
Targets
Near‑term: Trail into strength; take partials on each vertical expansion, re‑add on pullbacks.
Extensions: Use measured‑move logic from last consolidation height; alternatively, trail below prior 4h lows to stay in the parabola.
If a blow‑off top occurs (wide spread up bar followed by immediate reversal), exit 50–100% and wait for base rebuild.
Risk Management
Scale‑in approach: 1/3 on first touch of curve, 1/3 on confirmation (bullish 4h reversal), 1/3 on break of minor flag.
Never average down below structural stop; honor invalidation.
Position sizing should anticipate volatility spikes typical of parabolic phases.
Trade Triggers to Monitor
4h bearish engulfing closing through the curve with follow‑through: caution—expect mean reversion to 17,000–18,000.
Tight 4h pennant under resistance, then high‑range breakout: momentum continuation.
RSI/Momentum divergence on 4h coupled with failure to make new highs: signals cooling; switch to swing‑reversion tactics.
Forcemotors
FORCE MOTORS - ALL TIME HIGH AGAIN ? WHATTTTTTTT....???
HELL YES..
A big OPPORTUNITY in FORCE MOTORS LTD🚀🚀
We saw that this stock was in correction mode since it made an all time high of ₹ 10,100
BUT NOW, it is giving the reversal sign by giving a breakout of downward sloping trendline with good intensity of volume.
* As per ELLIOT WAVES the stock is getting ready to move all time high to unfold the WAVE 5th
* Stock can be a buy on dip till it touches all time high with the same stoploss mentioned in trading plan at the last with expected targets.
Technical view- a simple understanding for beginners
* The stock has given a breakout with good intensity of volume.
* The price changed its structure from lower low to higher high
* Stock price is challenging Upper Bollinger Band in Daily Time Frame
* RSI ( a strength indicator) is above 60 in Daily Time Frame which indicates strong momentum
* All the momentum indicators such as MACD, DMI etc., are giving positive signals.
For those who are new to WAVES, let's Understand the basics of Waves 📈
Key Elliott Wave Principles:
1. Five-Wave Impulse Pattern: The primary trend unfolds in five waves (1-2-3-4-5). Waves 1, 3, and 5 move in the direction of the trend, while waves 2 and 4 are corrective.
2. Three-Wave Corrective Pattern: After a five-wave sequence, a correction typically follows, consisting of three waves (A-B-C) that move against the primary trend.
3. Wave Relationships: Fibonacci ratios play a crucial role in Elliott Wave analysis, often governing the length of the waves.
4. Wave Characteristics: Each wave has its own set of characteristics. For example, Wave 3 is usually the most powerful, showing the strongest price movement, while Wave 5 may signal the final push before a significant correction.
TRADE PLAN
* one can add at current levels and again if it comes down you will get an opportunity to add more till 6500
* Targets - 8000/9000/9500/10000/ All time high
(note- Targets may also react as resistance / hurdle)
* Stop Loss - 6160
* Invest keeping in mind for short to long term view, not for speculation.
* Always invest only after calculating the financial risk with the given stop loss and then decide your quantity.
Thank You
KARANN DINGRA 💰🚀

Force Motors under the garb of descending triangle nowThis chart shows a technical analysis of the stock price for Force Motors. The pattern displayed is a descending triangle, which is typically considered a bearish pattern. Here are the key features and interpretations:
Descending Triangle Pattern :
# Resistance Line (White Line): This is the downward sloping trendline connecting the lower highs. It indicates that the stock has been consistently making lower highs, suggesting a downward trend.
# Support Line (Green Line): This is the horizontal line connecting the lows, showing that the stock price has found a support level where buyers come in to prevent the price from falling further.
Price Movement :
The stock price is moving between these two lines, bouncing off the support and resistance levels.
As the price continues to test the support level (green line) without breaking through, it signifies strong support at this price point. However, the descending resistance line indicates sellers are consistently pushing the price lower at each rally.
Potential Breakout :
If the price breaks below the support level (green line) with significant volume, it could indicate a bearish breakout, leading to a further decline in price.
Conversely, if the price breaks above the descending resistance line (white line), it could suggest a bullish reversal, with the potential for an upward movement.
Volume Analysis :
Typically, volume plays a crucial role in confirming the breakout. An increase in volume on a breakout below the support line would confirm the bearish trend, while an increase in volume on a breakout above the resistance line would confirm a bullish trend.
In summary, this chart suggests that Force Motors is currently in a descending triangle pattern, which is a bearish signal. Traders and investors should watch for a breakout from this pattern to determine the next potential move of the stock.
Major levels to consider:
Support - 7850
Stoploss - 7450
NOTE : Please consult your financial advisor before taking any trade/decision in Force Motors

Breakout Done Force motorsBreakout and Retest,
1560 Levels were breakout Levels.
Trade Setup:
Buy at CMP 1606.15
Target 1: 1707;
Target 2: 2000;
Target 3: 2300++
SL : 1535
Risk is yours Reward is too yours totally.
Symmetrical Triangle Pattern is activated.

Force motorsAlready breakout of level 1707 made high 1715, need to close above 1707 for further rally, however its going far from EMA 20 so can look for 1st support at 1595 in order to bounce back.

Breakout in Force Motors...Chart is self explanatory. Entry, Targets and Stop Loss are mentioned on the chart.
Disclaimer: This is for demonstration and educational purpose only. This is not buying or selling recommendations. I am not SEBI registered. Please consult your financial advisor before taking any trade.

