Ford Motor($F) Teams With Renault for Low-Cost European EV Push Ford Motor Company (NYSE:$F) is accelerating its European EV strategy through a newly announced partnership with Renault aimed at producing smaller, more affordable electric vehicles and jointly developing commercial vans. The companies are responding to intensifying pressure from Chinese automakers such as BYD, Changan, and Xpeng, which continue to gain ground in Europe with aggressively priced EVs.
Ford CEO Jim Farley described the move as essential to survival in a market undergoing rapid disruption. The first jointly developed small EV will roll out of a Renault facility in northern France in 2028—designed specifically for Europe and filling a key gap in Ford’s global EV lineup. Alongside passenger EVs, the partnership aims to create a “powerhouse of LCVs” (light commercial vehicles) by combining Renault and Ford technologies to fend off future Chinese competition.
The partnership also brings manufacturing scale to Renault, Europe’s smallest major automaker, which is actively building alliances to reduce EV development costs. Ford, meanwhile, benefits from access to Renault’s EV platforms at a time when U.S. regulatory uncertainty—under the Trump administration’s EV policy rollback—forces the automaker to invest in both ICE and electric technologies. The arrangement complements Ford’s existing collaborations with Volkswagen and strengthens its competitive footing in Europe’s evolving EV landscape.
Technical Analysis
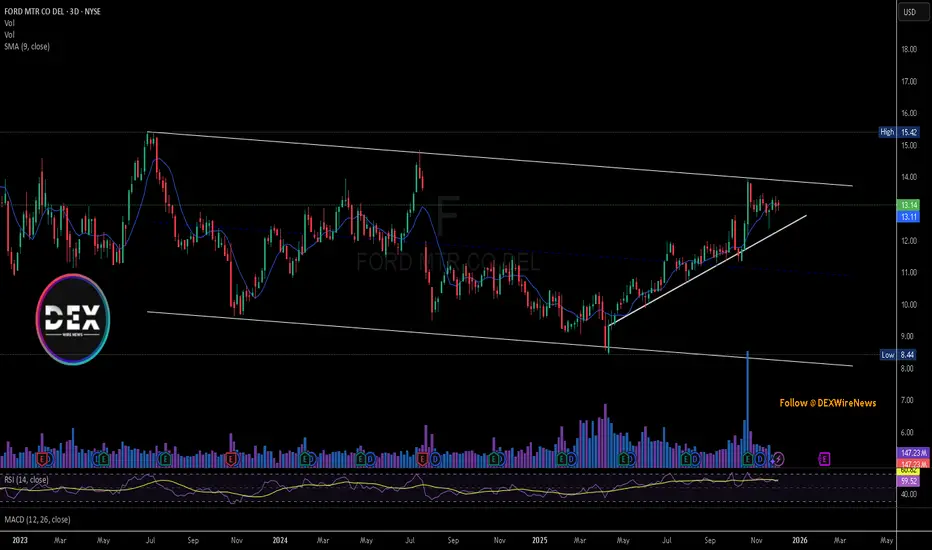
Ford stock has been trading within a broad descending channel since early 2023, with clear resistance near $15.40 and support around $8.40. Recently, price has pushed into a short-term uptrend, riding an ascending trendline from the $10 region and approaching channel resistance.
The stock is currently trading around $13.14, consolidating just below the upper boundary of the long-term channel. Volume saw a major spike in late 2025, signaling renewed institutional interest, followed by steady participation as price climbs.
RSI sits near 60, showing bullish momentum without being overbought. MACD remains positive, reflecting continuation strength. A breakout above $14–$15.40 would confirm a major trend reversal, opening room toward $17. Failure to break could send price back to the rising trendline near $12.
Fordlong
Ford Motors Stock Supply and Demand AnalysisFord Motors is currently offering one of the cleanest supply and demand structures in the stock market. The bigger timeframes — monthly and weekly — are in full control, and as price reacts to these higher-timeframe imbalances, new daily demand levels are forming with exceptional strength.
This is exactly how professional price action develops: the higher timeframes establish control, and smaller timeframes follow by creating fresh pockets of imbalance.
Daily Demand at $12.60
This level shows:
- A strong departure
- Tight basing
- Powerful bullish impulse
Candles with minimal overlap
It stands out immediately as one of the clearest imbalances in the recent price action.
Why Patience Is Everything in Trading
Most retail traders ruin strong setups because they want to "be in the market." The truth is simple:
📌 Trading is about waiting. Not chasing.
Institutional imbalances take time to develop. Once they form, they provide clarity for days, weeks, or even months. Ford is now in such a phase.
As long as the daily and higher timeframe demand zones hold, a new bullish leg is the most probable outcome.

$F At Multi-Year Downtrend Resistance - Bulls Target More UpsideFord Motor Company (NYSE: F) is showing a strong technical breakout after several years of trading inside a broad falling wedge structure. The chart reveals a clear downward-sloping resistance line dating back to 2022, but Ford is trying now to push above it for the first time in almost 3 years. This breakout would signal a potential shift from long-term compression into a new expansion phase, supported by rising volume and renewed investor confidence in the company’s EV and hybrid roadmap.
The $11.50–$12.00 level acted as a heavy accumulation zone for quite some time. Buyers consistently defended this zone, forming a strong base that has now flipped into support. Ford is currently testing the resistance. If the price breaks above, closes above and stabilizes above this area, the setup favors a continuation move back toward the $20 and $25 levels, where the next supply pocket sits. A rejection at the current resistance could bring a drop toward $11 support level.
Fundamentally, Ford continues navigating the EV transition with a hybrid-first strategy that has started to resonate with consumers. Demand for gas-electric models remains resilient, and Ford’s focus on profitability over volume in the EV segment has stabilized margins. As the company scales battery production and improves pricing efficiency, analysts expect steadier revenue with reduced downside risks.
Macro conditions also support a potential upside. Expectations of future rate cuts could boost auto demand in 2025–2026, while easing inflation may strengthen consumer purchasing power. If market sentiment improves, cyclical stocks like Ford could benefit significantly.
With a confirmed breakout, strong structural support beneath, and a favorable macro backdrop, Ford’s chart now leans bullish—pending a clean retest of $11.50–$12.00.

Ford 1D Investment Aggressive CounterTrend TradAggressive CounterTrend Trade
- short impulse
+ exhaustion volume
+ 1/2 correction
Calculated affordable stop limit
Take profit:
1/3 to 1/2 Month Trend
1/3 to Month T2
1/3 to Year 1/2
Sell F Limit at $14.95 (Good 'til Canceled)
Sell F Limit at $11.57 (Good 'til Canceled)
Sell F Limit at $10.21 (Good 'til Canceled)
Monthly CounterTrend
"- short impulse
+ 1/2 correction
- unvolumed T1
+ support level
+ reverse volume approach
+ volumed manipulation"
Yearly Trend
"+ long impulse
+ volumed T2 level
+ volumed 2Sp+
+ weak test"

PERSONAL JOURNAL #3 | FORD [F] | AUG 2025-2026Disclaimer
This is a personal journal of my exploits. This is not financial advice. Always do your own research.
Insight
Most companies are only now beginning to recovery post Covid-19, the localized correction in 2021 following Evergreen and Evergrande, as well as onset of new wars and high interest rates.
Outlook
Recovery.

ford in the next few weeksFord stock is undervalued and now at strong support
we will see bullish movements in the next few days

Ford a Fake Dump- just for fun and training.
- i play some stocks when i am bored.
-----------------------------------------------------
Trading Parts
-----------------------------------------------------
Buy Zone : 9.50 ish
Rebuy Zone : 9.00$
Sell Zones : 14$ to 15$
-----------------------------------------------------
PS : Now it's week-end so wait for the GAP before entering any position.
Happy Tr4Ding !

Ford Stock Analysis : A Long-Term PerspectiveIn our exploration of the stock market, we don't limit our analysis to just short-term charts; we delve into the longer horizon as well.
Ford has particularly caught our attention. Our initial entry into Ford was at $10.30, a point which, upon reviewing the broader picture, appears to have been very close to the bottom—hopefully, the lowest point it will maintain. Any movement below this could potentially signal a fall towards the $4 mark, akin to the levels seen during the pandemic.
Assuming we've indeed hit the bottom, a conservative projection sees Ford climbing to at least $45 over a multi-year span. This bold assumption is reinforced by the structure observed on the 2-hour chart, showcasing a Wave (i), Wave 8ii), as well as Wave (iii)and Wave (iv). Our entry at Wave (iv) has proven strategic, with Ford's price appreciating by approximately 7.5% since then.
Believing in Ford's further potential, we plan to adjust our stop-loss just below the pivot point at Wave (iv), setting it at $10.79. We'll provide updates on our take profit targets as they are achieved, closely monitoring the stock for optimal exit points.

F (FORD) Wait For BuyAnalyzing Ford on the daily time frame, you can see that over the course of a month, Ford has fallen sharply after breaking out of the target completion corner pattern (price limited to $15). And its price return from the 11 range is not strong and you can see uncertain doji candles that there is a high probability that it will reach the 11 dollar range again. And since this range is a strong support zone, we could see a sharp bounce to the upside in the $11 range. In this pattern, double bottom are formed. And we chose the TARGET POINT based on this scenario. If it falls below $11, this scenario is violated !!.

F Surprised on Earnings Ready for Rising PriceFORD ( F) significantly surprised on earnings no matter that a recession may be underway and
no matter its balance sheet is saddled with debt which is increasingly more expensive to
services. Pre-orders for the Lightning F -150 are strong. On the 2H chart, price has yet to
react to the earnings surprise. Volume has picked up but nothing dramatic. The zero-lag
MACD lines have crossed under the histogram and are now crossing over the zero line.
Price in a sign of strength rose out of its Fibonacci band channel and is just below the
anchored mean VWAP while at the uppermost portion of the high volume area of the volume
profile. I see this as a good place to take a long position targettting $ 12.80 to 13.00
with a stop loss at $ 11.80 below the POC line of the volume profile.

Ford dips below $11 continues to attract buyers.Ford - 30d expiry - We look to Buy at 11.15 (stop at 10.55)
Levels below 11 continue to attract buyers.
11 continues to hold back the bears.
We look to buy dips.
With signals for sentiment at oversold extremes, the dip could not be extended.
Early pessimism is likely to lead to losses although extended attempts lower are expected to fail.
Our profit targets will be 12.77 and 13.07
Resistance: 11.95 / 12.50 / 13.15
Support: 11.44 / 11.00 / 10.61
Please be advised that the information presented on TradingView is provided to Vantage (‘Vantage Global Limited’, ‘we’) by a third-party provider (‘Signal Centre’). Please be reminded that you are solely responsible for the trading decisions on your account. There is a very high degree of risk involved in trading. Any information and/or content is intended entirely for research, educational and informational purposes only and does not constitute investment or consultation advice or investment strategy. The information is not tailored to the investment needs of any specific person and therefore does not involve a consideration of any of the investment objectives, financial situation or needs of any viewer that may receive it. Kindly also note that past performance is not a reliable indicator of future results. Actual results may differ materially from those anticipated in forward-looking or past performance statements. We assume no liability as to the accuracy or completeness of any of the information and/or content provided herein and the Company cannot be held responsible for any omission, mistake nor for any loss or damage including without limitation to any loss of profit which may arise from reliance on any information supplied by Signal Centre.

Ford to try for $14.50 breakout End of AprilI've been watching Ford since July of 21 where I made the call that it would climb to $20 by January of '22.
Looking at this chart again, and just being bullish on Ford anyway, it's set to run back up to $14.50 by the beginning of May, and may even try to spike higher.
With their advancements in EV and continually staying on top of the market, I believe that we'll see this stock climb once again.
I placed an order for a Buy to open 1 F 5/5/2023 13.00 C @ Market, Day

Will Ford selloff stall at swing lows?Ford - 30d expiry - We look to Buy at 11.21 (stop at 10.55)
Levels below 11 continue to attract buyers.
11 continues to hold back the bears.
We look to buy dips.
With signals for sentiment at oversold extremes, the dip could not be extended.
Early pessimism is likely to lead to losses although extended attempts lower are expected to fail.
Our profit targets will be 12.77 and 13.07
Resistance: 11.95 / 12.50 / 13.15
Support: 11.35 / 11.00 / 10.61
Please be advised that the information presented on TradingView is provided to Vantage (‘Vantage Global Limited’, ‘we’) by a third-party provider (‘Signal Centre’). Please be reminded that you are solely responsible for the trading decisions on your account. There is a very high degree of risk involved in trading. Any information and/or content is intended entirely for research, educational and informational purposes only and does not constitute investment or consultation advice or investment strategy. The information is not tailored to the investment needs of any specific person and therefore does not involve a consideration of any of the investment objectives, financial situation or needs of any viewer that may receive it. Kindly also note that past performance is not a reliable indicator of future results. Actual results may differ materially from those anticipated in forward-looking or past performance statements. We assume no liability as to the accuracy or completeness of any of the information and/or content provided herein and the Company cannot be held responsible for any omission, mistake nor for any loss or damage including without limitation to any loss of profit which may arise from reliance on any information supplied by Signal Centre.

Ford levels below 11 continue to attract.Ford - 30d expiry - We look to Buy at 11.21 (stop at 10.55)
Levels below 11 continue to attract buyers.
A lower correction is expected.
We look to buy dips.
We are trading at oversold extremes.
Early pessimism is likely to lead to losses although extended attempts lower are expected to fail.
Our profit targets will be 12.77 and 13.07
Resistance: 13.50 / 14.00 / 14.60
Support: 12.50 / 12.00 / 11.00
Please be advised that the information presented on TradingView is provided to Vantage (‘Vantage Global Limited’, ‘we’) by a third-party provider (‘Signal Centre’). Please be reminded that you are solely responsible for the trading decisions on your account. There is a very high degree of risk involved in trading. Any information and/or content is intended entirely for research, educational and informational purposes only and does not constitute investment or consultation advice or investment strategy. The information is not tailored to the investment needs of any specific person and therefore does not involve a consideration of any of the investment objectives, financial situation or needs of any viewer that may receive it. Kindly also note that past performance is not a reliable indicator of future results. Actual results may differ materially from those anticipated in forward-looking or past performance statements. We assume no liability as to the accuracy or completeness of any of the information and/or content provided herein and the Company cannot be held responsible for any omission, mistake nor for any loss or damage including without limitation to any loss of profit which may arise from reliance on any information supplied by Signal Centre.

Ford to find support at trend line?Ford - 30d expiry - We look to Buy at 11.63 (stop at 11.09)
Short term momentum is bearish.
The trend of higher lows is located at 11.60.
We expect prices to stall close to our bespoke level (11.60).
Trading has been mixed and volatile.
The previous swing low is located at 11.13.
We look for a temporary move lower.
Our profit targets will be 12.97 and 13.27
Resistance: 12.50 / 13.00 / 13.50
Support: 12.00 / 11.70 / 11.20
Disclaimer – Saxo Bank Group.
Please be reminded – you alone are responsible for your trading – both gains and losses. There is a very high degree of risk involved in trading. The technical analysis , like any and all indicators, strategies, columns, articles and other features accessible on/though this site (including those from Signal Centre) are for informational purposes only and should not be construed as investment advice by you. Such technical analysis are believed to be obtained from sources believed to be reliable, but not warrant their respective completeness or accuracy, or warrant any results from the use of the information. Your use of the technical analysis , as would also your use of any and all mentioned indicators, strategies, columns, articles and all other features, is entirely at your own risk and it is your sole responsibility to evaluate the accuracy, completeness and usefulness (including suitability) of the information. You should assess the risk of any trade with your financial adviser and make your own independent decision(s) regarding any tradable products which may be the subject matter of the technical analysis or any of the said indicators, strategies, columns, articles and all other features.
Please also be reminded that if despite the above, any of the said technical analysis (or any of the said indicators, strategies, columns, articles and other features accessible on/through this site) is found to be advisory or a recommendation; and not merely informational in nature, the same is in any event provided with the intention of being for general circulation and availability only. As such it is not intended to and does not form part of any offer or recommendation directed at you specifically, or have any regard to the investment objectives, financial situation or needs of yourself or any other specific person. Before committing to a trade or investment therefore, please seek advice from a financial or other professional adviser regarding the suitability of the product for you and (where available) read the relevant product offer/description documents, including the risk disclosures. If you do not wish to seek such financial advice, please still exercise your mind and consider carefully whether the product is suitable for you because you alone remain responsible for your trading – both gains and losses.

F daily retest of long day bullish candle at buying zone supportOrder BUY F NYSE Stop 11.94 LMT 11.94 will be automatically canceled at 20230401 01:00:00 EST
F daily retest of long day bullish candle at buying zone support quick 1.2R countertrend.

F daily bullish hammer Order BUY F NYSE Stop 12.58 LMT 12.58 will be automatically canceled at 20230401 01:00:00 EST
F daily bullish hammer into wave C of wave 4 downtrend. Countertrend quickie.

F is resting on daily to continue bullish S curveLove decreasing volume at rest, should compress and shoot up. Will set up a trade once there's a candle

7/27/22 FFord Motor Co ( NYSE:F )
Sector: Consumer Durables (Motor Vehicles)
Market Capitalization: 53.023B
Current Price: $13.19
Breakout price: $13.55
Buy Zone (Top/Bottom Range): $12.60-$10.90
Price Target: $14.80-$15.40 (1st), $17.90-$18.30 (2nd)
Estimated Duration to Target: 28-30d (1st), 70-74d (2nd)
Contract of Interest: $F 8/19/22 14c, $F 12/16/22 15c
Trade price as of publish date: $0.32/contract, $0.75/contract

LONG $F , SHORT $TSLAAlthough I am a huge fan of Tesla and believe they are way ahead of the competition, I think they are in for a pretty major correction. Best case $540, more realistically around $350 IMO. Especially if we head into a recession, which it looks like we might. In the meantime, I think Ford looks pretty cheap around here and will gain some significant market share.
-TSLA currently at 95 P/E ratio
-Ford at ~4.7 P/E

Ford - Similar Indicator Situations Similar scenario right now to the area first in yellow
Price has dipped similarly to the 100MA
This touch on the 100MA on this Weekly timeframe will be bullish and lead to continuation above the major trend line
Major point is the initial and latter scenario are very similar
Bullish

FORD - Weekly IdeaA nice Fibonacci Circle can be drawn with the bearish but very little volatility price
This shows price hit a bottom at 2.618
Price increase based n assumption that 1.618 acts as support for price

Ford buy the dip[F is sitting nice bottom 43 level on RSI. It can continue to move higher high same as other EV sectors.
