Don't miss the great buy opportunity in EURGBPTrading suggestion:
There is a possibility of temporary retracement to suggested support line (0.8769). if so, traders can set orders based on Price Action and expect to reach short-term targets.
Technical analysis:
. EURGBP is in a range bound and the beginning of uptrend is expected.
.The price is above the 21-Day WEMA which acts as a dynamic support.
. The RSI is at 52.
Take Profits:
TP1= @ 0.8866
TP2= @ 0.8910
TP3= @ 0.8994
SL= Break below S2
Forecastingtechniques

HKDJPY expecting bearish continuation in next period
ENTRY: 13.88000
TP: 13.83000
TP2: 13.78000
TP3: 13.73000
SL: 13.96000
Chart time frame - 1D
Time for reaching TP - 1-3D
Follow, Like, Share or Comment
Thanks on supporting!
All best!

BTCUSD Inception day 21-12-2019, Weekend forecast.As time goes by, the markets evolve.
More visible, more probable:
-Dashed lines; Possible forming patterns
-Solid lines; Confirmed patterns / support or resistance
-Dotted lines; Possible price-action trajectories
I guess we can conclude that BTC is going to breakout of this falling broadening wedge sooner or later. However if this forming ascending triangle in the shorter time frames is confirmed, then we might see a breakout to the upside towards the $8.1K region to retest the resistance of the FW, within approximately 3 days. Otherwise retesting the support of the FBW will be most probable, target bottom will be approx. $6.2k region, support of the FW. For the time being, we'll have to wait and let the markets evolve a bit. The fact that the price action is dancing around the EMA-89 in the 4H chart, means BTC is in a turning point. Bearish reversal otherwise bullish continuation. We'll discover soon enough. Gonna wait for the bullish pattern to confirm, then I'll definitely will become bullish. Like I mentioned in the previous idea.
In case you're wondering which indicators I'm using. She's called EMI, short for 'Epic Market Indicator' and it's a collection of diverse indicators.How to use, is in the description. You can use them like any other indicators. Search for 'epic market indicator' then add. I have recently published the latest versions. EMI 1 v3.0 & EMI 2 v2.0. Be careful and good luck traders!

Will Bitcoin Bounce? Major Support at $8,300
If Major Support breaks,
Second Major Support at $7,800

DOLLAR INDEX TIMING PREDICTIONNext 2 potential turns in dollar index:
27/08/2019 - 04/09/2019 - 13/09/2019
Watch the trend between 2 timing
points to decide in which direction
the market will turn on the next timing

Aren't we already in the recession "play"? Can $EURUSD go any lower than 1.0748, Or the big fall is about to happen?

DOLLAR INDEX TIMING PREDICTIONNext 2 potential turns in euro index:
03/09/2019 - 13/09/2019
Watch the trend between 2 timing
points to decide in which direction
the market will turn on the next timing

BTCUSD price moves down to consolidate before the next growth At the 4-hours timeframe chart we can see the most relevant Bitcoin's price action.
Decrease started on 10th of July formed a small triangle which was easily broke up by bulls with insignificant volume increase. The price bounced from $9 060 to $11 160 level which equals 23.1% growth within 3 days. Rapid growth brought uncertainty and fear to market which is reflected by volume decrease, bears took power over the market.
Such price action created the second and the major triangle pattern which again was broken upward. The result was a positive mood among market players and subsequent 5 Elliott impulse growth waves. However there was no volume growth and thus the price started to crawl at the upper edge of adjusted RSI band. Once the price touched strong Fib 0.236 resistance it sharply went down to the parallel channel liquidating any potential of FOMO growth and breaking the resistance. Another band touch happened a day later, subsequent rejection created double top and closed the trap for bulls.
Currently we see a great potential of breaking parallel channel down triggering stop losses of recent longs which will result in sharp drop to $11 118 level and subsequent gradual decrease to the point (C) according to ABC Elliot corrective waves which is near to Fib 0.5 major support level. The forecast is enhanced by technical indicators state: we have no divergence, there is increasing volatility without tension and we are neutral according to CCI. Nevertheless we still have positive Ichi, Stoch and EMA 20 and 50 crossing.
We expect a short term decrease with a subsequent bounce from the support level. Such price action will be accompanied by a rise right to the mentioned at the chart levels.

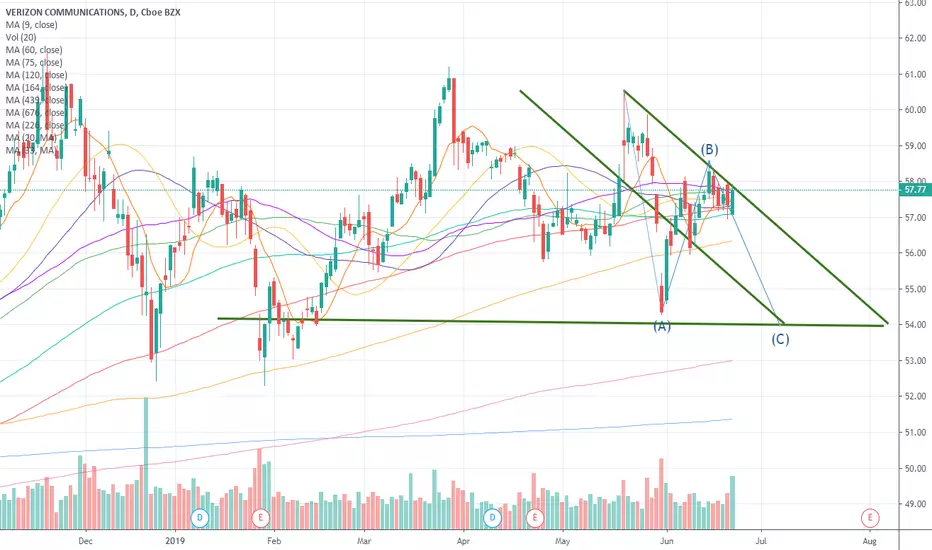
Daily VZ forecast timing analysis by Supply-Demand strength21-Jun
Investing strategies by pretiming
Investing position about Supply-Demand(S&D) strength: In Falling section of high risk & low profit
Supply-Demand(S&D) strength Trend Analysis: About to begin a rebounding trend as a downward trend gradually gives way to slowdown in falling and rises fluctuations
Today's S&D strength Flow: Supply-Demand strength has changed from a strong selling flow to a suddenly strengthening buying flow.
View a Forecast Candlestick Shape Analysis of 10 days in the future: www.pretiming.com
(You can easily create a trading plan.)
D+1 Candlestick Color forecast: RED Candlestick
%D+1 Range forecast: 0.1% (HIGH) ~ -1.2% (LOW), -0.8% (CLOSE)
%AVG in case of rising: 0.9% (HIGH) ~ -0.5% (LOW), 0.5% (CLOSE)
%AVG in case of falling: 0.3% (HIGH) ~ -1.6% (LOW), -1.3% (CLOSE)
Price Forecast Timing Criteria: Price forecast timing is analyzed based on pretiming algorithm of Supply-Demand(S&D) strength.
Daily USOIL forecast timing analysis by Supply-Demand strength21-Jun
Investing strategies WTI Crude Oil : TVC:USOIL
Investing position about Supply-Demand(S&D) strength: In Rising section of high profit & low risk
Supply-Demand(S&D) strength Trend Analysis: About to begin an adjustment trend as a upward trend gradually gives way to a slowdown in rises and falling fluctuations
Today's S&D strength Flow: Supply-Demand strength has changed to a strengthening buying flow when stock market opening.
View a Forecast Candlestick Chart Analysis of 10 days in the future: www.pretiming.com
(You can easily create a trading plan.)
D+1 Candlestick Color forecast: RED Candlestick
%D+1 Range forecast: 0.5% (HIGH) ~ -2.3% (LOW), -0.8% (CLOSE)
%AVG in case of rising: 1.9% (HIGH) ~ -0.7% (LOW), 1.5% (CLOSE)
%AVG in case of falling: 1.0% (HIGH) ~ -1.9% (LOW), -0.9% (CLOSE)

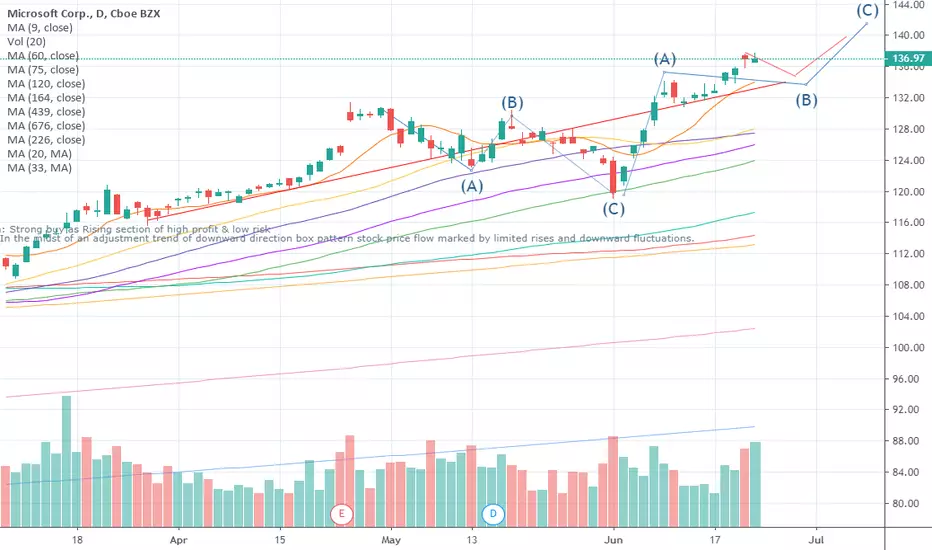
Daily MSFT forecast timing analysis by Supply-Demand strength21-Jun
Stock investing strategies
Investing position about Supply-Demand(S&D) strength: In Rising section of high profit & low risk
Supply-Demand(S&D) strength Trend Analysis: About to begin an adjustment trend as a upward trend gradually gives way to a slowdown in rises and falling fluctuations
Today's S&D strength Flow: Supply-Demand(S&D) strength flow appropriate to the current trend.
View a Forecast Candlestick Chart Analysis of 10 days in the future: www.pretiming.com
(You can easily create a trading plan.)
D+1 Candlestick Color forecast: RED Candlestick
%D+1 Range forecast: 0.2% (HIGH) ~ -0.3% (LOW), -0.2% (CLOSE)
%AVG in case of rising: 1.3% (HIGH) ~ -0.3% (LOW), 0.9% (CLOSE)
%AVG in case of falling: 0.6% (HIGH) ~ -1.1% (LOW), -0.5% (CLOSE)
Price Forecast Timing Criteria: Price forecast timing is analyzed based on pretiming algorithm of Supply-Demand(S&D) strength.
Daily IWM forecast timing analysis by Supply-Demand strength21-Jun
Stock investing strategies
Investing position about Supply-Demand(S&D) strength: In Rising section of high profit & low risk
Supply-Demand(S&D) strength Trend Analysis: In the midst of an adjustment trend of downward direction box pattern price flow marked by limited rises and downward fluctuations.
Today's S&D strength Flow: Supply-Demand(S&D) strength flow appropriate to the current trend.
View a Forecast Candlestick Chart Analysis of 10 days in the future: www.pretiming.com
(You can easily create a trading plan.)
D+1 Candlestick Color forecast: RED Candlestick
%D+1 Range forecast: 0.0% (HIGH) ~ -0.4% (LOW), -0.2% (CLOSE)
%AVG in case of rising: 1.0% (HIGH) ~ -0.3% (LOW), 0.7% (CLOSE)
%AVG in case of falling: 0.3% (HIGH) ~ -1.0% (LOW), -0.5% (CLOSE)
Price Forecast Timing Criteria: Price forecast timing is analyzed based on pretiming algorithm of Supply-Demand(S&D) strength.

SPY forecast timing analysis. 14-JunStock investing strategies
Read more: www.pretiming.com
D+1 Candlestick Color forecast: GREEN Candlestick
%D+1 Range forecast: 1.1% (HIGH) ~ 0.3% (LOW), 0.9% (CLOSE)
%AVG in case of rising: 0.8% (HIGH) ~ -0.1%(LOW), 0.6% (CLOSE)
%AVG in case of falling: 0.2% (HIGH) ~ -0.8%(LOW), -0.3%(CLOSE)
Investing position about Supply-Demand(S&D) strength: Rising section of high profit & low risk
S&D strength Trend Analysis: About to begin an upward trend as a adjustment trend gradually gives way to increasing limited falls and strong rises.
Today's S&D strength Flow: Supply-Demand(S&D) strength flow appropriate to the current trend.
Stock Price Forecast Timing Criteria: Stock price forecast timing is analyzed based on pretiming algorithm of Supply-Demand(S&D) strength.
EUR long on the right trail?
Good morning,
Looks like the EUR is finally out of its 10 months descending wedge, reversing its downtrend. What is helping the EUR finally push out? Could it be the political turmoil in England over Brexit? The US -China -Mexico dispute? None of this truly matter, its already priced in and all we have to do is look for a good entry and a good exit.
I shall take on the risk of entering at the high of days @ 1.1320 with a stop loss @ 1.1250 and a take profit @ 1.1420.
Good luck

GE stock price forecast timing analysis. 13-Jun
Investing position about Supply-Demand(S&D) strength: Rising section of high profit & low risk
Supply-Demand(S&D) strength linkage Trend Analysis: In the midst of an adjustment trend of downward direction box pattern stock price flow marked by limited rises and downward fluctuations.
Today's Supply-Demand(S&D) strength Flow: Supply-Demand strength has changed from a weak selling flow to a suddenly strengthening selling flow.
Possibility of change in forecast timing: Forecast timing has become high variability conditions. because the flow of supply - demand has changed, and the supply - demand linkage is unstable.
D+1 Candlestick Color forecast: RED Candlestick
%D+1 Range forecast: 0.4% (HIGH) ~ -3.1% (LOW), -1.9%(CLOSE)
%AVG in case of rising: 3.2% (HIGH) ~ -0.8% (LOW), 2.4% (CLOSE)
%AVG in case of falling: 1.2% (HIGH) ~ -2.2% (LOW), -0.9%(CLOSE)
Stock Price Forecast Timing Criteria: Stock price forecast timing is analyzed based on pretiming algorithm of Supply-Demand(S&D) strength.
Read more a detailed Forecast Analysis Reports that candlestick shape and %change, S&D strength flow in the future 7 days.
www.pretiming.com

NFLX stock price forecast timing analysis. 13-JunStock investing strategies by pretiming
Investing position about Supply-Demand(S&D) strength: Falling section of high risk & low profit
Supply-Demand(S&D) strength linkage Trend Analysis: In the midst of a downward trend of strong downward momentum stock price flow marked by temporary rises and strong falls.
Today's Supply-Demand(S&D) strength Flow: Supply-Demand(S&D) strength flow appropriate to the current trend.
Possibility of change in forecast timing: Forecast timing has low variability conditions. because they maintain the proper flow of supply - demand in the current trend.
D+1 Candlestick Color forecast: RED Candlestick
D+1 Range forecast: 0.2% (HIGH) ~ -1.4% (LOW)
AVG in case of rising: 2.2% (HIGH) ~ -0.8% (LOW)
AVG in case of falling: 0.9% (HIGH) ~ -2.2% (LOW)
Stock Price Forecast Timing Criteria: Stock price forecast timing is analyzed based on pretiming algorithm of Supply-Demand(S&D) strength.
Read more a detailed Forecast Analysis Reports that candlestick shape and %change, S&D strength flow in the future 7 days.
www.pretiming.com

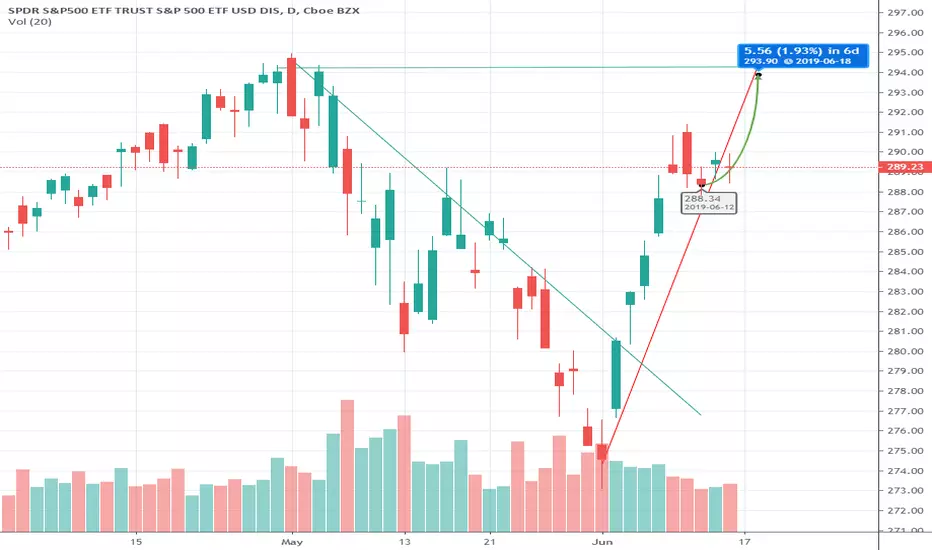
DIS stock price forecast timing analysis. 12-Jun-2019NYSE:DIS
Supply-Demand strength flow appropriate to the current trend that in the midst of a falling box pattern adjustment trend marked by limited rises and falls.
I think that stock price would be 'N' pattern downward direction by 132~133
I would like to show a detailed stock price forecast timing analysis that Candlestick shape and %Change forecast in the future 7 days.


$400-820K by Fall 2025In Bitcoin's short history, we've learned a couple of things that may remain consistent throughout Bitcoin's future (at least until the volatility decreases).
1: After each bull run, there's approximately an 85% correction
2: During the first two 4 year cycles, the angle for the top of the bull market (peak price) has decreased from 56 degrees to 39 degrees, which is a 70% decrease in peak price.
3: The 200 week moving average (shown in purple) has provided some major support throughout the bull and bear markets.
4: The 20 week moving average (shown in pink) has provided some major resistance throughout the bear market and support throughout the bull market.
With a decreasing angular projection of future price at 27 degrees from the current low of $3150, we can forecast the range for the next bull market do land somewhere between $75K and $370K which will occur in the latter part of 2021 or early 2022. Why such a wide spread even though we know the angular projection goes down by 70% in each cycle? Simple. We have yet to see crypto become mainstream, everyday usage technology, like the smartphone and internet. When it does - and it will in the near future, we have to account for the hype and rapid adoption at some point, and I believe it is going to come in the next two cycles.
Decreasing the angular peak projections by another 70% to 19% for the bull run starting in 2023, we can project the next peak to occur around the latter part of 2025 and range between $400k and $820K. At this point, the volatility will be very low and the price will continue to rise to around $1M over the next 4 year cycle.
Hoping for the $370K and the $820K. (;-)
CryptoJammer

USDJPY - ForecastLooks like it has met resistance at 110.9 area, which is the leg that brought it to the previous lower low. I would look for a pull back to at least 109.6 area. Overall I'm bearish at this price point. If it holds 110.9 area (which i doubt), look for a test of 112.0-112.3 area. NOT FINANCIAL ADVICE.


Technical Framework for Beginners 101 Part IIHi there,
The goal of every market speculator is to be able to think and trade confidently themselves. Not having to rely on anyone person. But to get there you need someone to tell you some basic first steps. If you are just starting out there's no need to go full obsessive reading every TA publication on tradingview. In most cases the best way is to simply just do it yourself. Be original. Come up with your own ideas and creativity. Don't be afraid to be wrong. Experiment with all the drawing tools and analytic tools on tradingview.
To summarize my main points during this 2 part series:
1) If your end goal is to be a market speculator you need to be a STUDENT of your asset. Study it. Pretend it's your child even. Get to know it's temperament. Look at the entire price history of the chart.
2) Create an economic cycle report showing all the bull and bear cycles, noting periods of Greed, Fear, Despair, Accumulation. Note how long these different cycles took. Having this knowledge will allow you to better understand the current cycle we are in and where things might head.
3) When you are first starting out always study the longer time frame charts. Daily, Weekly, Monthly. Anything less than an hour takes lots of skill to trade.
4) Get to know common moving averages and what they can tell you
5) Note previous major resistances and supports on your chart based on historical prices
6) Get to know your friend Fibonacci
7) Get to know different momentum indicators
8) Lastly - always make sure you technical frame work is super clean and concise. It should never EVER be cluttered. Just because a chart has a million trend lines and indicators doesn't mean it's good. Mostly likely it's garbage.
Anyway, I hope some of the info was helpful for you. Again, 99% of the leg work will need to be done by you and that's ok. If this is something you really want to do as a profession someday you'll be disciplined to learn as much as possible.
Take care and hit me up with any questions. I like being engaged with the community on TV
Regards,
Bobby

$BTC - #Bitcoin-Daily-Update #23 - Day Trader Explains Hello Lads and Ladies,
Welcome back to TJ's TA sessions.- The Daily BTC Update #23
What happened in the last 24h?
In the last 24 hours we saw quite some movement. Especially after the last few days being very bearish, we saw and see still more downwards movement and expect it to continue. Nevertheless, we saw on altcoins and btc a mini bounce from its daily lows, failing to break important supports, yet turning the previous uptrend into resistance. This is going to be a very important topic today.
Most important S/R right now?
2939 3030 3100 3160 3200 3250 3333 3434 3550 3666 3730 3812 3929 4077 4123 4169 4382 4658
Gained lost %?
Since the opening of the new daily, we wicked down -2.44%, but gained 0.20%
in $$$
down 84$ but up 7$
MarketCap?
Total MarektCap is 113 Billion - -7 -
Of which BTC is 60 Billion - -3 -
With a Dominance of 53.4%
- +1.2% -
Volatility?
The 30d avg Volatility is 2.77%
- -0.8 -
Shorts/Longs?
Shorts - 25.5k (pretty low)
Longs - 29.8k (high but solid)
- S +1.7k/ L +1.1k -
Funding?
The last 3 funding rates added -> +0,03%
- +0.0840 -
Momentum?
The TJ-Momentum is showing us a red cloud again, which is indicating us a drag and pull down. This might be important for the next days.
-303
- -101 -
Volume?
Today and yesterday we are seeing a beautiful volume. Exceeding the MA and confirming our down-trending direction. Sure, very interesting to get into a short? - BOUNCE!!!
TJ-MF/TJ-Stoch levels?
TJ-MoneyFlow - Today, such as a few days before we are seeing red candles but a green money flow. This is making me wonder why and letting me expect a bounce to confirm previous support as resistance.
TJ-Stoch
K(blue) - 10.3
D(orange) - 21.6
Divergences?
We are seeing an uptrend on the TJ-Moneyflow which is an important divergence against the down trending market structure. The shorts are increasing drastically. While the chart has not seen its full influence yet.
Market Structure?
We are currently in a descending channel. This channel has 3 important lines. Its support, resistance and its middle line. Right now we are moving within the lower half of it, leaving a lot of space uncovered and need to be closed. We are seeing today as well a little red bull-hammer which might be indicating our next wick or move upwards for tomorrow.
Overall?
Overall, we are still bearish. We are still going down and this close below 3434 is really a doom. At least for this week and the next days. Nevertheless, we can't be jumping on the short hype train too fast and shoring BTC to the ground. We have to expect a wick upwards and let it confirm, giving ourselves confirmation, that the previous support of 3550 and 3434 is now resistance. This area that is being opened in the lower half of the descending channel is quite big. Yet, 19 days without confirmation will not create us magically a 500$ candle which then will confirm the resistance. This will have to wait until the MF divergence is done and or we see a double bottom on the low 3k levels.
What do we want?
We want a test of 3333 and then a rejection at below 3.6k bringing us back down to low 3k levels.
Position?
Considering a small short position with staggers to the middle of the descending channel.
Like and Follow me and you will find this page interesting because I am a TA expert and professional day trader in crypto since 2012 that does daily updates and new posts about the hottest and most discussed coins.
This is as always a delayed post, if you are interested in first hand news, feel free to join our group,
Cheers, TJ
