USDCAD - A Deeper Anal ysisThis time, I go deeper, much deeper into USDCAD. I've added some crude oil to make things a bit more comfortable and easy to digest.
I hope you find it enjoyable!
- R2F Trading
Forex-usdcad

USDCAD Prints a Bullish Wick off the January 2026 LowsFrom a technical perspective, extended lower shadows reflect rejected downside levels — in other words, bullish dominance over bearish pressure. The weekly timeframe adds further weight to this signal, especially when aligned with the recent surge in US ISM Manufacturing PMI.
For DXY, my framework maintains:
A bearish bias following a confirmed weekly close below the 96 level
A bullish bias only if price holds cleanly above 98, 99.50, and the key 100.40 level
Against this backdrop, the following scenarios emerge for USDCAD.
USDCAD briefly dropped toward levels last seen in 2024 near 1.3480 before recovering above the 1.36 mark. Applying Fibonacci extensions from the September 2024 low, February 2025 high, and January 2026 low, key upside levels emerge at 1.3860, 1.40, and 1.4150 — zones that would help confirm the sustainability of the rebound before another potential acceleration higher.
On the downside, the 1.3580–1.3420 support zone remains critical. A failure to hold this area could expose the pair to a deeper structural breakdown toward the 1.33 and 1.30 levels.
Overall, bullish and bearish scenarios for USDJPY and USDCAD are expected to move in tandem with DXY, as the index continues to test its long-term 2008–2026 trend support.
- Razan Hilal

USDCAD - 4H - LongThe Canadian dollar has perfectly executed 4 full profits and reached a critical zone at the 11th pullback.
Option 1 - We expect it to make a correction to the 12th pullback, which in turn coincides with the equilibrium zone and the disbalance zone. From there, it will react in a downward direction to execute the 13th pullback, which coincides perfectly with a Gartley reversal figure, which will strengthen the upward trend with an additional reaction from the Demand zone. This is the scenario with a black dotted line.
Option 2 - to execute the convergence directly and go in an upward direction to 1.40424.


UCAD Gets Ready To Serve A "Cup" This Morning!Price on OANDA:USDCAD has made a impressive rally up and based on the parameters, has completed what looks to be the "Bowl" of a popular Reversal Pattern, the Cup and Handle!
Now, since price has pushed above the Confirmation of Pattern @ 1.38056, we should expect price to make a retracement down to no lower than the 50% Fibonacci level @ 1.37289 to create the "Handle" or Higher Low, suggesting Bulls are reversing price.
Long Opportunities will be generated when:
1) Price is supported on the retracement at the 50% level
2) Once Price Breaks and Retests the completion of the pattern altogether
When price completes the pattern, I'll be looking for price to head to the next Resistance level around 1.39575 - 1.39774.

USDCAD: Market Sentiment & Price Action
The recent price action on the USDCAD pair was keeping me on the fence, however, my bias is slowly but surely changing into the bullish one and I think we will see the price go up.
Disclosure: I am part of Trade Nation's Influencer program and receive a monthly fee for using their TradingView charts in my analysis.
❤️ Please, support our work with like & comment! ❤️

USDCAD Is Back To Bearish ModeUSDCAD is turning sharply to the downside after last week’s break out of the upward channel, following strong jobs data from Canada. What we see now is a very powerful and strong decline that looks more like a third wave rather than a wave C away from the highs, especially since the price also breached the lower trend-line support of a potential base channel. This puts us in a bearish mode and suggests more weakness in the days or even weeks ahead, as the recovery from June can finally be ending. Expect more downside until we see five waves down from the 1.4139 level. Trend is now bearish while the market trades below 1.40.

USDCAD: Bullish Move After Trap 🇺🇸🇨🇦
I see a bearish trap on USDCAD after a test of a key
daily support.
A formation of a bullish CHoCH on a 4h time frame
during the Asian session today suggests a strong buying interest.
I expect a rise to 1.402
❤️Please, support my work with like, thank you!❤️
I am part of Trade Nation's Influencer program and receive a monthly fee for using their TradingView charts in my analysis.

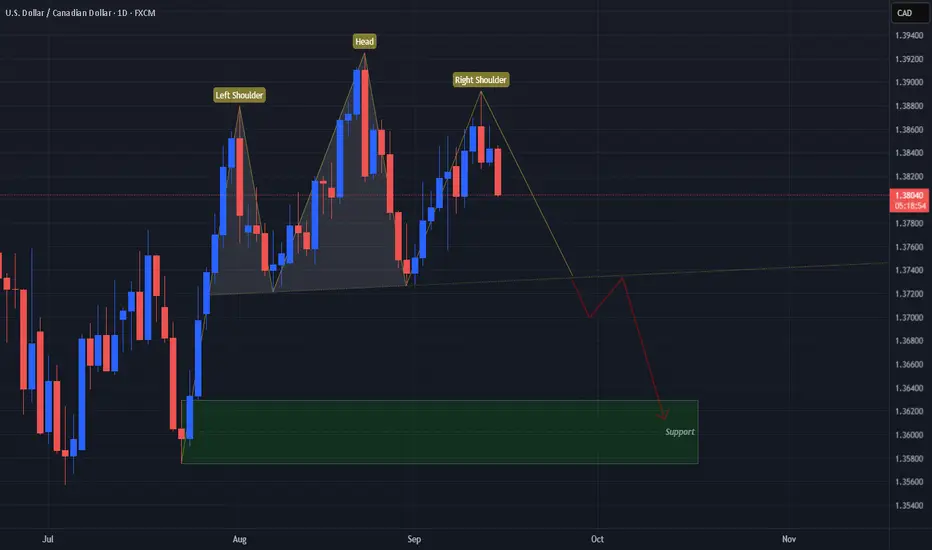
UCAD Dropping Signs of Potentially Strong ReversalOANDA:USDCAD has followed suit with last week so far with starting this week off continuing the decline in price from the Sept. 11th High beginning to form what looks to be a "Right Shoulder" or Lower High then the previous.
This strong triple Reversal Pattern is the Head and Shoulders!
Now the Right Shoulder was created but still has yet to form completely which will happen once price revisits the "Neckline" or Support Line price has been bouncing from to create the 3 peaks.
Once Price has Confirmed the Pattern, this should deliver potential Short Opportunities as a Head and Shoulders Breakout and Retest Scenario!
*The next suspected area Price will travel to if the Pattern is confirmed will be the Last Support Zone Price visited before beginning the formation of the Pattern.
USDCAD - LONG - Conviction: Medium | Chronex ( London • Sep 10 )Hello Guys!
🎯 90 % mechanical | Just your entry model
No trend-line art, no gut calls. Just a repeatable institutional process delivered every day at London Open
Context:
🧠 What Chronex does (bird’s-eye view)
- Scans all 28 major FX pairs every session.
- Ranks each currency’s relative strength / weakness from multi-TF data.
- Pairs strongest vs. weakest to create a tight outlook list.
- Adds built-in risk filters → posts one clean table: *Direction · Conviction · Entry zone · SL*.
📍 Today’s Playbook:
Risks
1. Do we have economic high impact news release?
2. Any higher-timeframe counter-trend zones?
3. Has better zone above/below?
Verdict:
💬 Drop questions, challenge the outlook, or share your own setups below!

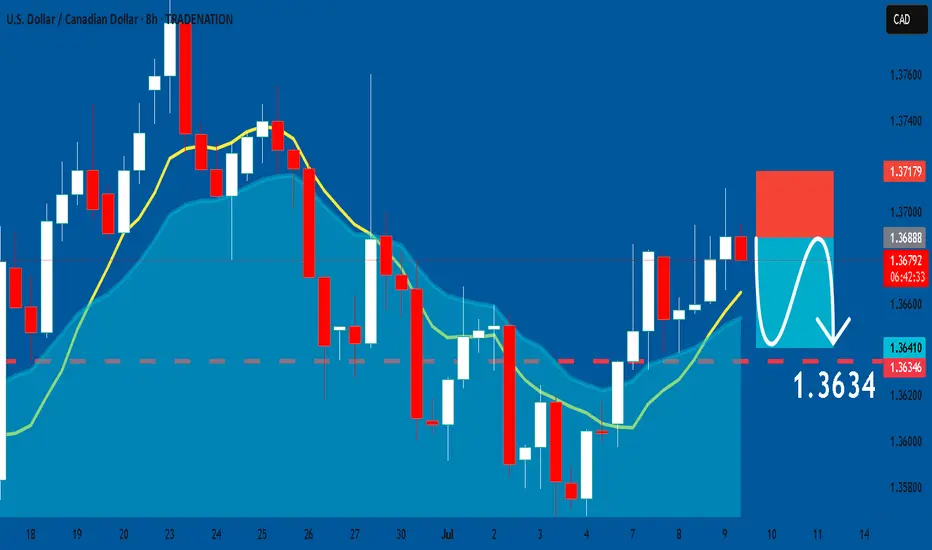
USDCAD: Bearish Continuation & Short Signal
USDCAD
- Classic bearish setup
- Our team expects bearish continuation
SUGGESTED TRADE:
Swing Trade
Short USDCAD
Entry Point - 1.3688
Stop Loss - 1.3717
Take Profit - 1.3634
Our Risk - 1%
Start protection of your profits from lower levels
Disclosure: I am part of Trade Nation's Influencer program and receive a monthly fee for using their TradingView charts in my analysis.
❤️ Please, support our work with like & comment! ❤️
UCAD Bulls Look for 3rd Test After Sept. '24 Highs TouchOANDA:USDCAD Bulls were able to find support at the Sept. 2024 Highs after having traveled down a Falling Support for the past 2 months!
Now we see Bulls pushing price higher creating a Rising Support with 2 tests having been successful and currently coming down for a 3rd test!
Now Price has already broken a Previous Level of Structure which was a Past Resistance on June 4th. This level also lands right at the 34 EMA and based on the Bollinger Bands, this test will also be a Mean Reversion where Price after having traveled in one direction will revert back to the mean of the Bollinger Bands for Continuation, which in this case will be Bullish!
After the 2nd Test of the Rising Support, we can see a Massive amount of Volume enters.
Price also is trading Above the 50 on the RSI and is currently coming down to test that level.
I am looking for Price to test the 1.3683 area and if Price shows support for a 3rd Test, this will be a great opportunity for Long Positions!
Fundamentally, USD will be bombarded heavy news being CPI numbers with analysts forecasting a .2% Increase in Inflation! Also PPI, Unemployment Claims and Prelim UoM Consumer Sentiment & Inflation Expectations.

UCAD Bears Ready to Break 2 Month Long Falling Support??OANDA:USDCAD has been supported by a Falling Support Trend line since August 14th and here soon Price could potentially give us a Bearish Break to that Trend line!
Once a Breakout is validated, we could look for a Retest Set-Up for some Short Opportunities to take Price down to the Support Zone created by the August and September 2024 Lows.
An interesting fact to point out is if you observe the reaction of Price when it tests the Falling Support, we can see Price arc and the following reactions arc smaller, suggesting Bulls are losing strength on the push off of the Falling Support!
Price Action is being heavily driven by Fundamentals in the markets this week:
-USD-
ADP Non-Farm Employment - Previous 60K / Forecast 111K / Actual 37K
ISM Services PMI - Previous 51.6 / Forecast 52 / Actual 49.9
ISM Manufacturing PMI - Previous 48.7 / Forecast 49.3 / Actual 48.5
ISM Manufacturing Prices - Previous 69.8 / Forecast 70.2 / Actual 48.5
Unemployment Claims - Previous 239K / Forecast 236K / Actual 247K
*Average Hourly Earnings, Non-Farm Employment and Unemployment Rate are to be released tomorrow
-CAD-
BOC held Interest Rates @ 2.75%
Ivey PMI - Previous 47.9 / Forecast 48.3 / Actual 48.9
*Employment Change and Unemployment are to be released tomorrow
With BOC holding Interest Rates and the Federal Reserve possibly looking to cut rates because of a "softening labor market", this could fuel CAD to overcome the pair and put Bears in control to pull Prices lower!
www.tradingview.com

USDCAD: Long Signal Explained
USDCAD
- Classic bullish formation
- Our team expects growth
SUGGESTED TRADE:
Swing Trade
Buy USDCAD
Entry Level - 1.3742
Sl - 1.3706
Tp - 1.3809
Our Risk - 1%
Start protection of your profits from lower levels
Disclosure: I am part of Trade Nation's Influencer program and receive a monthly fee for using their TradingView charts in my analysis.
❤️ Please, support our work with like & comment! ❤️

USDCAD Makes Retest At 200 EMA After Bull Trap BreakoutOANDA:USDCAD here on the 1Hr Chart has printed an Ascending Channel and Bears have made a Breakout!
Price currently looks to be on its way to retesting the Breakout of the Channel with the 200 EMA and Upper Bollinger Bands sitting at the Rising Support adding some heavy Bearish Pressure.
Fundamentally, BOC will be releasing GDP m/m ( Gross Domestic Product ) numbers tomorrow morning at 0730 AM CST with analysts forecasting a .3% Increase at .1% with Previous being -0.2%.

After a huge move, USD/CAD may be due to reboundUSD/CAD has strengthened significantly over the past few days as markets have been shaken by President Trump’s new trade war with Canada and the rest of the world. That said, USD/CAD may be due for a pause in its recent rally and could consolidate somewhat, having reached some key technical indicators and support levels.
The loonie’s relative strength index fell to 29, while USD/CAD dropped below the lower Bollinger Band at CA$1.387. This magnitude of movement suggests that USD/CAD is currently oversold and may be due for either a short-term rebound or a period of sideways consolidation. The pair could also bounce back towards resistance at CA$1.416 or the 20-day moving average at CA$1.421.
However, if USD/CAD breaks support at CA$1.3870, it could signal that further strengthening lies ahead, with the potential to drop towards CA$1.359, which served as an important area of support and resistance between December 2023 and October 2024.
USD/CAD could continue strengthening against the dollar; the greenback has weakened versus multiple currencies, and any pause in the dollar’s current downtrend may be short-lived, due to possible massive deleveraging out of the US and capital flow back to their nations of origin. Still, after such a significant move, USD/CAD seems potentially due for at least a short-term period of consolidation before the uptrend resumes.
Written by Michael J Kramer, founder of Mott Capital Management
Disclaimer: CMC Markets is an execution-only service provider. The material (whether or not it states any opinions) is for general information purposes only and does not take into account your personal circumstances or objectives. Nothing in this material is (or should considered to be) financial, investment or other advice on which reliance should be placed.
No opinion given in the material constitutes a recommendation by CMC Markets or the author that any particular investment, security, transaction, or investment strategy is suitable for any specific person. The material has not been prepared in accordance with legal requirements designed to promote the independence of investment research. Although we are not specifically prevented from dealing before providing this material, we do not seek to take advantage of the material prior to its dissemination.

USDCAD Buy setupOn USDCAD we are bearish for our next setup. Currently we are waiting for price to push till our areas of interest, where we will be looking to take short positions on this particular pair. Follow for more updates.

USDCAD Buy setupOn USDCAD we are bearish for our next setup. Currently we are waiting for price to push till our areas of interest, where we will be looking to go long this particular pair. Follow for more updates.

UCAD Bears Turn Liquid After 4% Decline From Feb. HighOANDA:USDCAD has been trading in a Sideways Consolidation for 2 months now and last week finally delivered a Breakout!
After the massive rally to 1.47926, price immediately plummeted down to not only fall back into the Consolidation Range but to then Breakout of the Support of that Consolidation.
This Breakout is followed by massive Bearish Volume on top of RSI breaking down below 50!
Price has satisfied all the Breakout Rules determining its validity, now to wait for a Retest of the broken support around the 23.6% Fibonacci Level or approx. 1.43 area for potential Short Opportunities to take down to the 1.41 area!
Fundamentally,
USD:
Tuesday - Empire State Manufacturing Index/ President Trump Speaks
Wednesday - FOMC Meeting Minutes
Thursday - Unemployment Claims/ Philly Fed Manufacturing Index/ Crude Oil Inventories
Friday - Flash Manufacturing PMI/ Flash Services PMI/ Existing Home Sales
CAD:
Tuesday - CPI
Friday - Retail Sales/ BOC Gov Macklem Speaks

USD/CAD may rise to 0.44005 - 0.44350Preference
Long positions above 0.42937 with targets at 0.44005 and 0.44350 in extension.
Alternative
If below 0.42937 look for further downside with 0.42676 and 0.42355 as targets.

USDCAD LONG conclusion;
weakly uptrend. weakly support reject
daily bullback
4hr fib golden zone reject .so entry
tp is 1 day support
OANDA:USDCAD

USD/CAD Bouncing at Trendline Support after Trudeau ResignsChart Analysis:
The USD/CAD pair has been in a steady uptrend, but recent price action shows signs of consolidation below the recent highs at 1.4450. The trendline support remains intact, keeping the bullish structure valid.
1️⃣ Key Support Zone:
The trendline from October lows aligns near 1.4300, acting as immediate support for the pair.
2️⃣ Moving Averages:
50-day SMA (blue): At 1.4111, providing dynamic support if the trendline breaks.
200-day SMA (red): At 1.3772, indicating the broader bullish bias.
3️⃣ Momentum Indicators:
RSI: At 60.26, cooling off from overbought levels, indicating room for further consolidation.
MACD: Positive but showing signs of a potential slowdown, with momentum waning slightly.
What to Watch:
A daily close below the trendline at 1.4300 could trigger further downside toward the 1.4111 support (50-day SMA).
Alternatively, holding above the trendline could attract buyers, pushing the pair back toward 1.4450 and potentially targeting new highs.
The bullish trend remains intact, but price action near the trendline will be critical in determining the next move.
-MW

TradeCityPro | USDCAD : Divergence Signals and Key Levels👋Welcome to TradeCityPro!
In this analysis, I will examine the USDCAD pair from the forex market. The analysis is conducted on the daily timeframe.
⏳ Daily Timeframe: Resistance and Potential Reversal
In the daily timeframe, we observe a range (box) between 1.32179 (support) and 1.38632 (resistance) that was recently broken. Currently, the price has reached the 1.40777 resistance level.
✨ A noticeable divergence is present in the RSI oscillator, with a trigger for this divergence being the break below the 55.94 level on the RSI. If this trigger is activated, the price could enter a correction phase.
📈 At the moment, after breaking out of the 1.38632 level and retesting it as support, the price is consolidating below the 1.40777 resistance. If this resistance is broken, the next target will be 1.43824.
🔽 However, if the RSI divergence is activated, a deeper correction may occur. In that case, the price could re-enter the range, with the first support at 1.36023 and the second support at the range's bottom, 1.32179.
💼 Considering the weakening momentum seen in the candles and the divergence signals, the likelihood of a correction is increasing. However, I personally prefer to wait for confirmation from the price to better identify future trends.
📝 Final Thoughts
This analysis reflects our opinions and is not financial advice.
Share your thoughts in the comments, and don’t forget to share this analysis with your friends! ❤️
