Forthusdt is almost done*forth is under 200ema
*Forth in under 0.6 fpi.
*Rsi is almost above 50
What i see is that forth is going to break the triangle that it trap on, with this break it will break 0.6 fpi and 200ema while it's moving above level 50 rsi .
My target will be 7$ as a beginning with the correction of the market before more dip
FORTHUSDT

UPDATE: FORTH UP 243% after bullish signal 🚀FORTH pumped 243% after the bullish Supertrend Ninja - Clean signal (green vertical line on the background).
FORTH broke out of the bullish Zone of the Ichimoku Cloud , which is bullish . The RSI is in the overbought zone at 85. RSI Brown at 123. If we take a look at the Average Directional Index ( ADX DI) its starting to be bearish , as it is pointing downwards. Currently FORTH is way above its upper Bollinger Band , Band Basis 20 Period SMA . A retrace back within the Bollinger Band is more likely. The risk to reward right now to enter a trade is bad.
Waiting patiently on a bullish Supertrend Ninja signal, before entering a long paid off.
Thank you for reading.
Namasté 🙏
Disclaimer: Ideas are for entertainment purposes only. Not financial advice. Your own due diligence is highly advised before entering trades. Past performance is no guarantee of future returns.
What Indicators Do I Use:
In the chart I am using the "Supertrend Ninja - Clean", which is a trend-following indicator (Green and red vertical lines on the background). When the background of the candlestick closes green (vertical line). It indicates a possible bullish (up)trend. And red for downtrends.

FORTHUSDT(Ampleforth) Daily tf Range Updated till 29-07-22FORTHUSDT(Ampleforth) Daily timeframe range. lately btc dominance helped a lot of alt to move freely. lot of money flown into here and there. it created a opportunity for mid and big buyers to buy through consolidation and profit out of move like 29 july 2022. and thats some insanely profitable move. but move like this always comes with a price if position isnt right there are change of getting trapped in a huge wick. and there are lot those in this chart. there are good amount of out of place moves and good difference in its range space. that came from the slow bleeding it had in past. its a high risk and reward alt, need to trade carefully.

Ampleforth FORTH - Huge falling wedge is breaking out! +Triangle
As you can see, we have a falling wedge on the daily / 3D chart, which is a bullish reversal pattern.
This is a fantastic buying opportunity when combined with a local ascending triangle!
My Elliott Wave analysis suggests that a main impulse wave has been completed, and that's why I expect a bullish retracement.
My main profit target is at the previous resistance (wave 4), or 0.618 FIB.
I think this downtrend is over and we should see some bullish price action in the immediate short term!
I expect tremendous pumps for selected altcoins. You can find them in the related section down below.
For more ideas, please hit "Like" and "Follow"!

FORTH - Ready for a breakout! Channel + Elliott wave
On the daily chart, we can clearly see a descending channel / falling wedge, which is ready for a breakout!
Buy a breakout above rectangle + 200 MA + trendline of the channel, we have a nice confluence here, that is very important!
This coin never made an all time high, so it is safe to set the profit target to 0.618 FIB + end of the wave 4 (High liquidity area).
Due to my Elliott wave analysis - Impulse Elliott wave has been completed successfully and we can expect at least a retracement.
200 daily moving average is considered as a massive level by huge instituions and hedge funds.
We have a high bullish volume and I don't see any bearish pressure on the indicator.
If we take a look at the RSI indicator, there is a horizontal level, so if we break this level, that would be great!
Look at my ideas about interesting altcoins in the related section down below ↓
For more ideas please hit "Like" & "Follow"!

FORTHUSDT - SETUPFORTHUSDT price is showing some hidden bullishness and we are sensing a strong upward move in coming sessions. As we can see on the chart a real accumulation is going on and a strong upside move is inevitable. Let's wait for the confirmation.

FORTH formed bullish Gartley for upto 20% pumpHi dear friends, hope you are well and welcome to the new trade setup of Ampleforth Governance Token ( FORTH ) with BTC pair.
On a 12-hr time frame FORTH has formed bullish Gartley pattern.

FORTHUSDT Hello Traders
Today we are take a look and analysis of #FORTHUSDT chart.
This currency can have good days ahead after forming a pattern.
Note that the drawn support level must be maintained so that we can expect good growth from it.
The current price of this currency is $ 6.71 and it has a good price to buy up to $ 4.5.
Expecting higher prices up to $ 13.5 is not far off at all.
I hope you see this analysis and can benefit from it.

forthusdtit sitting right in the bottom
please set up your stop loss as there is no more resistance under

FORTH with patience and with targetsYOUR LIKE OR COMMENT IS MY FUEL FOR NEXT ANALYSIS :) IF U HAVE ANY QUESTION REACH ME HERE
This is not a financial advice. Always do your own research and always put stoploss in your trade (SL) :) If you want more detailed info
how to study and read charts or just need help with some coin, just write to me here a comment, i will try to answer to everybody...
i can help you :) all for free, don't worry, BE HAPPY!

FORTH in the roadMost of my capital in crypto is on this coin so I'm not neutral on this chart but chart never lied to us
a good volume bought this week
Finally, I apologize, my English is awful
#AKUMA

FORTHUSDTHello dear friends and companions
If you are fixed above the yellow area, you can enter a step

Get Ready for a Long!BINANCE:FORTHUSDT
Just wait to see the trendline break and the retest... then Enjoy!

FORTH ideaYOUR LIKE OR COMMENT IS MY FUEL FOR NEXT ANALYSIS :) IF U HAVE ANY QUESTION REACH ME HERE
This is not a financial advice. Always do your own research and always put stoploss in your trade (SL) :) If you want more detailed info how to study and read charts or just need help with some coin, just write to me here a comment, i will try to answer to everybody... i can help you :) all for free, don't worry, BE HAPPY!

Bullish on The $FORTHThe pump is just a matter of time.
About The Token :
FORTH is Ampleforth’s (AMPL) governance token. FORTH holders can vote on proposed changes to the Ampleforth protocol or delegate their votes to representatives who vote on their behalf.
AMPL is the first-ever rebasing cryptocurrency. Like Bitcoin, AMPL is non-dillutive. Unlike Bitcoin, AMPL can be used to denominate contracts of predictable value. Where AMPL represents an independent currency that functions as a unit of account, FORTH is the governing mechanism that oversees its evolution.
FORTH was launched by the Ampleforth team as a "Day One launch" in conjunction with Coinbase in April of 2021.

D1 #FORTHUSDT up to 96% #FORTHUSDT (Long Term) Risky
Buy : 14.068
Target 1: 17.620
Target 2: 19.909
Target 3: 22.466
Target 4: 24.700
Stoploss: 12.500

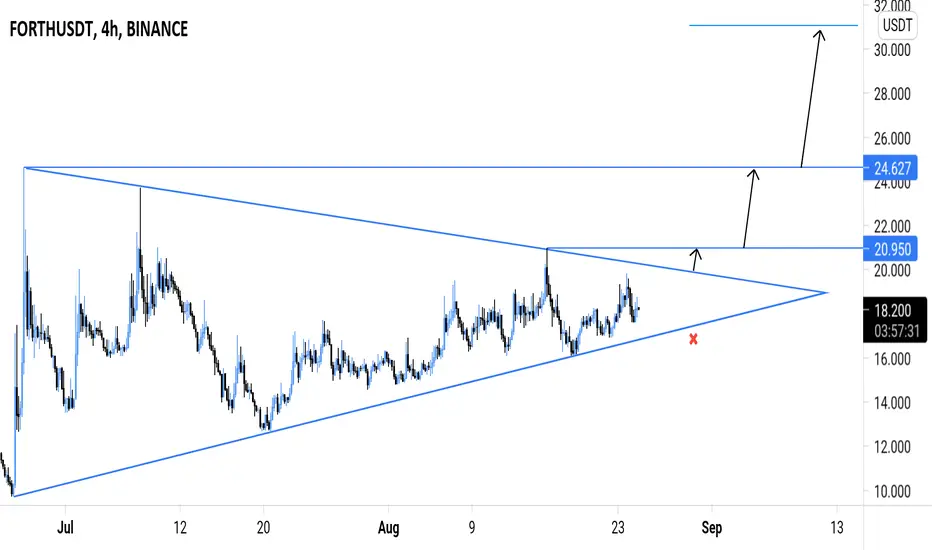
FORTH/USDT { AMPLEFORTH GOVERNANCE TOKEN } - BULLISH SETUPANALYSIS 🔎
- FORTH/USDT is consolidating in a symmetrical triangle pattern .
- Price is testing the symmetrical triangle's inclined resistance.
- There's a breakout potential.
BUY ENTRY ⬆️
- Market entry: current market price.
- Stop limit entry: breakout above the symmetrical triangle's inclined resistance.
- Limit entry: test of the symmetrical triangle's inclined support.
TARGETS 🎯
- Horizontal resistance level (@20.950).
- Horizontal resistance level (@24.627).
- Fibonacci extension levels.
SETUP INVALIDATION ❌
- Breakdown below the ascending triangle's inclined support.
Forthhow many people like this ? what is Forth ?
AMPL is like Bitcoin except it can be used in contracts
AMPL is a cryptocurrency and financial building-block. Much like Bitcoin, it is algorithmic and uncollateralized. However unlike Bitcoin, AMPL can be used to denominate stable contracts.

FORTHUSDTI expect a strong bull run for this token in the next few days. Below 15$ is our buy zone with targets that have been specified in the chart. This token also has a nice fundamentals and I saw some very good points in the wall paper, so you can also see it as an investment

FORTHUSDT NEW ANALYSIS !!!Here we have the strong support of EMAs and RSI. The next 4H candle will show the exact road... Stay tuned for the RSI breakout or support.


