GOLD BUY - SCALP TRADE Gold looking to be heading up due to its structural trend and price action pattern so for this a trade can be entered
TRADE REQUIREMENTS
(Trial Stop+Partials)
Foryou

BTCUSD SCALP Btcusd looking to head up
To the 95k range due to its highs and structure therefore this gives an opportunity for us to scalp and (take partial profits + trial stop all propositions)

AVAX - Rising Wedge at $14.12 | ETF Filings Spark +11% Rally
Executive Summary
Avalanche (AVAX) trading at $14.12 within a rising wedge on the 2H timeframe. Price surged +11% this week as institutional ETF filings sparked a rally. Now testing upper resistance with two scenarios: bullish breakout above $14.75 or pullback to $12.00-$12.75 support zone before continuation.
BIAS: NEUTRAL - Watching for Breakout or Pullback
Current Market Data
Current: $14.123 (-0.82%)
Day's Range: $14.033 - $14.516
52-Week: $9.013 - $44.575
Market Cap: $6.08B
24h Volume: $384.76M
Technical Rating: Neutral
Performance:
1W: +11.80% | 1M: +6.89% | 3M: -53.89%
6M: -23.09% | YTD: +14.80% | 1Y: -66.85%
Key Catalyst
Institutional ETF filings sparked +11% rally
AVAX among altcoins with ETF filing momentum
Fortune 100 companies expected to launch blockchains on Avalanche
Strong ecosystem for enterprise adoption
Technical Structure - 2H
Rising Wedge Pattern:
Rising support and resistance trendlines (yellow dashed)
Wedge narrowing toward apex
Can break either direction
Currently testing upper resistance
Key Levels:
Resistance:
$14.50 - $14.75 - Upper resistance / breakout level
$15.00 - Psychological resistance
$16.00+ - Extended bullish target
Support:
$14.00 - Immediate support
$12.75 - Upper support zone
$12.00 - $12.75 - Major support zone (purple)
$11.75 - Deep support (red line)
SCENARIO ANALYSIS
BULLISH: Breakout Above $14.75
Trigger: 2H close above $14.75 with volume
Targets: $15.00 → $16.00 → $18.00
Catalyst: ETF momentum continues
BEARISH: Pullback to Support Zone
Rejection at upper wedge resistance
Pullback to $12.00-$12.75 support zone
Healthy retest before continuation
Buy opportunity at support
My Assessment
Rising wedge at resistance after +11% ETF-driven rally. Two scenarios: breakout above $14.75 or pullback to $12.00-$12.75 support zone. ETF filings provide fundamental catalyst. Watch for confirmation before entry.
Strategy:
Long above $14.75 breakout → Target $15, $16, $18
Or wait for pullback to $12.00-$12.75 support
Long at support with stop below $11.75
Target $14.50+ on bounce
List your thoughts below!

BITCOIN BLUES - PROFIT Bitcoin performance has gone as expected and is near our target of 95k , however can close 50-70% of the trade or trial stop stay tuned for more opportunities and news

GOLD UPDATE XAUUSD Gold going well and can close partials and trail your stops , if needed can swing but carefully according to your experience and skill

BUY STOP EURJPY Buy reversal towards the upside price
Eurjpy buy @ 183.8+
TP1: 183.888
TP2:183.933
TP3: 183.988
TP4 :184.040
SL - 183.390

BUT STOP 183.800Buy reversal towards the upside price
Eurjpy buy @ 183.8+
TP1 : 183.888
TP2 : 183.933
TP3 : 183.988
TP4 : 184.040
SL - 183.390
BUY EURJPY 183.8+Eurjpy hit last SL due to it being too tight hang in there we have another trade with potential to the upside for a price reversal and continue with the direction of the week


HUGE BLUES & PROFITSEurjpy has absolutely hit (TAKE PROFIT) and performed as expected all targets hit
EXPECTED PRICE EXCEEDED : 184+

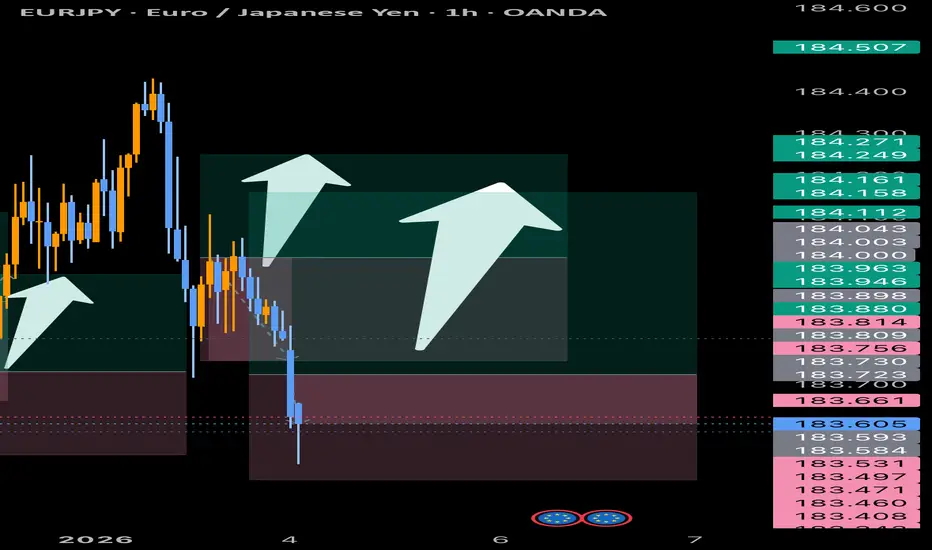
EURJPY MORNING STAR Eurjpy looking to reverse to to the upside due to price can expect a morning star and dojis but regardless we are looking at 184+ due to how we have been testing lows and highs we need a new price break

BUY EURJPY 183.9+Euroy looking to fill its gap to the upside and break into a new price because of the new year and new price stay tuned for the update when we reach a new price 184.9+
EXPECTED REAL PRICE :185
Fot the year 2026

183.5+ EURJPY BUY Eurjpy Buy @ 183.580
TP1 : 183.660
TP2 : 183.680
TP3 : 183.700
TP4 : 183.900
SL : 183.080
Trading is risky make sure to move (SL) to (Profit) and close partials if you can
Trade requirements - (50/50)+Trial Stop

USD/JPY)Bullish trend analysis Read The captionSMC Trading point update
Technical analysis of USDJPY – 4H chart using SMC + Fibonacci OTE + EMA support.
⸻
Market Context (4H)
• Primary bias: Bullish continuation
• Higher-timeframe structure remains bullish
• Price is holding above EMA 200, confirming HTF trend
• Recent drop is a corrective pullback, not a reversal
⸻
Structure & Price Behavior
• Price made an impulsive move up → now correcting
• Pullback is moving into a discount zone
• Market is aligning with OTE (Optimal Trade Entry) levels
• EMA 200 + EMA 50 are acting as dynamic support
This is a textbook pullback → continuation setup.
⸻
Key Buy Zone (OTE + HTF Demand)
~155.40 – 155.70
Why this zone matters:
• Fibonacci OTE (0.705 – 0.79)
• HTF demand zone
• EMA 200 confluence
• Prior structure support
• Marked reaction area (green arrow)
This is where smart money typically reloads longs.
⸻
Trade Idea (Primary Scenario)
BUY Setup
• Entry: 155.40 – 155.70
• Stop Loss: Below 155.00
• Targets:
• TP1: 156.50
• TP2: 157.20
• Final TP: 157.75 (marked target point / liquidity above highs)
Risk–Reward: ~1:3+
⸻
Confirmation Checklist
Wait for confirmation inside the zone:
• Bullish engulfing candle
• Strong rejection wicks
• Lower-TF CHoCH
• No acceptance below EMA 200
⸻
Invalidation
• 4H close below ~155.00
• Acceptance below HTF demand + EMA 200
If invalidated → expect deeper correction toward lower support.
⸻ Mr SMC Trading point
Summary
This setup shows a high-probability bullish continuation
• Trend intact
• Pullback into discount
• OTE + EMA + demand confluence
• Clear upside liquidity target
Please support boost this analysis

EUR/USD) Bullish trend analysis Read The captionSMC Trading point update
Technical analysis of EURUSD – 4H chart, aligned with SMC + structure + EMA support.
⸻
Market Context (4H)
• Primary bias: Bullish continuation
• Higher-timeframe structure remains higher highs & higher lows
• Price is trading above EMA 200, confirming bullish HTF bias
• Current move is a healthy correction, not trend reversal
⸻
What Price Is Doing
• Price is consolidating inside a descending corrective channel
• The pullback has reached a discount area
• Price tapped a bullish order block (OB) + EMA support
• This is typical re-accumulation before continuation
⸻
Key Zones
HTF Demand / Order Block
~1.1720 – 1.1740
• Marked OB zone
• Confluence with EMA 50 & EMA 200
• Previous resistance → support flip
• Strong reaction zone (green arrow)
Invalidation Zone
~1.1680
• Acceptance below this level weakens bullish structure
⸻
Trade Idea (Primary Scenario)
BUY Setup (Continuation Play)
• Entry: 1.1720 – 1.1740
• Stop Loss: Below 1.1680
• Targets:
• TP1: 1.1780
• TP2: 1.1820
• Final TP: 1.1867 (HTF target / liquidity above highs)
Risk–Reward: ~1:3+
⸻
Confirmation Checklist
Look for:
• Bullish engulfing or strong rejection from OB
• Lower-TF CHoCH
• Failure to close below demand
• Momentum expansion to the upside
⸻
Invalidation
• 4H close below 1.1680
• Acceptance below HTF demand + EMA 200
If invalidated → expect deeper pullback toward lower demand.
⸻ Mr SMC Trading point
Summary
This setup represents a classic bullish continuation:
• Trend intact
• Correction into discount
• OB + EMA confluence
• Clear upside liquidity target
Please support boost this analysis

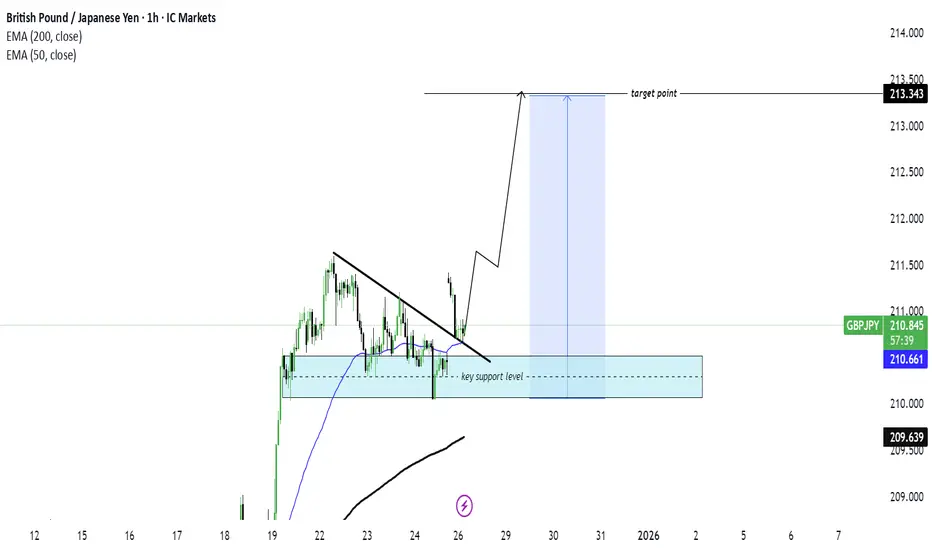
GBP/JPY) Bullish trend analysis Read The captionSMC Trading point update
Technical analysis of GBPJPY – 1H chart using SMC + structure break + support flip.
⸻
Market Context
• Bias: Bullish continuation
• Strong impulsive move up → market entered consolidation
• Structure shows accumulation above key support
• EMA alignment:
• EMA 50 above EMA 200
• EMA 50 acting as dynamic support
⸻
What the Market Did
• After the impulsive rally, price formed a descending corrective structure
• That structure was broken to the upside → bullish BOS
• Price is now holding above a key support zone (blue area)
This signals re-accumulation, not distribution.
⸻
Key Support / Demand Zone (Blue Area)
~210.20 – 210.60
Why this zone matters:
• Previous resistance → support flip
• Multiple reactions (acceptance)
• EMA 50 sitting inside the zone
• Liquidity sweep below support → quick recovery
This is where buyers are defending positions.
⸻
Trade Idea (Continuation Long)
Buy on pullback or buy on confirmation
• Entry: 210.30 – 210.60
• Stop Loss: Below support (~209.90)
• Targets:
• TP1: 211.50 (recent high)
• TP2: 212.60
• Final TP: 213.30 – 213.50 (marked target point / liquidity above highs)
Risk–Reward: ~1:3+
⸻
Confirmation Triggers
Best confirmations:
• Bullish engulfing candle from support
• Strong rejection wick (liquidity grab)
• Lower-TF CHoCH
• Momentum expansion after pullback
⸻
Invalidation
• 1H close below ~209.90
• Acceptance below EMA 50 + support zone
If this happens → bullish continuation idea is invalid, and price may rotate deeper.
⸻ Mr SMC Trading point
Summary
This setup is a classic bullish continuation after consolidation:
• Trend intact
• Structure break
• Support flip + EMA confluence ✔
Please support boost this analysis
BTC/ISD)Bullish trend analysis Read The captionSMC Trading point update
Technical analysis of BTCUSDT – 1H chart using SMC + Fibonacci OTE + EMA confluence.
⸻
Market Context
• Bias: Bullish continuation
• Clear impulsive bullish displacement broke previous structure
• Price is holding above EMA 50 & EMA 200
• Current move down is a controlled pullback, not a reversal
⸻
What the Market Is Doing
• After the impulse, price retraced to rebalance inefficiency
• Pullback is occurring into discount within an uptrend
• Structure remains intact → buyers still in control
⸻
Key Buy Zone (Blue Area)
~87,600 – 88,050
This zone is high-probability because of:
• Fib OTE zone (0.705 – 0.79)
• SMC demand / order block
• EMA 50 support (~87,983)
• Prior consolidation before impulse
• Long lower wicks → sell-side liquidity taken
This is where smart money typically reloads longs.
⸻
Fibonacci Logic
Measured from the impulse low → high:
• 0.5 / 0.62 = shallow retracement
• 0.705 – 0.79 = optimal trade entr
Ideal location for trend continuation setups
⸻
Trade Idea (Continuation Long)
Buy on confirmation inside demand
• Entry: 87,650 – 88,050
• Stop Loss: Below demand (~87,100)
• Targets:
• TP1: 88,900 (recent high)
• TP2: 89,600
• Final TP: 90,360 (marked target point / liquidity above highs)
Risk–Reward: ~1:3 to 1:4
⸻
Confirmation Triggers (Important)
Only enter if you see:
• Bullish engulfing or strong rejection wick
• Lower-timeframe CHoCH
• Failure to accept below the OTE zone
• Momentum expansion after tapping demand
⸻
Invalidation
• 1H close below ~87,100
• Acceptance below EMA 50 + demand
If this happens → bullish idea is invalid, and price may seek deeper liquidity.
⸻ Mr SMC Trading point
Summary
This is a textbook bullish continuation setup:
• Strong impulse
• OTE + demand + EMA confluence
• Clear upside liquidity target
Please support boost this analysis

XAU/USD)Bullish trend analysis Read The captionSMC Trading point update
Technical analysis of XAUUSD (Gold) – 4H chart using SMC + EMA + HTF support logic.
⸻
Market Context (4H)
• Primary bias: Bullish continuation (after correction)
• Strong impulsive sell-off was corrective, not a trend change
• Overall higher-timeframe structure is still bullish
• Price is now reacting from a key HTF support zone
⸻
What Just Happened
• Price swept sell-side liquidity aggressively
• Immediate rejection from lows → strong bullish reaction
• This indicates smart-money absorption at discount
• Market is now in a recovery / rebalancing phase
⸻
Key Levels on Chart
HTF Demand / Strong Support Zone
~4,285 – 4,325
• Labeled as key strong support level
• Previous consolidation base
• Where institutions previously accumulated
• Area of highest-probability defense
FVG / Re-entry Zone
~4,345 – 4,365
• Inefficiency left by impulsive drop
• Ideal pullback / continuation zone
• Price already reacting here (green arrow)
⸻
Trade Idea (Primary Scenario)
BUY Setup (Continuation Play)
• Entry: 4,345 – 4,365
• Stop Loss: Below 4,285
• Targets:
• TP1: 4,403 (EMA 50 / mid-structure)
• TP2: 4,480
• Final TP: 4,520 (marked target point / liquidity above highs)
RR potential: ~1:3+
⸻
Confirmation Checklist
Before committing size, look for:
• Bullish engulfing from FVG
• Strong rejection wicks
• Lower-timeframe CHoCH
• Price holding above the strong support zone
⸻
Invalidation
• 4H close below ~4,285
• Acceptance below HTF demand
If that happens → bullish continuation is invalid, and deeper downside is possible.
⸻ Mr SMC Trading point
Summary
This setup shows classic HTF liquidity grab → reaction → continuation:
• Sell-side liquidity taken
• Strong HTF demand respected
• FVG acting as re-entry
• Clear upside liquidity target
Please support boost this analysis

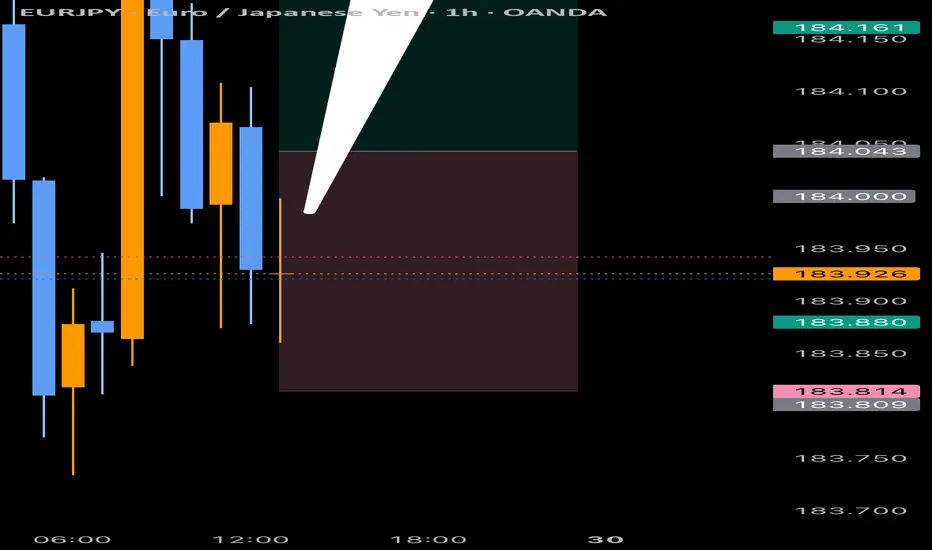
EURJPY 184+-185+Eurjpy Buy @ 184.100
TP1 : 184.160
TP2 : 184.222
TP3 : 184.300
TP4 : 184.400
SL : 183.710
Move stop loss to entry 50/50 required
Partials
EUR/USD) Bullish trend analysis Read The captionSMC Trading point update
Technical analysis of EURUSD – 2H chart using SMC + Fibonacci OTE + EMA trend continuation.
⸻
Market Context
• Bias: Bullish continuation
• Overall structure shows higher highs & higher lows
• Strong impulsive move followed by healthy corrective channels
• Price is holding above EMA 200, confirming HTF bullish bias
• EMA 50 is acting as dynamic intraday support
⸻
What Price Is Doing
• After a strong bullish displacement, price entered a descending corrective channel
• That channel has now broken to the upside (bullish BOS)
• Current pullback is a retest / re-accumulation, not weakness
This is classic trend → correction → continuation behavior.
⸻
Key Buy Zone (Blue Area)
~1.1735 – 1.1750
Why this zone is high-probability:
• SMC demand / order block
• Fib OTE zone (0.705 – 0.79)
• EMA 50 + EMA 200 confluence
• Previous resistance → support flip
• Multiple reactions already marked (green arrows)
This zone represents institutional rebalance, not retail buying.
⸻
Fibonacci Logic
Measured from the latest impulse low → swing high:
• 0.5 / 0.62 = shallow pullback
• 0.705 – 0.79 = optimal trade entry (OTE)
Textbook continuation location in a bullish market
⸻
Trade Idea (Continuation Long)
Buy on confirmation inside demand
• Entry: 1.1735 – 1.1750
• Stop Loss: Below demand (~1.1710)
• Targets:
• TP1: 1.1780 (recent high)
• TP2: 1.1820
• Final TP: 1.1880 – 1.1890 (marked target point / liquidity above highs)
Risk–Reward: ~1:3+
⸻
Confirmation Triggers (Important)
Only take the trade if you see:
• Bullish engulfing or strong rejection wick from the zone
• Lower-timeframe CHoCH
• Failure to accept below the OTE zone
• Momentum expansion after tapping demand
⸻
Invalidation
• 2H close below ~1.1710
• Acceptance below EMA 200 + demand zone
If this occurs → bullish continuation idea is invalid, and price may rotate deeper.
⸻ Mr SMC Trading point
Summary
This setup is a textbook bullish continuation:
• Trend intact
• Corrective structure resolved
• OTE + demand + EMA confluence
• Clear upside liquidity target
Key edge: wait for price to confirm buyers inside discount — don’t chase the highs.
Please support boost this analysis

EUR/USD)Bullish trend analysis Read The captionSMC Trading point update
Technical analysis of EURUSD – 1H chart using SMC + Fibonacci OTE + EMA confluence.
⸻
Market Context
• Bias: Bullish continuation
• Overall structure remains higher highs & higher lows
• Price is still above the EMA 200, keeping the higher-timeframe bullish bias intact
• The recent downside move is a corrective pullback, not a reversal
⸻
Why Price Is Pulling Back
• After the impulsive rally, price tapped short-term resistance (0 level)
• Profit-taking caused a retracement into discount
• Pullback is orderly and aligned with trend structure
⸻
Key Buy Zone (Blue Area)
~1.1728 – 1.1742
This zone is high-probability due to strong confluence:
• SMC demand / order block
• Fib OTE zone (0.705 – 0.79)
• EMA 200 support
• Rising internal trendline
• Marked buyer reaction (green arrow)
This area is where institutions typically rebalance long positions.
⸻
Fibonacci Logic
Measured from the latest impulse low → high:
• 0.5 / 0.62 = shallow retracement
• 0.705 – 0.79 = optimal trade entry (OTE)
Ideal location for trend continuation longs
⸻
Trade Idea (Continuation Long)
Buy on confirmation inside demand
• Entry: 1.1730 – 1.1740
• Stop Loss: Below demand (~1.1705)
• Targets:
• TP1: 1.1779 (EMA 50 / mid-range)
• TP2: 1.1800
• Final TP: 1.1820 (marked target point / liquidity above highs)
Risk–Reward: ~1:3+
⸻
Confirmation Triggers (Very Important)
Only take the trade if you see:
• Bullish engulfing or strong rejection wick
• Lower-timeframe CHoCH
• Failure to accept below the OTE zone
• Momentum expansion after tapping demand
⸻
Invalidation
• 1H close below ~1.1705
• Acceptance below EMA 200 + demand
If this happens → bullish idea is invalid, and price may seek deeper support.
⸻ Mr SMC Trading point
Summary
This setup is a textbook bullish pullback:
• Trend intact
• OTE + demand confluence
• Clear upside liquidity target
Please support boost this analysis

XAU/USD)Bullish trend analysis Read The captionSMC Trading point update
Technical analysis of XAUUSD (Gold) – 1H chart using SMC + Fibonacci OTE + trend-channel continuation.
⸻
Market Context
• Bias: Bullish continuation
• Price is respecting a well-defined ascending channel
• Market structure remains higher highs & higher lows
• EMAs:
• EMA 50 above EMA 200
• EMA 50 acting as dynamic support
• Recent consolidation near highs = absorption, not reversal
⸻
What Price Is Doing
• After the impulsive rally, price paused at internal resistance
• This pause is forming a controlled pullback
• The projected path shows a dip into discount → continuation higher
This is classic trend continuation behavior.
⸻
Key Buy Zone (Lower Blue Area)
~4,475 – 4,495
Strong confluence here:
• SMC demand / order block
• Fib OTE zone (0.705 – 0.79)
• EMA 50 support (~4,498)
• Rising channel support
• Clear reaction point (green arrow)
This is the high-probability long zone, not the current price.
⸻
Fibonacci Logic
Measured from the impulse low → recent high:
• 0.5 / 0.62 = shallow retracement
• 0.705 – 0.79 = optimal trade entry (OTE)
Institutions typically rebalance longs here in an uptrend
⸻
Trade Idea (Continuation Long)
Buy on confirmation inside demand
• Entry: 4,475 – 4,495
• Stop Loss: Below demand & channel (~4,455)
• Targets:
• TP1: 4,535 (recent high)
• TP2: 4,560
• Final TP: 4,575 – 4,580 (marked target / upper channel liquidity)
Risk–Reward: ~1:3 or better
⸻
Confirmation Triggers (Important)
Only execute if you see:
• Bullish engulfing or strong rejection wick from the zone
• Lower-timeframe CHoCH
• Failure to accept below the OTE zone
• Momentum expansion after tapping demand
⸻
Invalidation
• 1H close below ~4,455
• Acceptance below channel support + EMA 50
If this occurs → bullish continuation idea is invalid, and price may rotate deeper.
⸻Mr smc Trading point
Summary
This setup is a textbook bullish pullback:
• Trend intact
• OTE + demand + EMA confluence
• Clear upside liquidity target
Key edge: wait for price to come discount and confirm buyers, don’t chase highs.
Please support boost this analysis

XAU/USD)Bullish trend analysis Read The captionSMC Trading point update
Technical analysis of XAUUSD (Gold) – 1H chart using trend structure + SMC + Fibonacci OTE.
⸻
Market Context
• Overall bias: Bullish
• Price is respecting a rising channel
• Market structure still shows higher highs & higher lows
• Recent drop is a healthy pullback, not a trend reversal
⸻
Why Price Is Pulling Back
• Price reacted near short-term resistance (0 level)
• Profit-taking + liquidity sweep caused a retracement
• Pullback is heading into a discount zone within an uptrend
⸻
Key Buy Zone (Blue Area)
~4,465 – 4,480
This zone has strong confluence:
• SMC demand / order block
• Fib OTE zone (0.705 – 0.79)
• EMA 50 support
• Rising trendline support
• Clear reaction level (green arrow)
This is where buyers are expected to defend the trend.
⸻
Fibonacci Logic
Measured from the recent impulse low → high:
• 0.5 / 0.62 → shallow retracement
• 0.705 – 0.79 → institutional rebalance zone
Textbook area for trend continuation entries
⸻
Trade Idea (Continuation Long)
Buy on confirmation inside demand
• Entry: 4,465 – 4,480
• Stop Loss: Below demand & trendline (~4,450)
• Targets:
• TP1: 4,500 (internal structure high)
• TP2: 4,525
• Final TP: 4,551 (marked target point / liquidity above highs)
Risk–Reward: ~1:3 or better
⸻
Confirmation Triggers (Important)
Only enter if you see:
• Bullish engulfing or strong rejection wick
• Lower-TF CHoCH
• Failure to close below the demand zone
• Momentum expansion after tapping the zone
⸻
Invalidation
• 1H close below ~4,450
• Acceptance below trendline + EMA 50
If this happens → bullish idea is invalid, and price may seek the lower support.
⸻ Mr SMC Trading point
Summary
This setup is a high-probability bullish pullback:
• Trend intact
• Fib OTE + demand
• Clear upside liquidity target
Please support boost this analysis
