$FSLY Bullish ReversalTechnology / Software Co. Fastly ( $FSLY ) has setup nicely to continue with its bullish trend.
Looking at weekly chart its found some solid buying interest at previous highs ( 35.25 ) set all the way back in Sept. 19'
First target / resistance lines up with its 50% retrace of its last move lower around 49.00
If we can see a break and hold above its halfway back setup and weekly trend line, $FSLY looks for a nice swing towards second target at 72.55
Long term I'm looking to play retest / potential break above ATH
- Krecioch
FSLY

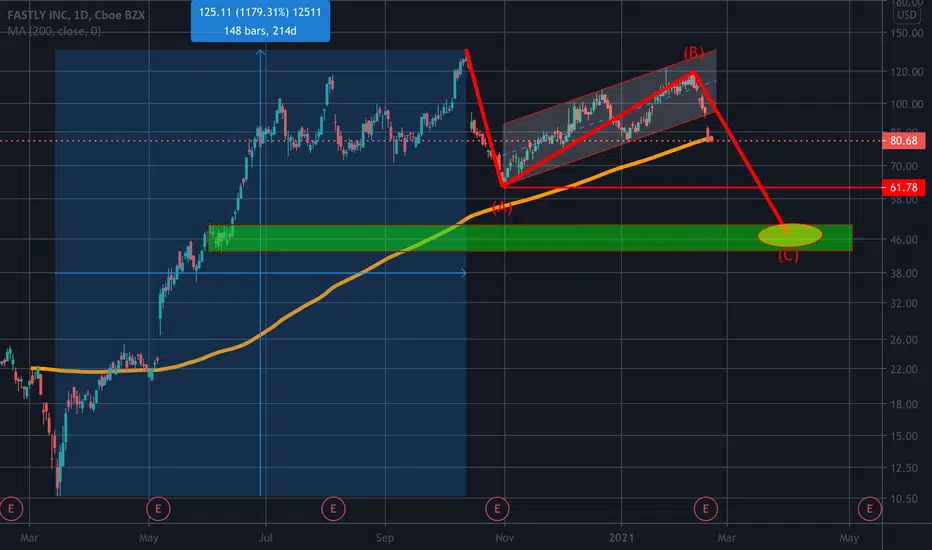
FSLY Fastly Head and Shoulders Price TargetThe head and shoulders pattern is one of the most reliable trend reversal patterns.
The distance from the neckline to the head is the same for the retracement from the neckline to the bottom.
In this case, using Renko candles to understand better the H&S chart pattern, the price target is 31usd.

Fastly FSLY is bottoming outFastly stock FSLY is bottoming out forming a potential higher low.
The stock could target $53.94 - $57.45 - $60.65 levels consecutively.

FSLY: Ichimoku bullish set up with all levelsFSLY Ichimoku analysis and all supports and resistance
Ichimoku : Price above the cloud, lagging span broke kinjun and tenkan = bullish on daily, long trend.
Mind the 1st resistance and enter accordingly.
All levels are on the chart (support and resistances).
I'm long. Swing trade with option expiring in January 2022.
Trade safe.

$FSLY Long CallsFSLY in history always does dumb ass-ending channel upwards followed with massive market moves. I'm going to go ahead and pick up $70c for 8/20.
Not financial advice. Do whatever you want. Also give me feedback!

FSLY about to explode and fill gap. Above avg volume trend. Tapped down trend line this morning and quickly reversed above previous 5 day highs. Price Tgt 60.

FSLY that should be the bottom or CloseBeautiful B pullback to the .764 Fib, possible it drops to $35 but this is the area you want to get in. Big trendline and FIB support, you could scale in, buy low sell high! The crowd hates it now, that's a good thing.


FSLY - looking for a break out soonWatching closely if it breaks 69.8 level TG 1 will be 77 TG 2 will be 80 which will confirm ABCD pattern

FSLY update on the trndStill have not entered. No confirmation for me quire yet.
It doesn't hurt to wait and be patient and not proceed too FSLY, unlike that poor container ship captain! Someone is probably gonna suez asz
LIKE/SHARE!!! Thank you!

FSLY Death Cross + Break in Support could bring big downsideFSLY is down approximately 50% since January 27th and unfortunately it looks like the bleeding may continue. As you can see from the chart the retest of support is occurring in unison with the occurrence of the moving average death cross. I think there is a good chance support will be broken here in which case I believe we would likely see a further drop in price to $40-$50 level.

BULLISH- Cup & HandleQuick Update on FSLY! It has been exhausted for a while.
As of now, it's looking like a nice set up right now.
A clear Cup and Handle has formed.
If you take a look at the volume, every time the price drops, people tend to buy the dips.
Should be reaching to 75 soon.
If it can make it to 77, then it has a lot of potential to fill in the gaps from previous highs.
This is not financial advise, only for educational purposes.

FSLY forming a handleCup and handle finalizing? Wait for the buy signal here. Slow down, wait for confirmations, then enter fastly!
Fastly Hit like/follow if you like my ideas. Your support helps me fastly outwit the tradingview algorithms to put me in the top! Much appreciated!


Fastly 3.18.21$FSLY is currently trading at long-term support, dating back to June 2020; second-level support is at $62. March 16, 2021 close was approximately 45% less than ATH.
Fastly looking to break out of short-term resistance. First target is $81.
$FSLY is a volatile stock so trade with caution. I see it trading between $70 to $100 from here to EOY.

FSLY fast reversalFsly at a nice area of value for entry here. I like the latest candles on the daily indicating a reversal. Let me know your thoughts!!

FSLY looking very bullish swing tradeBullish divergence on BlueWave + Green dot buy signal.
RSI oversold, and sitting on a resistance line.
This is a swing trade analysis

FSLY about to break up?FSLY looks interesting, it has reached a recent LOW and a support level, now it could bounce back at it's TP or even new ATH.
Following days will be key to determine where it could go.
Good luck investors!

Will NET Bring Cloud Back To Life?NET NYSE:NET is a riskier play at this moment due to the overall weakness in tech stock and market conditions. But, in comparison to other companies in this sector NET is holding up fairly well and showing some relative strength. NET tried to get over $76 today and failed to hold above. Testing a strong support zone for the third time over the past two months and looks like we may be starting to bounce. Volume has been accumulating with 4 out of the last 6 days trading above NET's daily volume average. POC on the daily chart is right at $82.51 lvl. If SPY/QQQ can start to breakout this week $$ should flow back into the tech stocks and the cloud sector which has taken a solid beating can see some bullish movement. Ideally, we gap up to $78 and form an island reversal. But, a play over $76 with the right market conditions looks primed for a good swing.
EMA's serving as a resistance above in the 78-79 range, tough lvls to get through in the Low Volume Node (LVN)
4/16 $80 calls will be my swing of choice (4.35/4.65). IV is very low 21% IV percentile on NET and if the market starts to move back up these can pay out well!
*I entered a small NET position this week and will add more on break of $76 with volume.

LONG FSLY / MAKE OR BREAK AREA! Double bottom + Support + Double top + Classic bullish divergence on the RSI. A reversal it's probably starting! On top of that, it is very easy to manage your risk.

FSLY LONG ENTRY - BULLISH SHARKFSLY forming a bullish shark pattern. Negative ER was the massive gap down. While most other stocks are dipping with the overall market dip, FSLY has only slightly depreciated in value. It remains quite strong and is even right above the 886 (PCZ of Bullish Shark). I have been watching this stock trying to get the literal perfect entry at the 886 but its not gonna happen imo. 4H RSI div now forming. Stop below X, targets are A and C. LETS GO BOYS!!!

FSLY looking for a breakoutFSLY very oversold and RSI divergence spotted.
Dip over and has started the consolidation phase.
Possible support found at 80 (Good buy wall)
Earnings missed causing the drop. announced 2/17.
Looking at 3/26 100c
Greeks pulled 2/21
Delta
0.2179
Gamma
0.0153
Theta
-0.0812
Vega
0.0735

If you have Fastly, watch this..!Just closed below the 200 SMA for two consecutive days..! Take your money out of it fastly.