FTSE to 6850?FTSE 100 cleared out the June peak at 6511 and holds gains this morning - a close at post-pandemic highs today would be bullish and calls for return to 6850 area, big multi-year Fibonacci level and early March swing high failure zone. Fundamentals are looking much more positive on UK equities now. As per Goldman Sachs this week the UK is a ‘buy’ is fast becoming the consensus view.
Ftse100


UK100- To break up?FTSE100 is consolidating just under important resistance that lies around 6500.
I believe this resistance will be broken to the upside and UK index could see a new all-time high.
A buy around 6400 would be ideal for this anticipated break and, with a 100 points SL could easily reach 1:3 R:R

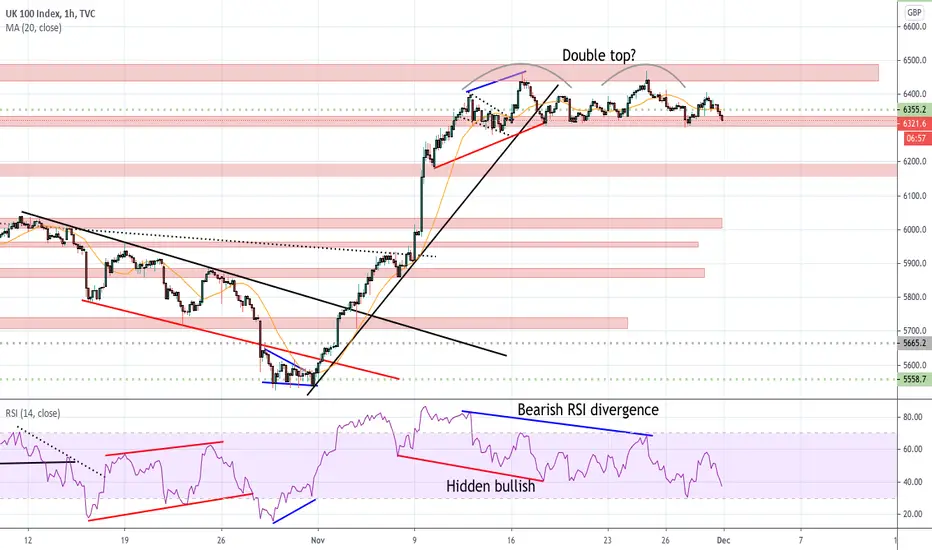
$UKX Hourly -Hourly close below 6305 confirms bearish double topHourly close below 6305 confirms bearish double top
FTSE 100 - Still holding our breath 🙏We are still waiting for the anticipated drop in FTSE100, Let's hope it happens.

ridethepig | FTSE Fundamental FlowsHere we are more or less back to square one as to where we were in July and testing away at the resistance.
Buyers are showing a lack of tenacity!
If after the Brexit fact (does not really matter if its a deal or hard brexit deal) we can see the possible outflow pressure really start to make itself felt. The strong counter here should immediately come under pressure with the initial loss of market access and broader global slowdown.
Once again (and with slow and steady pace) start to build some sell side exposure, abandon the overweight UK equities position and employ the following manoeuvres. A test of the centre looks rolled up and ready to take. Make excellent use of the flow towards 5,600.
Thanks as usual for keeping the feedback coming 👍 or 👎

FTSE 100 - Rainy and BearishWe see FTSE 100 stuck on resistance and unable to break over. Drop is inbound (or at least that's what we think here)


$UKX Hourly - Potential bearish H&S on the cardsConfirmed with a break and close below 6305. Follows yesterday bearish action. Still holding onto my shorts, opportunity to bring stops down and reduce risk.

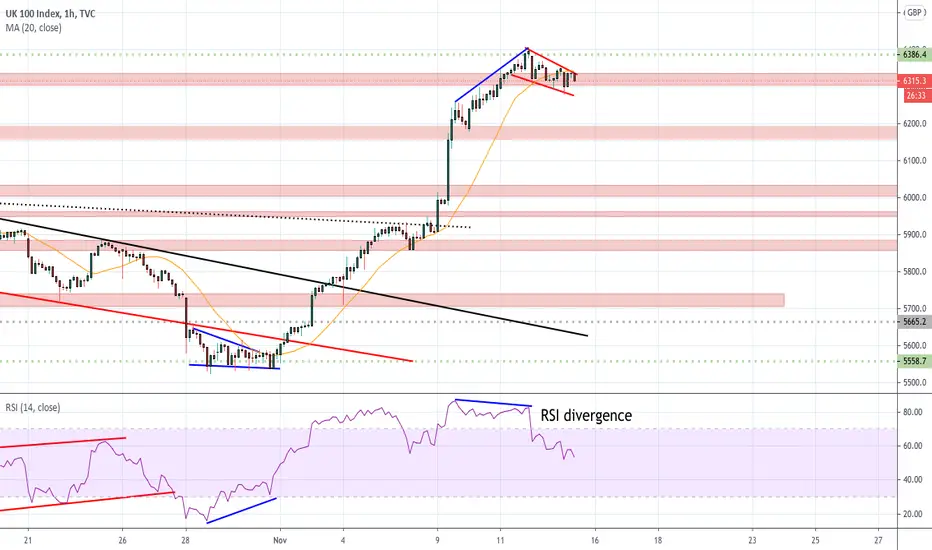
$UKX Hourly - Bounce but no follow through Index bounced off lateral support following the hidden bullish RSI divergence identified yesterday, but has lacked any meaningful following through. Fundamentally I still think this index is overstretched and happy to put on a decent RR short trade here on the backtest of the broken upward channel. Yesterday we saw the first signs of a possible change in trend. 20 SMA flat lining, price below, and a break and backtest of upward channel. First target = next lateral support around 6205. SL = close above 20SMA around 6380.

$UKX Hourly - IF this index is going to bounce it will be soonHidden bullish RSI divergence coming through as the price reaches a double support - lateral and upward sloping channel. Still no position.
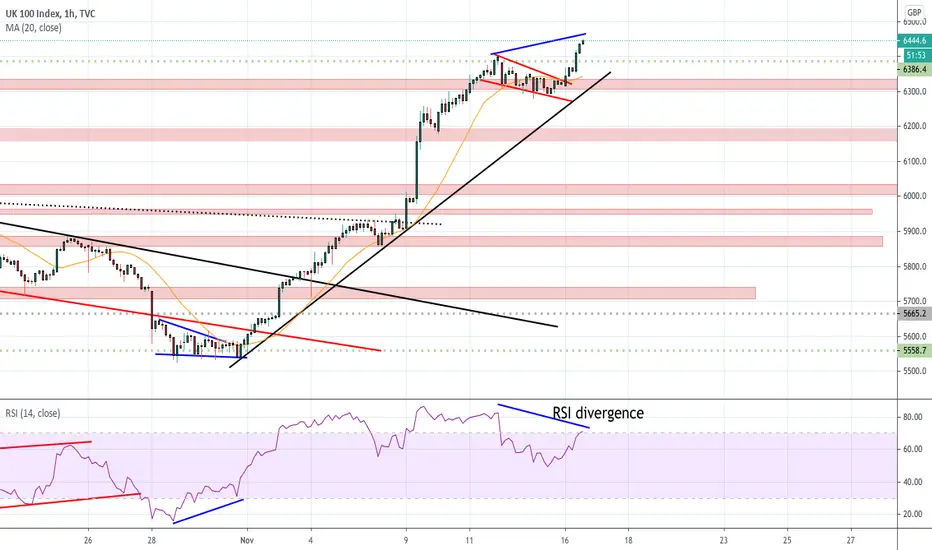
$UKX Hourly - Yesterday's headline rally lacking momentumDidn't chase yesterday's rally following vaccine headline news - as said I don't like chasing price breaks on headlines and this was confirmed with the RSI divergence. Still trading within an uptrend. No position and continue to watch and wait for higher RR set ups

$UKX Hourly - Bull flag broken, no position Upside break following more vaccine news - I don't like chasing breaks on headline news. RSI divergence shows price also not convinced.
$UKX Hourly - Bias for move lower BUT watching poss. bull flagWould still like to see move lower, but buyers are still emerging around the 6300 level. Possible bull flag on the cards, but daily is still very extended.
$UKX Hourly - Promising start, need 6300 and 20SMA to breakGood first step for a move lower highlighted by the RSI divergence published yesterday. Need to see 6300 lateral support and 20SMA decisively break before we can expect to see a meaningful change in trend and momentum lower.

FTSE 100 Buy set up We are seeing strong gains in the FTSE 100 as positive headlines on a potential vaccine, alongside expectations of a Brexit deal is causing investors to buy undervalued UK assets before the pound strengthens against the U.S Dollar.

FTSE100 - Time to Sell againOur chart is giving us indications for a possible drop (almost at major resistance now).

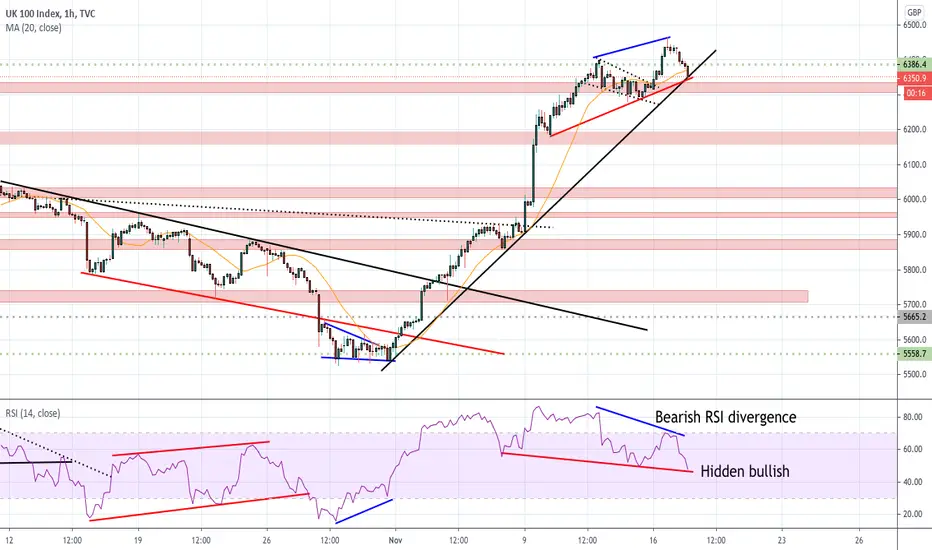
$UKX Hourly - Been a monster move, how long can momentum lastWould like to see a pullback around these levels. Fundamentally I feel move has been overdone and technicals are starting to show signs of agreement - lateral resistance and RSI divergence. ISAs in cash waiting for better levels to buy back in.

FTSE 100 FLYING!! **3 X TP'S HIT / OPEN +10.8% GAIN!**OPEN TRADE IF FOLLOWING TREND BASED ON 1% RISK IS RUNNING + 10.8%
OUR STRATEGY EXPLAINED:
The entry price, SL and multiple TPs are shown on the chart.
Our back testing and money management strategy itself is holding until a reverse signal to ride a big trend, but as you will not see the next signal - manage the trade as you wish should you decide to enter.
What is our strategy?
Our strategy is a trend following strategy, can be used on any instrument and time frame. However, we have hard coded specific parameters for when trading the H1 time frame, so we can back up over 4200 previous trades to confirm our edge from previous data. This gives us confidence in execution and belief in our trading strategy for the long term.
The strategy simply sits in your trading view, so you will see exactly what we see - the trade, entry price, SL and multiple TPs (although we hold until opposite trade as this is the most profitable longer term plan), lot size, etc.
This could be on your phone trading view app, or laptop of course.
The hard work is done, so we have zero chart work time, no analysis, no time front of the chart doing technical analysis - technical analysis is very subjective - you may see different things at different times - how do you have a rigid trading plan on a H&S shoulder pattern? Your daily routine, diet, sleep, exercise can affect what you 'see' and your decision making, this doesn't happen when a strategy is coded like this; what we do have is a mechanical trading strategy...
What does this mean?
It means, we are very clear on our entry and our exit and use strict risk management (this is built in - put in your account size, set your risk in % or fixed amount and it will tell you what lot size to trade!) so we have no ego with our position and we are comfortable with all outcomes - its simply just another trade. This free's our mindset from worry and anxiety as we take confidence from knowing our edge is there and also that we have used sensible risk management.
The strategy itself can be used as a live trading journal too - how cool is that? The strategy will confirm and support every open and closed position - so its quite easy to follow.
We just have to do what Percy does.
Please see our related ideas below for more information to explain what we do and how it can help you.

FTSE100 continuing down? The FTSE100 has been trading in a downward channel since June, the daily timeframe shows price is weakening approaching the top of this channel and has given us an indecision candle. We can see on lower timeframes, 1h + 4h there is RSI divergence signalling potential for a bearish move. Will look for entry on 1h

NIKKEI: WAVE-5 of 5TH WAVE ... INDICES ALIGNING, FTSE & SPX500FTSE: REACHES FINAL WAVE-C of DOUBLE CORRECTION
( As oF MARCH FTSE has been in CORRECTION ):
THEREFORE EVERY MAJOR INDICES is ALIGNING toward the Downside

FTSE Intraday setup.UK100 - Intraday - We sold at 5594 (stop at 5662)
Prices have reacted from 5597.
Intraday rallies continue to attract sellers and there is no clear indication that this sequence for trading is coming to an end.
Further downside is expected although we prefer to sell into rallies close to the 5594 level.
Our profit targets will be 5400 and 5155
Resistance: 5650 / 5854 / 6106
Support: 5445 / 5155 / 4785

$UKX Hourly - Decent RR opportunity for a small short Double resistance - lateral and downward sloping. RSI heading into overbought territory v quickly. Extended from 20 SMA
