Ftse100short

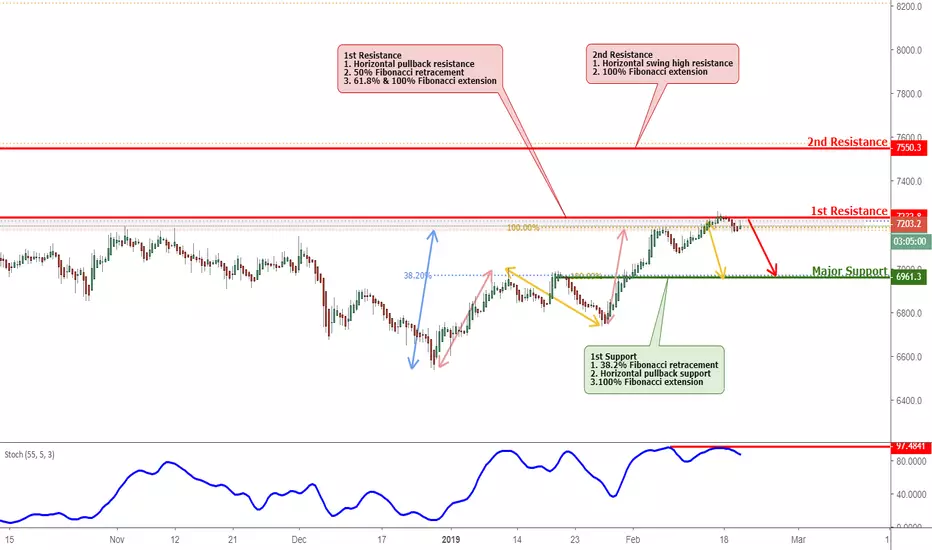
UKX Reversed Off Resistance, Prepare For Further DropFTSE 100 approached our first resistance at 7233 (horizontal pullback resistance, 50% Fibonacci retracement , 61.8% & 100% Fibonacci extension ) where a strong drop might occur below this level pushing price down to our major support at 6961(38.2% Fibonacci retracement , Horizontal pullback support, 100% Fibonacci extension )
Stochastic (55,5,3) is also approaching resistance where we might see a corresponding drop in price.
Trading CFDs on margin carries high risk. Losses can exceed the initial investment so please ensure you fully understand the risks.
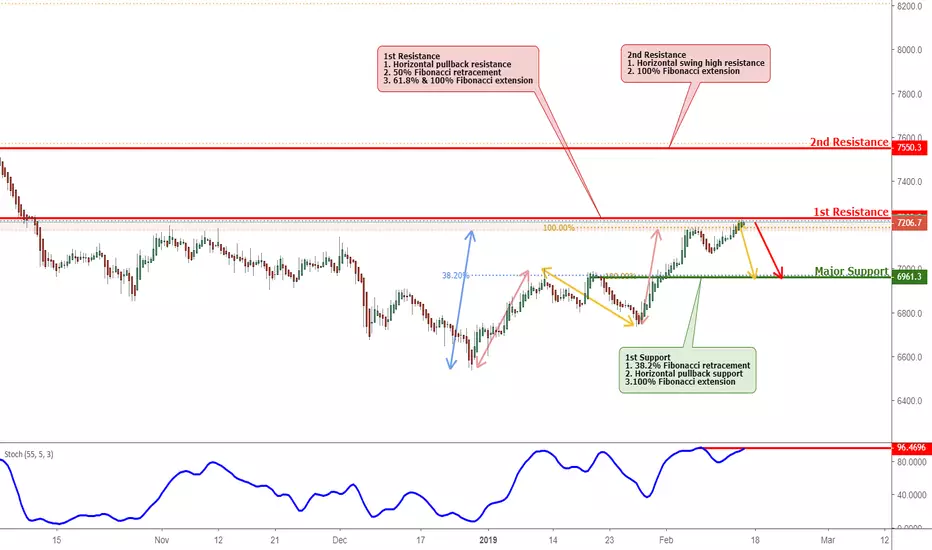
SHORT UKX approaching resistance, potential drop!just now
FTSE 100 is approaching our first resistance at 7233 (horizontal pullback resistance, 50% Fibonacci retracement , 61.8% & 100% Fibonacci extension ) where a strong drop might occur below this level pushing price down to our major support at 6961(38.2% Fibonacci retracement , Horizontal pullback support, 100% Fibonacci extension )
Stochastic (55,5,3) is also approaching resistance where we might see a corresponding drop in price.
Trading CFDs on margin carries high risk. Losses can exceed the initial investment so please ensure you fully understand the risks.
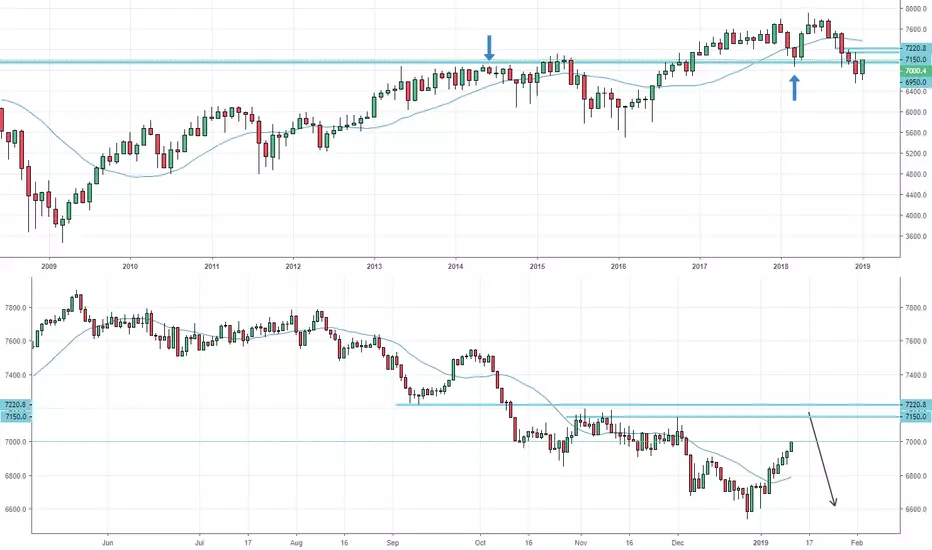
FTSE 100: Waiting for another drop starting at 7150The overall trend is still lower - with a break above 7000 - 7150-200 could be the next zone of resistance to see selling back towards the lows
FTSE Elliott Wave Analysis: Started Another Extension LowerHello Traders,
FTSE short-term Elliott Wave view suggests that the rally to 7790.17 high ended blue wave (X) bounce. Down from there, blue wave (Y) remains in progress with instrument showing a lower low sequence. The internals of that leg lower is taking place as double correction lower due to overlapping price action happening from 7790.17 high thus suggesting that the decline is unfolding in 3 waves corrective sequence.
Down from 7790.17 high, the initial move to 7477.05 low ended red wave W of (Y). The internals of that lesser degree decline unfolded as a Zigzag structure where black wave ((a)) ended in 5 waves at 7614.48 low. Then the bounce to 7665.24 high ended black wave ((b)) bounce. And decline to 7477.05 low ended black wave ((c)) of W in another 5 waves structure.
Up from there, the bounce higher to 7639.13 high ended red wave X of (Y). The internals of that bounce unfolded as double three structure where black wave ((w)) ended at 7616.15 high. Black wave ((x)) ended at 7531.24 low and black wave ((y)) of red X ended at 7639.13 high.
Down from there, the index has made a new low confirming that red wave Y of (Y) has started and looking for extension lower towards 7323.99-7250.04, which is 100%-123.6% Fibonacci extension area of red W-X. Near-term, while bounces stay below 7639.13 high expect index to extend lower. We don’t like selling it.

Easy Money "FTSE100"If you wan't to make easy money in the financial markets, trade the FTSE100. Repeatable pattern over and over and over again. Tech stocks and FTSE100 are my top picks.
Cheers :)

Double Trouble FTSE?Some very quick analysis of the FTSE100 - Could we see a double top form at this level? If it does remain bullish we would need to see a retracement soon so this may be a great opportunity for a short term sell on this asset!

SUCCESSFUL FTSE SHORTAlright, so the FTSE 100 shot down to significant lows.
Brief Update on this, I really did think that the FTSE 100 would of gone to significant lows, the timing of this really done my head in. However all targets were met successfully so I guess you can't really rush a good trade!

FTSE 100 shortMy short-term bias is still bearish. I feel price will fall to at the least close the gap. I'm not confident this is a solid break of this short-term resistance as price has failed to take this level with any real conviction. Price is currently stalling at the 61.8 fib which I mapped out on the 1hr chart for this current retracement.
self explanatory

WILL THE FTSE 100 COLLAPSE?Will the FTSE 100 collapse?
No idea, the only thing we can do now is sit back and let the markets do the work.
To be fair, GBP has been appreciating rapidly, are we currently in the exhaustive period? Are prices now start to decline?
This obviously has to be taken into consideration when dealing with INDICES.
I've got a few orders filled in.
I'll update you guys!


Looking like 7565 is the short term high. Drop down to 7450FTSE 100 might well have topped out at 7565 recently and is about to start a leg down to the 7450 support area. Dow is about to hit 23k, while the S&P is struggling to break 2560.

UK 100 *SELL*Let me know what you think of this one. lower highs with the trend broken and bearish price action..
Lets go!

FTSE 100 STILL BEARISH?Prices may be moving higher but for as long as my pattern stays intact, i remain a bear

Could the FTSE 100 be on it's way down?Currently a small flag is developing on the FTSE and I do believe there is more room for a correction however remains bearish in the larger picture.

Ftse 100 amist the volatilityThe Ftse 100 has been reacting to recent events like article 50 activation and is highly volatile.
But the price is a new fan area so could represent a trend change, furthermore the price broke out of the ascending triangle, and now if the price closes below the 200 MA and the trendline - short.

UKX ShortShort to 7260 area. Price has violated 200sma, might retest but I'm not expecting it to break back above.


