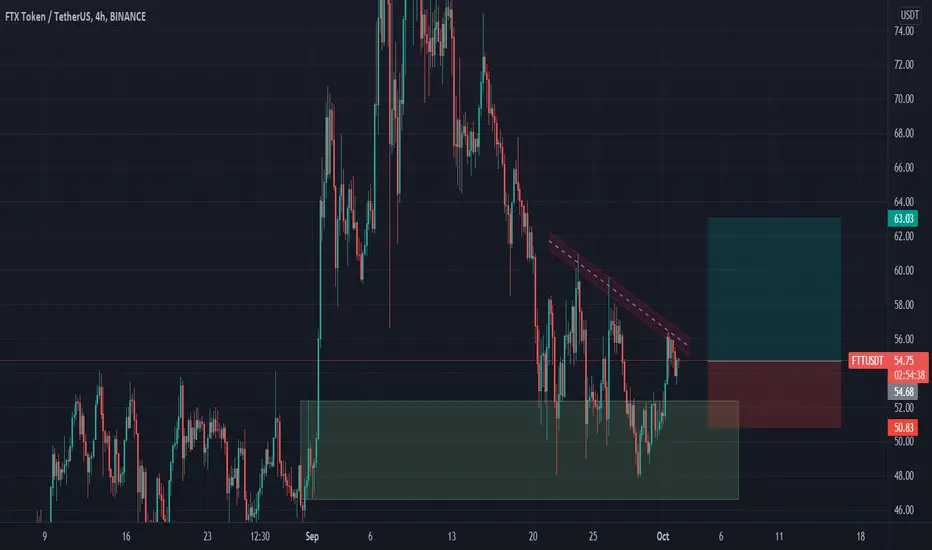
FTT the SOL adopted son.Looking to collect a decent amount of FTT on the box for a long term, also Im looking to speculate every white line, also every intersection of white lines and trend lines (black lines) will really indicate where the market is gonna move.
a great chance to be hopefully?
also when it drops, forget the bears talking about bear market, there is always a bounce and there is always profit taking, meanwhile if the bleeding was slow below the rectangle i would decrease my position and layer some bids from lower white lines
salute mon amies.
BTCUSD SOLUSD SOLANA FTT
FTT

FTT is a good one !struggling to keep the middle line of long timeframe channel. it will give a good gain i think...

SOL short to $126- bearish divergence FSVZOI usually don't short Sam's coins but SOL short opportunity is too good to miss. Huge bearish divergence on FSVZO and failure to break strong resistance at $180 makes this a low risk short. I'm in a moderate leverage short position. Expecting this to go down to $126.

FTT to 100 USD [Target 161.8% Elliott Wave ] 100 USDT is too easy for FTT
headed to wave 3 ( atleast 161.8% )

FTT is going to break!Hi everyone,
If ftt break the line you can buy with the target and stoploss which is shown.
Ftt is growing up, don't miss this.

$FTT will melt faces in fourth quarter of 2021Triple digits soon. Look at the dynamics acting totally similar to the run in early 2021.

FTT bullish scenariobuying the smol trendline + Support retest.
Bullish sign. DCAing all the way to the stop loss.
Taking profits on the way up

LONG FTTPERP FROM 47 TO 50 TARGET 110FTTUSD has both fundemantals and technicals on his side.
Technically 47 when it will hit and bounce at 47 usd ftt will be having it's double bottom on the the overall pullback from 83.
technically a bounce from 47 usd area can lead us to the target area 120 to 130 USD.
but hey it's crypto, then fundamentals say this:
sam bankman is now free to pump ftx coin. Why? because he bought back binance dominance in ftx; if binance went from 9 usd to 500 usd with all the fuds against CZ I only wonder where Sam bankman will take his coin. In my opinion it can go far way beyond 1k by next year. Noticed how FTT pumped since they bought back binance shares in FTX?
So what's the plan?
I personnaly bought a lot of ftt on and i'm also trading a small part on margin. My Margin long will be 5X around 47 only if price bounces when it hits that area. If price goes UP from here ? no worry i'll buy at market at 52 and wait. the only problem will be fees.
Bearish scenario? Only if price BREAKS below 47 and goes to 1.618 area which is 41, and from 41 if we don't get the strongest rally in crypto's history then ftt is worthless.
what's the strategy from now? Wait today and tomorrow either 3 scenario happen
1. Hit 47 and bounce we buy after bounce around 48. don't buy before you see any reaction it would be gambling.
2. Price rallies from here this area at the moment of publishing is the 78% fibs from 47 usd to 60, then same strategy just fomo in or wait for a small pullback at 5min if you're too cautious
3. it breaks 47 USD and no reaction please wait 41USD and watch the reaction, something surprising might happen.
When take profit in case of pump? December baby, let it roll up down until december and just take profit at the end of the first week of december , we might miss out but better miss a few than see your profits melt.
Good luck to everyone


FTTUSDT Next target $100?FTTUSDT (Day Chart) Technical analysis
FTT/USDT Currently trading at $60.00
Long Entry: above $50.00 -$60.00
Target 1 : $70.00
Target 2 : $85.00
Target 3 : $100.00
Taeget 4: $125.00
Max leverage: 2x or buy it on the spot market
Always keep stop loss

The opportunity in FTT The opportunity in FTT
The entry point is 0.58-0.589$
First target 62.7$
second target 67$
third target 71$
Forth target ----$
Fifth target ----
Sixth target ----
stop-loss 48$

#FTT overview 1DAfter hitting exactly 1.272 extension on the first bullish move, currently bouncing from the 0.382 fib retracement level and heading towards the critical level of 62$.
In the worst scenario we an continue correcting towards 0.5 or 0.618 fib levels ,respectively 43-36$ levels, which would give chances to load our bags for the next big swing long waiting us. I believe 1.618 levels or 120$ will be reached soon.

FTTUSDTHello Crypto Lovers,
Mars Signals team wishes you high profits.
We are in a daily time frame.
As you see, the price is moving upwards, after the fall, by hitting the support line, and if it breaks the resistance line and stabilizes above that, it can reach our target.
But in case of dropping below the support line, we consider a fall.
Warning: This is just a suggestion and we do not guarantee profits. We advise you analyze the chart before opening any position.
Wish you luck

FTTUSD going down to next supportFTT token is my fav of the utility tokens. Over the past few days, it held support levels around $60.
With that broken, I see the next support level to $52 almost matches the fib level here.
The market is very choppy and indecisive for me, so I am just placing my limit orders at $52 and patiently waiting.
(Disclaimer - not financial advice)

FTT potential bull flagJust classic TA. Bull flag is a falling wedge which should breakout with a minimum of $72 then $84 . I am expecting one more dip to for a bullish divergence.

FTT LONG BREAKOUT COMING SOONREASONS TO ENTER :-
1. Support Zone
2. 0.6 Fib Level
3. Double Bottom Pattern
Wait for Break Out of trendline before entering long
Target are previous resistance levels
Note:- Bitcoin should remain stable for the setup to playout successfully
PRICE ACTION TRADING

FTX Token (FTTUSDT)Disclaimer: All Videos/Information on this channel are for Education purpose only .They are not buy/Sell Recommendations . Please consult your financial Advisor before taking any trade or investment decisions.

New high in FTT coming?Timeframe 4 hours. Of all alt-coins, FTT looks clear and predictable for us. After exiting the current range, it is possible to update the global highs since the current range has been traded for quite a long time. Take 1 - 52 $ / take 2 - 54 $ / - take 3 - 56 $.
It is also wise to leave some of the position in case of tothemoon and a new high.

FTT at a critical level! Watch for a breakout!Here's a quick look at FTT 2 hr chart. As we can see, the price has been going sideways and has printed a symmetrical triangle. There's also a possible head & shoulder pattern which is bearish. Definitely one to keep an eye on.
The best entry would be, when the price breaks above the symmetrical triangle with good amount of volume.
If we break below the symmetrical triangle, then im looking for 60$ FTT.
-------------------------------------------
The idea is: Buy the breakout from the symmetrical triangle and take profits at the levels shown in the chart.
Targets:
- Profits can be taken in the resistance zone .
1. 74$
2. 84$
3. 99$
-------------------------------------------
If you like the content, then make sure to comment and like the post :D
Follow me for daily profitable trading setups
BTC dictates the market. If BTC falls, then Alts will fall as well. Trade safe!

FTT, NICE FOR HOLDERS...!FTT is a good project and has exclusive growth potential. The best entry point is in the chart below:
Thank you so much for supporting me and your kindness >_-
