#FTT/USDT : Go to work, it's good#FTT
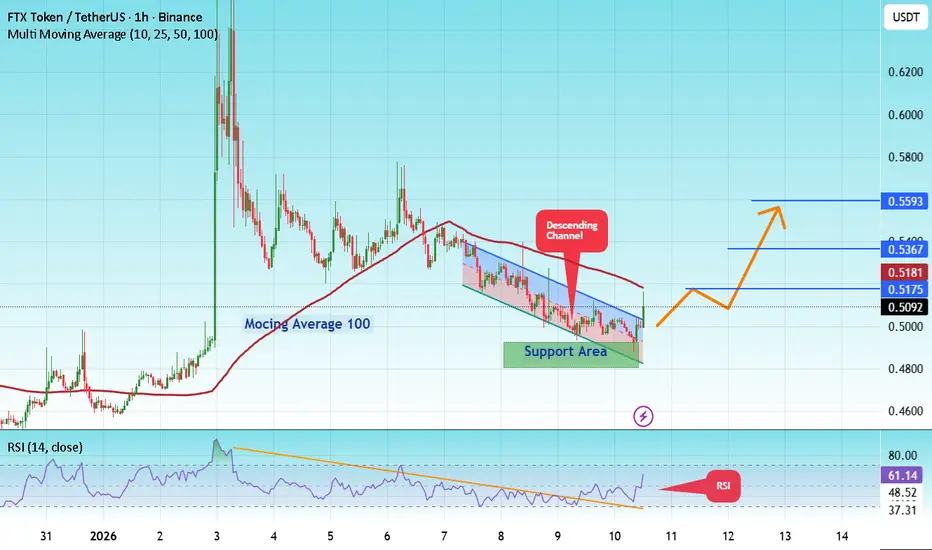
The price is moving within a descending channel on the hourly timeframe. It has reached the upper boundary and is heading towards breaking it. A retest of this boundary is expected.
The Relative Strength Index (RSI) is showing an upward trend, as it has approached the upper boundary. A bearish reversal is expected.
There is a key support zone in green at 0.4850. The price has bounced from this zone several times and is expected to bounce again.
A consolidation trend is observed above the 100-period moving average, which we are approaching. This trend supports a decline towards this level.
Entry Price: 0.5055
Target 1: 0.5175
Target 2: 0.5367
Target 3: 0.5593
Stop Loss: Above the green support zone.
Remember this simple thing: Money management.
For any questions, please leave a comment.
Thank you.
Fttbtclong
FTTBTCIt was long wave for correction wave and there is triangle back trend with divergence, i think its last wave of triangle of wave A and after that the price can back to up.it can affect on FTTUSDT
FLong

FTT going to make New ATH soon! Things to Note:
1. Bullish Market Structure
2. Expansion in Volume
3. Pierced above ATH
4. Change of polarity of ATH level
P.S: This is NOT investment advice. This chart is meant for learning purposes only and is a part of my personal journal. Invest your capital at your own risk
FLong


FLong

FTT/BTC (Next Key Support @ 2588 Sat)FTT/BTC
-FTX Token broke the local support at around 3000 area
-The price has fallen and down by almost -5%
-There is no clear support at the current market price
-The only area we need to be watching is around 2588 range
-This is a confluence of the previous support zone
-If the price will reach this level, chances of recovery are high
-Enable your alerts and add this to your watchlist
F

