FTT retesting broken supportAs you can see in the chart, it is a very simple trade, the 24.9$ level was a strong support, now that is broken is a strong resistance. The price managed to climb back to that level(resistance) so i see that a reversal from here is quite likely. With the 22.5$ level acting as a magnet for the price.
I consider to enter a Short position now with stop at 25.35$ and targets 24.13$ 23.22$ and 22.53$.
Recommended to keep trailing the stop loss order and keep locking profits.
If you agree give a boost and i will be glad to see your opinion in the comments.
FTTUSD

FTT analysis FTT / USDT
FTT still hold above its massive support
Looks great in accumulation for the long term
Best of wishes

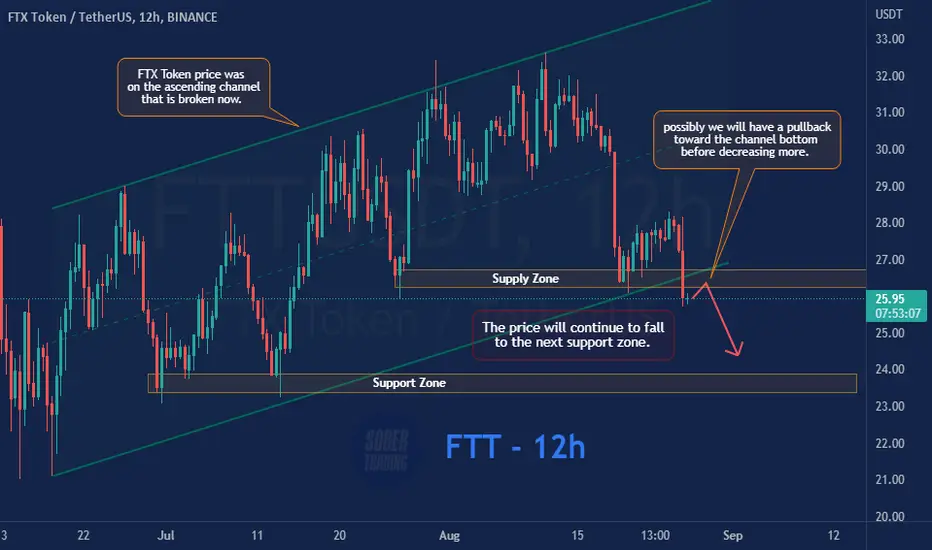
FTT - FTX Token 12h bearishFTX Token price was on the ascending channel that is broken now. So the price will continue to fall to the next support zone, and possibly we will have a pullback toward the channel bottom before decreasing more.
FTX FTT - Strong altcoin! Huge base + Elliott Wave
FTT is a very reliable and strong altcoin that you can find on the crypto market, together with BNB.
FTX exchange is growing really fast, and there is a lot of demand for the token. If you want reliable and stable gains, this is a great choice for the long term.
We have a clear and very bullish structure (rectangle consolidation) and the bulls successfully defended the previous swing low.
My Elliott wave analysis suggests that we have completed an ABC correction (ZigZag 5-3-5) and we are prepared for the next impulse wave from here!
If we take a look at the volume indicator, we can see very low bearish pressure, so it's really good to see.
Our profit target could be 0.618 FIB extension from Wave 1 -> Wave 2, but I think we can go higher. We need to wait for the price to develop.
I expect tremendous gains for selected altcoins. You can find them in the related section down below.
For more ideas, please hit "Like" and "Follow"!

FTT/USDT BUYING SETUPFTT Breakout Major falling wedge pattern wait for daily close for confirm valid breakout or false break. if we see in 4h timeframe now FTT on strong resistance potential rejected back to retest on 4h demand before back to trying breakout the resistance . in 4h demand at the time support the trendline
Entry : 31.4 - 29.2 - 27
Target : 37 - 42.31 - 47.98 - 53
Stop : 25.6

FTTUSD ❕ broke up the downtrend lineFTT is above liquidity.
Price has entered the bullish RSI zone (4H TF)
The stock has broken up the 200MA (30m TF)
I expect that after a local correction and consolidation above the support level, FTT will continue its upward movement.

FTTUSDT Swing Trade setup!FTTUSDT Technical analysis update.
FTTUSDT is currently trading at 29.40
FTT price braking resistance zone after 2 months of consolidation and price multiple times touched its resistance zone. we can expect an up move in FTT.
Thanks
Hexa.

FTTUSDT Breakout Confirmed! FTTUSDT technical analysis update
FTTUSDT currently trading at 29.40, the price moving above the resistance zone after 2 months of consolidation and 200EMA and 100 EMA crossed in 4h chart, I'm expecting a good up move in FTT.
Buy zone: $29.00 - $29.80
Stop loss : $27.00
Target 1 : $31.50
Target 2 : $33.80
Target 3 : $37.00
Swing trade setup
Always keep stop loss

FTX FTT - The most bullish altcoin! Huge base + Elliott Wave
FTT is one of the most bullish altcoins on the weekly timeframe, together with BNB!
We have a clear very bullish structure (rectangle) and bulls successfully defended previous swing low.
My Elliott wave analysis suggests that we have completed an ABC (ZigZag 5-3-5) correction and we can definitely go up from here!
If we take a look at the volume indicator, we can see a very low bearish pressure, so it's really good to see.
Out profit target can be 0.618 FIB extension from Wave 1 -> Wave 2, but this is just a projection for now.
FTX exchange is growing really fast and there is a lot of demand for the token.
Look at my ideas about interesting altcoins in the related section down below ↓
For more ideas please hit "Like" and "Follow"!

FTT/USDT - Potential Short ScenarioHello Traders!
FTT continues its downward movement.
Price is testing the support level of $24.50 and fixed below MA100 on a weekly timeframe.
Based on the current macroeconomic situation with inflation and the debt load in the crypto-industry, we can assume that the market will continue to plunge.
In that case, on the next wave of falling, there are prospects of medium-term purchases with a discount. It is possible to look for purchases near the support level of $10.75 in the price range of $10.75 - $14.45.
Targets of such purchases will be the levels of $24.50 and $36.00
Good luck and watch out for the market
P.S. This is an educational analysis that shall not be considered financial advice

FTTUSD : Bullish Crab DetectedHi, this is my first time where I am going to publish in public I hope you like it.
FTTUSD : 4H - 1H
I noticed a bullish Crab in 4H time frame so opened a long position with below mention SL, Entry and Take Profit(2)
I have marked Take profit levels based on Fib levels.
Trade Idea
-------------------
Entry : 23.64
-------------------
TP1: 25.149
TP2: 26:570
TP3: 27.602
TP2: 32.597
Stop Loss: 22.48 (If BTC does not go mad suddenly then take it as 4h close below 22.48 for confirmation)
Note: Once Take Profit 1 gets flip as support then I will move SL at entry

FTT - FTX Token LongFTT is at the important zone now in the daily timeframe. The price has been falling about 70% from ATH, while this drop is 90% or more for most altcoins.
Additionally, it has a double bottom and almost a higher low in the lower time frames, so it seems to be good to buy for the mid-term and long-term at these prices.

FTX/USDTesting/tracking elliot wave theory. Please do not trade off idea without S/L. Not financial advice.
On this chart I want you to look at a few things.
From the ATH we've dropped about 73% so far
A lot of the coins I've charted for you has gone to the 82% or more area. On the fib retracement, if you look at the white lines, below the 0.236 fib level
where the purple circle is; That is where majority of altcoins have retraced to so far. This coin has a high possibility of going below the 0.236 fib as well.
RR: 7.4
Possible Upside: 459%
Possible Downside: 65%

FTT FTX- Fundamental strong token that is backed by a working company.
-They don't compete for L1 place or usability, speed, etc. Just revenue.
=> On the chart you see the RSI Daily moving inside a channel, leading us we should buy when it hits the lower boundaries.
=> We can expect a bounce from 19.3$ till 21$+
=> If BTC bombs below 18k and goes to 16.5k or lower, ftx might drop on all the Red support levels I've drawn.
=> Last support is 11-10$.
=> That is the absolute accummulation zone but I doubt it goes there. Only btc, eth and ftt are down 70% from ath, the rest of the top 100 coins are -85 and more, make your choice.
Thanks, cheers )


FTTUSD Return to Strong Trend LineFTT can be seen to have a very strong uptrend (in green) that is yet to be tested at these high levels it has reached
A return to this level coincides well with the 0.618 fib level, as shown by the curvy arrow
Bearish action will be brief but strong towards the trend line

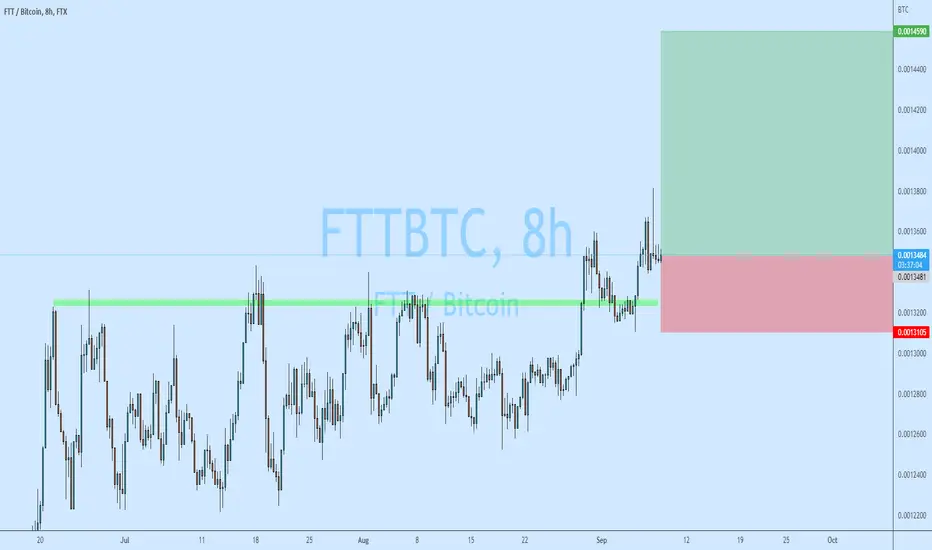
FTT 6H BUYFTT 6H support is at ~$25.9
Enter 50% at the current price
and try to set some buy orders near the support zone
If FTT holds above the trendline,
the Take-Profit target would be 5%, 10%, and 15% from your entry
Cheers

FTT Potential ReversalFTX could the the next Binance in my opinion.
They will integrate stock trading in their platform.
First price target was reached:
I see a potential reversal to the $37 resistance before heading lower later this year.
Looking forward to read your opinion about it.

FTT Price PredictionDue to the markets condition i expect FTX Token FTT to touch the $22.24 support.
Looking forward to read your opinion about it.

FTTUSD ❕ boundariesFTT is moving in the downward channel near its upper boundary.
The price is near the upper boundary of the trading range.
There are two versions of the downward channel, but in both cases there is a margin for a downward move.
The volatility of the price movement has decreased in recent days.
The price movement is lagging behind and showing better than the market.
Trading volumes have increased during the price decline.
The main MAs on the 30m Timeframe are bearish.
I expect that the price may test the upper boundary of the channel, but after fixing under it will continue to fall.

Where to buy FTTUSD A very strong Trend line has developed along the White line at the bottom of the Fib channel
This Trend line will extend to where price is developing now, and once it is retested will act as a point of support
This is the best entry point, it will be around ~$22 per coin once the Trend line is hit

FTT/USDT BUYING SETUP (SWING)Buying #FTT/USDT (SWING)
$FTT breakout falling wedge pattern with big buy volume , RSI bullish divergence Valid and then MACD showing have golden cross, Price action and indicator support for bullish movement
we can entry now or wait for retest first
Buy zone : 27.50 - 26.5 - 25.3
Target : 30 - 32.35 - 35.27 - 39.27
Stop : 24
