FUN/USDT — Last Defense Zone: Reversal or Breakdown Warning?FUN/USDT has dropped back into its Last Defense Zone at 0.0023–0.0019, a major historical support block that previously triggered strong bullish impulses. Price returning to this area highlights two key dynamics:
1. Demand is still active, shown by repeated long rejection wicks whenever price tags the zone.
2. Market psychology is at an extreme, where only patient and disciplined traders can capitalize on the opportunity.
The broader structure remains in a corrective downtrend, but the formation of a multi-touch support base signals the early stages of potential accumulation — a foundation that often precedes larger macro reversals.
---
Bullish Scenario — Reversal From the Accumulation Block
A bullish shift becomes more probable once price closes above 0.0027–0.0028 on the 4D timeframe. This breakout would signal buyers reclaiming structure and initiating a possible trend reversal.
Upside Targets:
Target 1: 0.00335 — minor supply / historical reaction zone
Target 2: 0.00950 — major inefficiency fill
Extended Target: 0.02480 — macro liquidity cluster
If the reversal forms within the support block, the upside potential far outweighs the downside risk — making this one of the best asymmetric setups on the chart.
---
Bearish Scenario — Breakdown From Support
The bearish scenario activates if the market closes below 0.0019.
Such a breakdown would confirm a structural failure and typically invites stronger selling pressure.
A close below 0.0019 likely leads to:
loss of key historical support
entry into downside price discovery
continuation toward 0.0012 or lower
This zone is the hard invalidation level for any medium-term bullish bias.
---
Pattern & Structure Details
The chart highlights several notable technical elements:
Accumulation Range forming inside 0.0023–0.0019
Repeated bullish rejection wicks — early signs of underlying demand
Descending structure losing momentum (trend exhaustion)
Early double-bottom behavior on support
Liquidity clusters above at 0.00335 and 0.00950
Overall, the support block is the most critical zone for FUN/USDT heading into late 2025 and early 2026.
#FUNUSDT #FUN #CryptoAnalysis #TechnicalAnalysis #SupportZone #ReversalPattern #BreakdownAlert #Altcoins
FUNUSDT

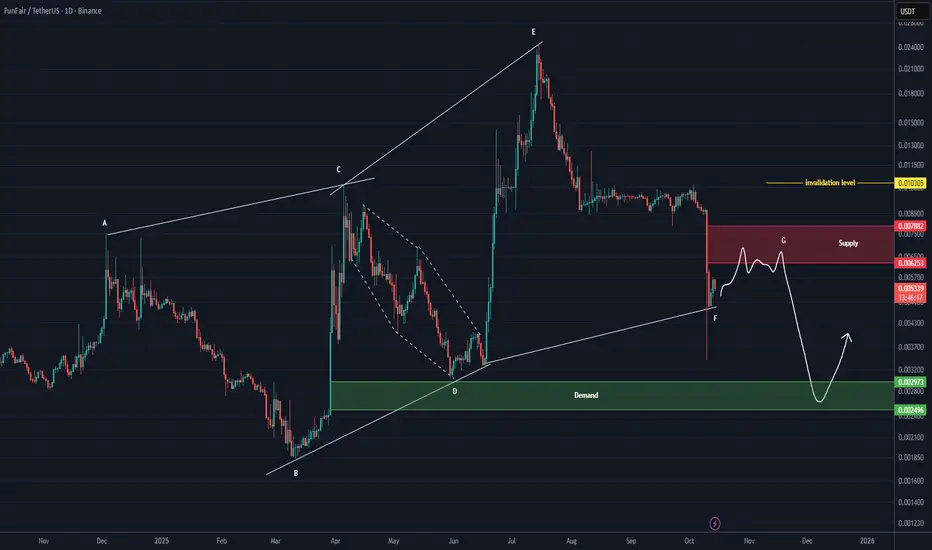
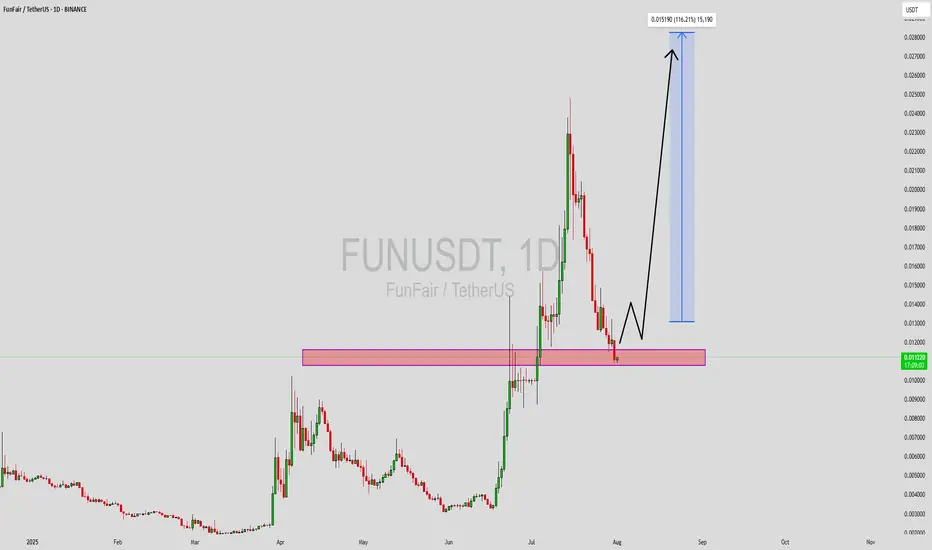
FUN Analysis (1D)It seems that the bullish diametric pattern on FUN is coming to an end. It appears that only a truncated and shortened wave G remains, which could complete after reaching the red-marked area.
A reaction is expected within the green-marked zone.
Keep in mind that the daily timeframe takes time to play out.
A daily candle closing above the invalidation level will invalidate this analysis.
For risk management, please don't forget stop loss and capital management
When we reach the first target, save some profit and then change the stop to entry
Comment if you have any questions
Thank You
FUN/USDT — Reversal Incoming or New Lows Ahead?
FUN has dropped back into its major historical accumulation zone between 0.00350–0.00297, a price range that previously triggered one of the strongest rallies in 2024. After a prolonged downtrend, this zone now acts as the final line of defense for bulls — a true make-or-break area that will define the mid-term market structure.
Since peaking near 0.02480, the price has been under heavy selling pressure, forming a clear series of lower highs and lower lows. However, as the market approaches this key demand zone, bearish momentum appears to be slowing, hinting at potential exhaustion — a typical setup before a macro reversal.
---
Pattern & Structure
Primary trend: still bearish, but momentum is fading near the demand zone.
Yellow zone (0.00350–0.00297): acts as long-term support / accumulation base from the last macro rally.
A sideways accumulation or strong bullish candle here could signal buyer re-entry.
A clean breakdown below 0.00297 would invalidate this base and confirm further downside continuation.
---
Bullish Scenario
If buyers defend the 0.00350–0.00297 area and a 3D candle closes above 0.0038–0.0040, a mid-term reversal could begin.
Targets:
Target 1: 0.00400 (short-term validation level)
Target 2: 0.00575 (minor resistance)
Target 3: 0.00720–0.00890 (major supply zone)
Extended target: 0.02300 if momentum sustains
Confirmation: Look for bullish engulfing / hammer patterns on higher timeframes with a noticeable rise in volume — these are key reversal triggers.
---
Bearish Scenario
If the price closes below 0.00297, the structure confirms a breakdown of the macro support.
Targets:
Target 1: 0.00200
Target 2: 0.00184 (multi-year low zone)
Such a move would mark a capitulation phase, potentially setting the stage for a longer-term base formation at lower levels.
---
Technical Insights
Momentum indicators may soon show bullish divergence, supporting a potential reversal setup.
0.00400 remains a crucial resistance-to-support (RS flip) level to watch.
Patience is key — early entries without confirmation can be risky in this type of setup.
---
Conclusion
FUN is now testing one of the most critical support zones of the year. The range between 0.00350–0.00297 represents a battlefield between accumulation and capitulation.
If buyers manage to hold and reclaim 0.0040, the price could ignite a multi-week recovery phase. But if this level breaks, a slide toward 0.0020–0.00184 becomes highly probable.
This is a zone where precision and confirmation matter more than emotion — wait for the chart to tell the story.
---
#FUNUSDT #FunFair #CryptoAnalysis #SupportAndResistance #SupplyDemand #BreakOrBounce #CryptoMarket #TechnicalAnalysis #MarketStructure #RiskManagement

FUN/USDT — Accumulation at Demand Zone: Rebound or Breakdown?📖 Narrative & Full Analysis
FUN/USDT is currently standing at a critical crossroads. After a strong rally that pushed the price to the recent peak at 0.0248 USDT, the market faced a sharp correction and is now testing the demand zone (0.0075 – 0.0090) — an area that previously acted as major resistance and has now flipped into support.
This is the level that will define the next big move:
Will buyers defend this zone and fuel a new rally?
Or will sellers break through and trigger another deep leg down?
The structure shows accumulation in progress. The sideways consolidation above demand indicates that the market is building momentum, awaiting confirmation for the next direction.
---
📊 Key Technical Levels
📍 Current Price: 0.009467
🟨 Demand Zone (Key Support): 0.0075 – 0.0090
🔑 Upside Resistance / Targets:
0.013887 → first breakout confirmation
0.019766 → mid-term supply zone
0.022897 – 0.024800 → retest of previous highs
⚠️ Downside Risk if Breakdown:
0.0032 → mid-term support
0.001839 → historical low
---
📈 Bullish Scenario
Buyers successfully hold above the demand zone.
A daily close above 0.0139 would confirm bullish momentum.
If momentum builds, FUN could rally in stages: 0.0139 → 0.0197 → 0.022–0.0248.
Bullish strategy:
Accumulate within 0.0075 – 0.0090
Set a stop-loss below 0.0070
Scale out at resistance targets
Potential Reward: From current levels, upside could reach +150% or more if the demand zone holds.
---
📉 Bearish Scenario
If FUN loses the demand zone (daily close < 0.0070), support is broken.
This would open a path for a deeper decline towards 0.0032 and possibly 0.0018.
Bearish strategy:
Aggressive traders could short a confirmed breakdown.
Long-term holders should consider reducing risk or hedging if support fails.
---
🔍 Pattern & Sentiment
Pattern: Base-building / accumulation at demand zone.
Market Sentiment: Neutral-to-bearish in the mid-term, but with reversal potential if demand is respected.
Candlestick signals to watch: Long lower wicks and strong bullish closes from demand → early signs of reversal.
---
🧭 Conclusion & Outlook
FUN/USDT is at a make-or-break zone.
As long as the price holds 0.0075 – 0.0090, the setup favors a rebound with upside potential of +50% to +150%.
A confirmed breakdown below this zone, however, could trigger a 70–80% drop.
🚦This is a golden accumulation area for disciplined traders with tight stops. High risk, but potentially much higher reward.
#FUNUSDT #FUN #Altcoins #Crypto #TechnicalAnalysis #SupportResistance #Breakout #Bullish #Bearish

FUNUSDT Forming Bullish MomentumFUNUSDT (FunFair Token) is really heating up as a breakout play, with strong bullish momentum now visible on the daily charts—making it a compelling setup for continuation traders.
The pair has executed a clean breakout from both a descending channel and trendline resistance, signaling a powerful shift in trend direction. This breakout is backed by significant volume, which adds conviction to its bullish thesis—setting the stage for continued upside potential.
Further emphasizing this momentum: FUN has surged above a key resistance level around 0.0173 USDT, flipping it into support. The breakout is confirmed by intense buying pressure and high-volume candles—clear signs of buyer dominance.
Momentum shows no sign of slowing down. On Binance Square, analysts are noting a major shift: breakout candles and rising volume indicate that this move is just getting started. Suggested entry levels and profit targets point to a potential rally of over 140%, aligning with your outlook.
To sum it up: FUNUSDT is offering a textbook momentum breakout setup—supported by strong volume, technical structure, and growing investor interest. If you’re tracking coins with explosive upside potential, this one deserves a spot at the top of your watchlist. Watch for retests of the breakout zone for possible entries, and it could be on its way to a 140%+ move.
✅ Show your support by hitting the like button and
✅ Leaving a comment below! (What is your opinion about this Coin)
Your feedback and engagement keep me inspired to share more insightful market analysis with you!
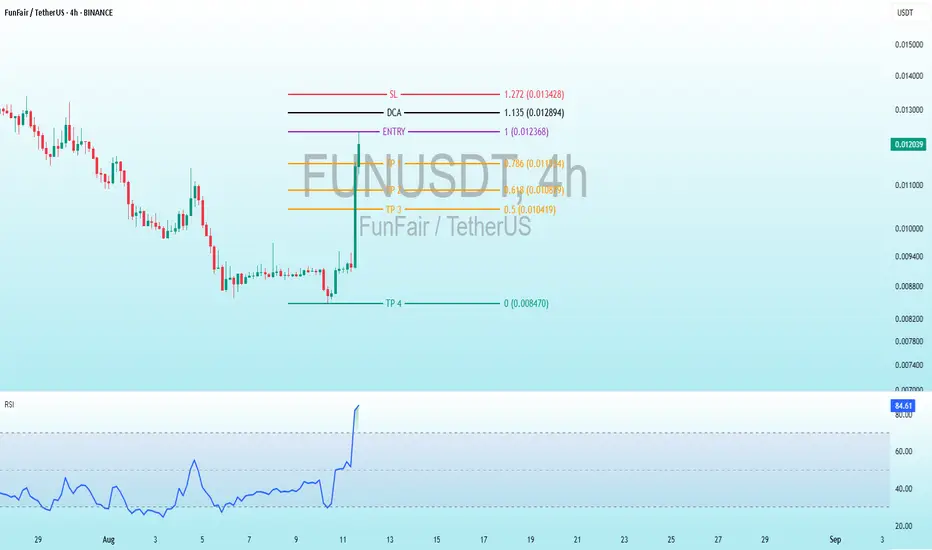
"FunFair/USDT 4H: Potential Breakout with TP Targets"BINANCE:FUNUSDT
Take Profit (TP) Levels:
TP1: 0.011534 USDT
TP2: 0.010879 USDT
TP3: 0.010419 USDT
TP4: 0.008420 USDT
Stop Loss (SL): Set at 1.272 Fibonacci (likely a typo or misplacement, as it seems unusually high compared to the price range; it might be intended as 0.013428 USDT or another value relative to the entry).
DCA (Dollar Cost Averaging): Marked at 1.135 Fibonacci (again, possibly a typo; likely meant to be 0.012894 USDT or similar).
Price Trend: The price has been in a downtrend until recently, with a noticeable upward movement around the entry point, suggesting a potential reversal or breakout.
Support and Resistance: The entry zone appears near a support level, with resistance levels aligning with the TP targets.
RSI AnalysisThe RSI is currently at 85.11, indicating that the asset is in the overbought territory (above 70). This suggests a strong upward momentum but also a potential for a reversal or pullback soon.
Historically, the RSI has fluctuated between oversold (below 30) and overbought levels, with a recent sharp increase, supporting the price breakout.
InterpretationThe trading strategy seems to be a long position with multiple take-profit levels, aiming to capitalize on a potential upward trend.
The high RSI value suggests caution, as overbought conditions might lead to a correction. Monitoring for bearish reversal signals (e.g., divergence or candlestick patterns) would be prudent.
The SL and DCA levels need clarification, as their current values appear inconsistent with the price scale.
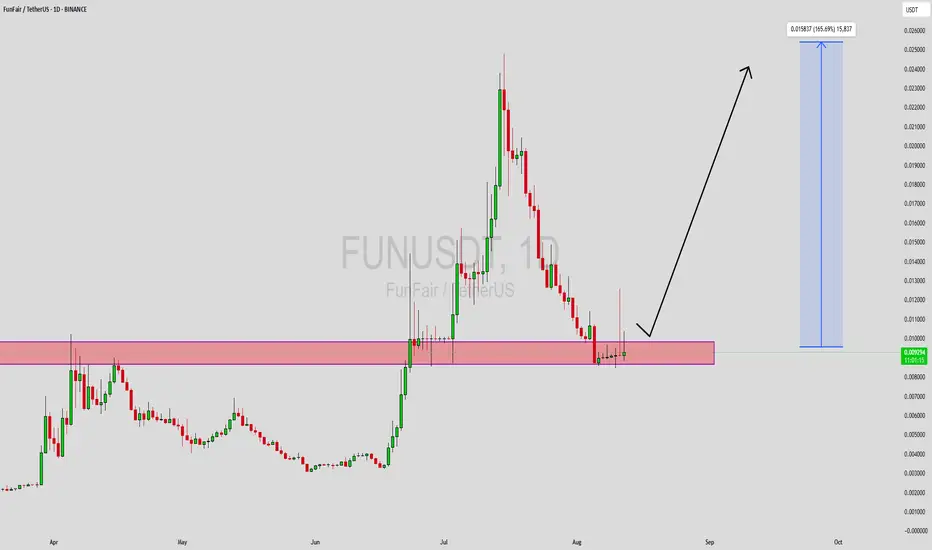
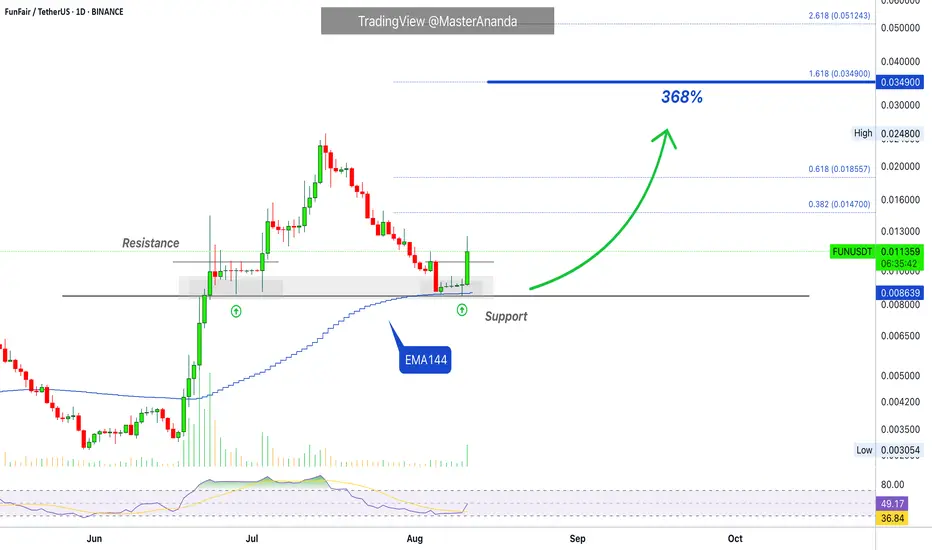
Fun Token Will Continue Growing (Easy 333%+ Potential)Fun Token produced a very strong retrace between 15-July and 5-August. Support is found at the exact same range where FUNUSDT consolidated in late June before its final advance. The last rise has been corrected by more than 100%.
When 100% of an up-move is deleted, no more correction is needed. Going lower below 100% would signal the start of a bearish phase and FUNUSDT is clearly in a strong rising trend, a bull market.
After 100% of a rise is removed the market is back to baseline, and this opens the doors for a new wave of growth. Can be stronger than the first one because all the weak hands were removed during the correction (retrace).
Support found also matches the EMA144 price line. As soon as this level was confirmed as long-term support, FUNUSDT moved up with high volume, this is the start of the next high. Prepare for a major jump.
Namaste.
FUNUSDT Forming Bullish ReversalFUNUSDT is showing strong signs of a potential bullish reversal after a healthy correction phase. The price has now landed back into a historically strong support zone that previously acted as resistance. This zone, clearly marked on the chart, is being respected again, which could mark the beginning of a powerful upward move. The technical setup aligns well with a classic demand zone bounce, a favorite among swing traders and breakout investors.
The current market conditions are ripe for a potential 100%+ move, with a projected upside target near \$0.025 as shown on the chart. This bullish thesis is backed by sustained trading volume, suggesting continued investor interest. FUN (FunFair) has a history of explosive price action after accumulation phases, and this setup mirrors past patterns that led to significant rallies.
Fundamentally, FunFair has long served as a blockchain-based gaming and entertainment platform, and its role in the evolving crypto ecosystem keeps it on the radar of both speculative and long-term investors. The sharp retracement to a key level, followed by potential upward momentum, makes FUNUSDT an attractive high-reward opportunity for aggressive buyers aiming to capitalize on early entries.
With a clean chart structure, attractive risk-reward ratio, and visible interest from traders, FUNUSDT is positioned for a potential breakout. This could be one of the more lucrative mid-cap plays on the altcoin radar right now.
✅ Show your support by hitting the like button and
✅ Leaving a comment below! (What is You opinion about this Coin)
Your feedback and engagement keep me inspired to share more insightful market analysis with you!

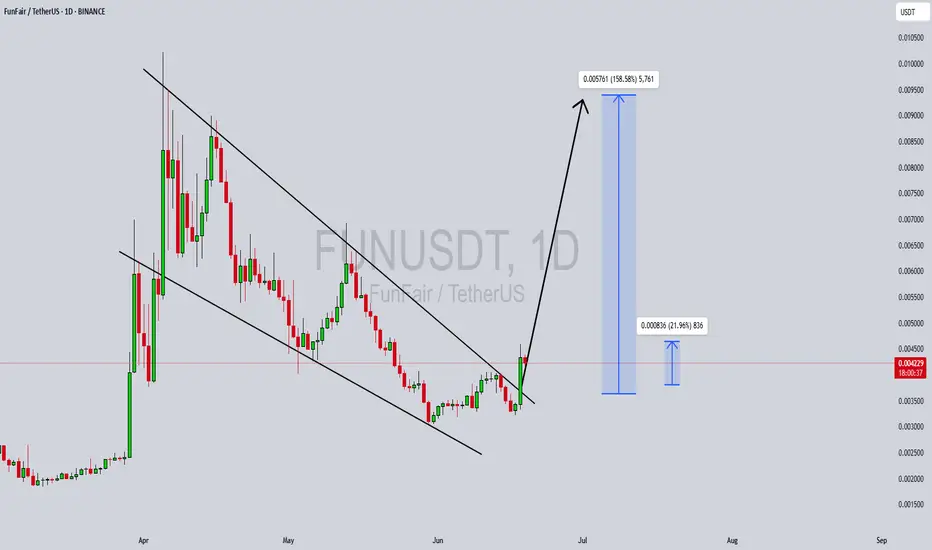
FUN / USDT : Breaking out from Trendline resistance FUN/USDT Breakout Setup
FUN/USDT is currently breaking out from its trendline resistance, signaling a potential bullish move with strong momentum. The chart shows significant upward potential, and we’re expecting a nice move towards $0.015 in the coming hours/days.
Key Point: Keep a close watch for confirmation of the breakout. If the trend holds, this could lead to a substantial rally.

FUNUSDT Forming Bullish ReversalFUNUSDT is currently forming a bullish reversal pattern, signaling a potential shift in market momentum after a prolonged consolidation. This pattern, combined with a steady increase in trading volume, suggests growing investor interest and the possibility of an upcoming trend reversal. The structure aligns well with historical price action, where FUN has previously bounced from similar technical setups, making this an attractive chart for swing traders and medium-term investors.
The volume profile shows accumulation behavior, typically seen before major breakouts. This reflects the confidence of larger market participants entering at lower levels. If FUNUSDT confirms the breakout above resistance zones, the next leg up could lead to a potential price surge of 140% to 150% from current levels. Given its relatively low market cap and recent technical developments, the upside potential remains significant if momentum sustains.
What adds to the bullish thesis is the overall pattern integrity supported by clear trendline reactions and support zone validation. FUN has also maintained a healthy base formation, which often precedes explosive upward moves. A close above key resistance with volume confirmation would likely attract more traders and potentially push FUN into price discovery territory.
Keep this altcoin on your watchlist as it presents a high-reward setup supported by solid technical foundations and increasing trader sentiment.
✅ Show your support by hitting the like button and
✅ Leaving a comment below! (What is You opinion about this Coin)
Your feedback and engagement keep me inspired to share more insightful market analysis with you!
FUNUSDT Forming Bullish WaveFUNUSDT is currently showcasing a bullish wave pattern, signaling the potential continuation of its upward momentum. This type of pattern often indicates growing market interest and renewed buyer activity. As seen in the recent chart movements, the price has begun forming higher lows and higher highs, a key structural sign of bullish strength. The presence of good volume further validates the ongoing buying pressure, making this setup appealing to short-term traders and swing investors.
FUNToken, designed for the online gaming and gambling ecosystem, is gaining traction due to the increasing adoption of decentralized applications in these sectors. As regulatory clarity improves and user interest rises, utility-based tokens like FUN often see renewed demand. The project’s low market cap and strong community engagement create a favorable environment for speculative rallies, particularly during altcoin market uptrends.
With expectations of a 20% to 30% gain, FUNUSDT offers a moderate yet promising short-term opportunity. The bullish wave pattern suggests room for continued price expansion, especially if key resistance levels are broken with momentum. Traders should keep an eye on breakout confirmations and ensure risk is managed effectively, as low-cap tokens often experience higher volatility.
✅ Show your support by hitting the like button and
✅ Leaving a comment below! (What is You opinion about this Coin)
Your feedback and engagement keep me inspired to share more insightful market analysis with you!

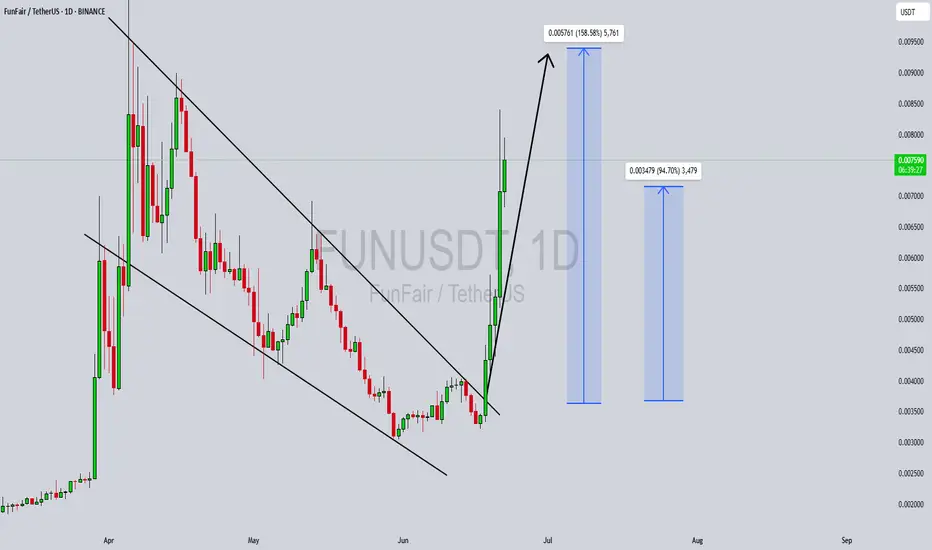
Altcoins Bull Market Confirmed —Fun TokenEvery time there is a strong rise immediately what follows is a correction, always, unless of course you are in a bull market. Here you have the most revealing signal of all: Price stability after a major rise, sideways rather than bearish.
Fun Token (FUNUSDT) produced a more than 340% bullish wave. What happens right after the peak? If you guessed a drop I don't blame you, that is what normally happens but here things are different. Since the market is growing and set to grow strong for long, after this major rise instead of a crash we have consolidation, sideways. This reveals that participants are not selling, they are not selling because they know the rise is not over, there will be additional growth.
Go back in time and look at 30-50 altcoins and see what happens after each strong bullish wave, a correction. Now, do the same but focus on a bull market; what happens after a strong bullish wave? Some consolidation followed by additional growth.
The altcoins bull market is already confirmed.
Thanks a lot for your continued support.
Namaste.

FUNUSDT Forming Descending TriangleFUNUSDT is gaining traction among crypto traders as fresh market sentiment shows renewed interest in micro-cap altcoins. FUN Token, the native utility token for the FunFair platform, remains one of the oldest blockchain projects focused on online gaming and decentralized casinos. Recent price action indicates healthy trading volume, which adds weight to the possibility of a significant upward move in the coming sessions. With an expected gain of 60% to 70%+, traders are closely watching for a breakout that could kickstart a strong bullish run.
The FUN Token ecosystem continues to attract investors who believe in the potential of decentralized gaming and transparent betting systems. As blockchain-based gaming platforms gain more adoption, FUN’s use case could gain relevance again, sparking fresh buying pressure. Technical analysts are keeping an eye on key support and resistance levels that could determine the start of a new trend reversal.
Current on-chain data shows a notable uptick in wallet activity and transactions involving FUNUSDT, hinting that accumulation might be underway. This aligns well with the project’s roadmap updates and any new partnerships that could serve as catalysts for growth. If bullish momentum sustains, a breakout rally may deliver the expected 60% to 70% return for patient investors.
✅ Show your support by hitting the like button and
✅ Leaving a comment below! (What is You opinion about this Coin)
Your feedback and engagement keep me inspired to share more insightful market analysis with you!

FUNUSDT Forming Bullish Falling WedgeFUNUSDT is starting to gain attention among traders as volume picks up and momentum begins to build. While no clear chart pattern is currently defined, the steady accumulation and price compression suggest that a breakout may be in the making. With expectations of a 60% to 70% gain, FUNToken could present a strong short-to-midterm trading opportunity, especially for those looking to capitalize on undervalued altcoins before broader market attention arrives.
Fundamentally, FUNToken positions itself within the blockchain gaming and iGaming sectors—industries forecasted for exponential growth. As crypto continues to integrate into online gaming and decentralized entertainment platforms, tokens like FUN stand to benefit significantly. Increasing investor interest reflects growing awareness of this project's utility and potential, further supported by good trading volume and recent wallet accumulation activity on-chain.
Technically, FUNUSDT is trading near key support zones, and a push through resistance levels could trigger rapid upward price movement. Traders should watch for confirmation signals such as bullish candlestick patterns, rising RSI, or a breakout above recent highs. With favorable market conditions and broader altcoin recovery underway, FUNUSDT could easily enter a high-momentum phase.
✅ Show your support by hitting the like button and
✅ Leaving a comment below! (What is You opinion about this Coin)
Your feedback and engagement keep me inspired to share more insightful market analysis with you!

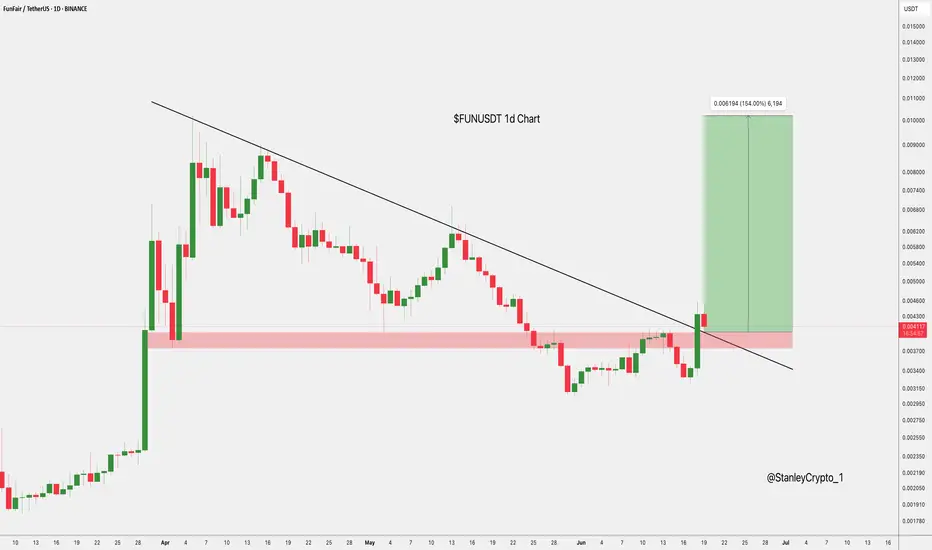
$FUNUSDT Breakout Setup NYSE:FUN has broken out of a long-term downtrend with strong bullish momentum.
It’s now retesting the breakout zone, which also aligns with a key support area.
If this level holds, the next target is 0.010199, a potential 154% move.
Clean breakout-retest setup in play.
DYRO, NFA
Fun Token: March 2026 New All-Time High? It Will Be FunA very strong bullish signal is present on this chart and we have some interesting price dynamics as well and a time-fractal to consider.
Good evening my fellow Cryptocurrency trader, how are you feeling today?
There was a very strong market flush recently with FUNUSDT (Fun Token), removing all LONGs and all SHORTs between December 2024 and April 2025.
After December, there was a crash producing a major low. The lowest prices in 5 years, since March 2020. Then immediately there was a strong rise producing the highest prices since December 2023. Then a retrace and the action goes back to baseline.
The multiple years long low removes all LONGs. The more than a year strong high removes all SHORTs. A full market flush.
The very strong bullish signal is related to the low point from June 2023. As the present retrace ends, the action is back above this level and this is super-bullish.
From March 2020 through late March 2021 we have 55 candles and 385 days. The same would give us a date of 30 March 2026 for the new ATH. That is if FUNUSDT grows in exactly the same way. This is just an entertaining exercise. This bull market can last 221 days, 180 days, 360 days... Anything goes. It can last 465 days for all I know, but, if the same pattern repeats, we have an entire year to see the market grow.
The exact date? The exact high? Anything goes.
What cannot be doubted is the fact that the Cryptocurrency market is set to produce the strongest growth period since 2021. It will be FUN.
Namaste.

FUNUSDT Forming Classic Descending ChannelFUNUSDT has recently completed a significant breakout from a classic descending channel formation, which is a strong bullish reversal pattern. This breakout, fueled by a surge in volume and bullish sentiment, signals a shift in trend after an extended downtrend phase. The price action shows a clear escape from the consolidation zone, followed by strong green candles indicating aggressive buying pressure. Traders are now closely watching this pair for further continuation as momentum builds across the altcoin market.
With a projected gain of 70% to 80%, FUNUSDT stands out as a high-potential opportunity in the current crypto cycle. The breakout aligns with broader market recovery patterns and investor appetite for undervalued tokens. As technicals support this upward trajectory, many analysts believe this rally could extend beyond initial resistance levels, especially if volume remains consistent or grows further. The measured move targets align well with the height of the channel, giving confidence to those entering post-breakout.
Investors are clearly taking an interest in FUNUSDT, as reflected in the sharp upward movement and increased market activity. This shift suggests both short-term traders and longer-term holders are accumulating positions in anticipation of a larger market move. With momentum and structure now favoring bulls, FUNUSDT may continue to outperform similar-cap tokens in the weeks ahead.
For those following chart patterns and volume-based trading strategies, FUNUSDT is demonstrating a strong technical setup. The descending channel breakout, paired with fundamental optimism and liquidity inflow, could be the trigger for sustained upward movement.
✅ Show your support by hitting the like button and
✅ Leaving a comment below! (What is You opinion about this Coin)
Your feedback and engagement keep me inspired to share more insightful market analysis with you!
FUNUSDT SHORTAfter a strong impulsive rally, FUN/USDT tapped into a high-probability supply zone between 0.00771 – 0.00831, showing clear rejection with long upper wicks. Multiple attempts to break above the zone failed indicating buyer exhaustion and a potential reversal
• Entry: 0.00771
• Stop Loss: 0.008317 (above supply zone)

FUN/USDT – Triangle Formation Close to Breakout Point
Pair: FUN/USDT
Timeframe: 1H
Pattern: Symmetrical Triangle
FUN is consolidating inside a symmetrical triangle, but recent candles show pressure on the lower trendline. Price is hovering around 0.0070 and just tested the ascending support. This structure usually leads to a breakout — but the direction will depend on how price reacts in the next few candles.
**Bearish Bias:**
If the price breaks and closes below the triangle with volume, we may see a quick move toward the 0.0045–0.0050 support zone. Sellers are trying to push it out of consolidation.
**Bullish Scenario:**
To shift bullish, FUN must reclaim the 0.0075 level and break above the triangle resistance. Only then a trend reversal or new rally can begin.
No confirmed breakout yet — stay patient and let the move confirm itself.

FUNUSDT Forming Bullish BreakoutFUNUSDT is currently showing a bullish breakout from a long-term descending channel, indicating a potential reversal and strong upside momentum building. After a prolonged downtrend within the falling structure, the price has now breached resistance with notable volume support, signaling that buyers are beginning to regain control. This technical breakout, combined with fresh investor interest, adds significant weight to a potential bullish continuation move in the coming days and weeks.
The pattern visible here is suggestive of a classic trend reversal. With volume expanding and momentum indicators turning bullish, the setup implies a strong recovery is underway. Historical data shows that when FUNUSDT breaks out of such structures, it often leads to parabolic price movements. The chart projects a target gain of around 140% to 150%, with intermediate resistance levels offering multiple potential entries and take-profit zones. The initial breakout is already attracting attention from both retail and institutional traders.
On the fundamental side, FunFair continues to be a recognized name in the blockchain gaming and decentralized gambling space. Its legacy presence, combined with renewed volume interest and community activity, is contributing to the renewed investor enthusiasm. Additionally, the project is increasingly being mentioned across various trading forums and crypto communities, further amplifying the probability of a continued upward trend.
Overall, FUNUSDT is one of the more exciting low-cap altcoins currently in a technical sweet spot. With the breakout confirmed and bullish targets ahead, this could be a great opportunity for traders looking to capitalize on early-stage momentum before wider market recognition kicks in.
✅ Show your support by hitting the like button and
✅ Leaving a comment below! (What is You opinion about this Coin)
Your feedback and engagement keep me inspired to share more insightful market analysis with you!
FUNUSDT Forming Falling WedgeFUNUSDT is currently forming a classic falling wedge pattern, which is widely recognized in technical analysis as a bullish reversal signal. As the price continues to compress within the wedge while holding higher volume on green candles, it suggests growing accumulation by investors. A breakout from this pattern could signal a significant price reversal, with an anticipated gain of 140% to 150%+ based on historical wedge breakout projections. The setup is becoming increasingly favorable for swing traders and mid-term holders.
FUNToken is drawing renewed investor attention due to its integration in blockchain gaming and online entertainment sectors. As demand for decentralized platforms and provably fair gaming continues to grow, FUNToken offers a well-positioned use case. The token has a history of sharp rallies following prolonged consolidation, and the current chart formation indicates that another major move may be imminent. Moreover, sentiment across social and community platforms around FUNToken is turning positive, boosting its speculative momentum.
The technical structure of the chart aligns with increasing trading volume and consistent support holding at key levels, signaling strong underlying demand. The falling wedge is narrowing, suggesting a potential imminent breakout. Once the upper resistance of the wedge is breached with strong volume, price could accelerate rapidly toward upper Fibonacci extension levels, aligning well with the projected 140% to 150% upside potential.
Given these factors, FUNUSDT stands out as a promising opportunity in the altcoin market. Traders and investors watching for strong technical breakouts with real use-case utility will likely find FUN appealing at current levels. Keep an eye on volume spikes and confirmation closes above the wedge for potential entry points.
✅ Show your support by hitting the like button and
✅ Leaving a comment below! (What is You opinion about this Coin)
Your feedback and engagement keep me inspired to share more insightful market analysis with you!

FUN Testing Red Resistance – Breakout Potential! 🚀 FUN Testing Red Resistance – Breakout Potential! 📈
FUN is currently testing the red resistance zone. If the price breaks through, the first target could be the green line level! 📊
Let’s catch this breakout together! 💼💸

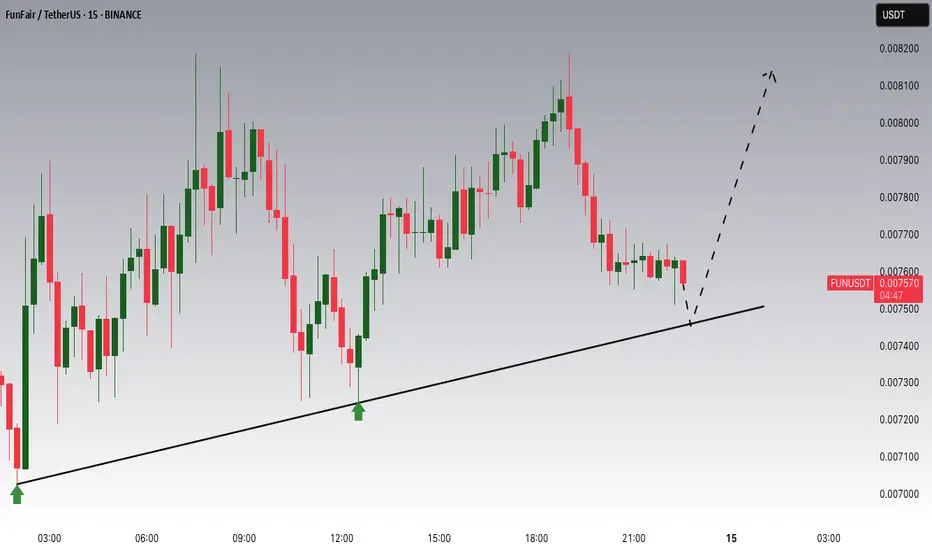
FUN/USDT In an Uptrend, Watching for Correction at Key SupportFUN/USDT has been in a solid uptrend, but we are now seeing a correction phase. The price is approaching a critical support zone around 0.007460, where previous price action has shown both support and resistance. This level is important to watch, as it could provide a potential buying opportunity if price reacts here. A break below could suggest further downside, but if support holds, a bounce toward the recent highs is possible. Monitoring closely for confirmation at this key level.