EURCAD / H1 / Technical ChartEURCAD / H1 / Technical Chart
Good Morning FxCanli Family !
Today I have an analysis at EURCAD
as you see on the chart, price is inside of the correction zone
at this chart, I have 2 plan to trade
1) Yellow ( SELL STOP ), I will open the sell trade, if it will break and close below the support channel
2) Blue ( BUY STOP) , I will open buy trade, if it will break and close above the Resistance channel
Wish you many pips,
Take care...
Fxcanli

EURGBP / H1 / Technical ChartEURGBP / H1 / Technical Chart
Wait for break and close below the suport channel
Wsih you many pipis

EURJPY / H1 / Technical ChartEURJPY / H1 / Technical Chart
Bat pattern completed and Trade is triggered
Targets and Stop is on the chart
wish you many pips

NPXSBTC / Pundi / Daily / Technical ChartNPXSBTC / Pundi / Daily / Technical Chart
Price is moving inside of the triangle,
if it will break and close above the triangle upper line, Big impulse may start
Wish you many profit
Have a nice weekend

EURAUD / H4 / Technical ChartEURAUD / H4 / Technical Chart
Bat pattern was triggered
Targets are on the chart
wish you many pips

USDTRY / H1 / Technical ChartUSDTRY / H1 / Technical Chart
as you remember at 14th January I shared USDTRY at 3,44 level for sell
you can click the chart for mmy previous analysis
Now it looks like Flag pattern
targets are on the chart
wish you many pips

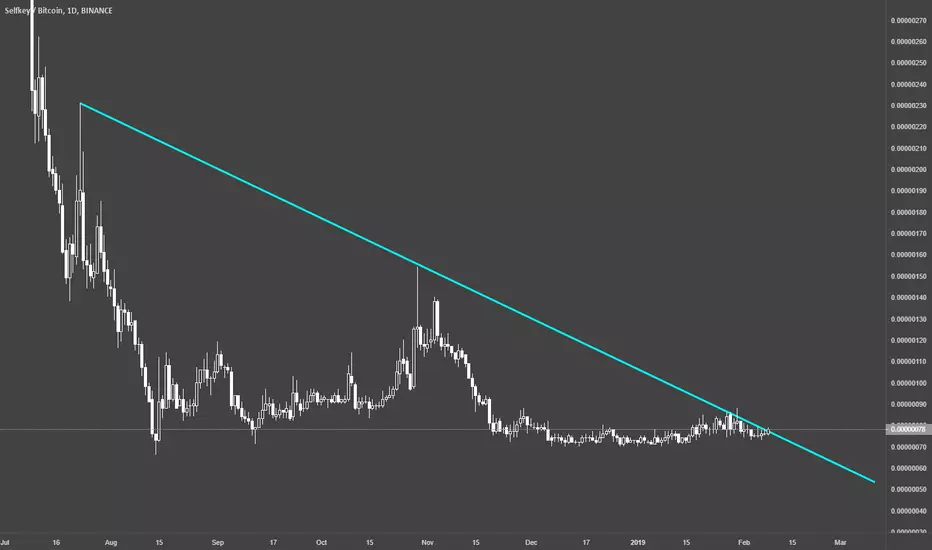
KEYBTC / Daily / Technical ChartKEYBTC / Daily / Technical Chart
it is very close to resistance line
it will break the resistance line soon
wish you many pips

AUDNZD / H1 / Technical ChartAUDNZD / H1 / Technical Chart
it looks like Inverse Head and Shoulders
I will wait bullish candle at the right shoulder which will be green support channel
Wish you many pips

EURCHF / H1 / Technical chartEURCHF / H1 / Technical chart
EURCHF is at Support Channel, if it will broke this support channel
it may go to next support channels which are shown at the chart
wish you many pips

Crypto / SCBTC / Daily / Technical ChartCrypto / SCBTC / Daily / Technical Chart
At the Bat pattern level, I see that price is going up and down inside of the channel
If it will breakout the channel up, it may go to target that I show ont the chart
wish you profitable trade

EURUSD / H1 / Technical ChartEURUSD / H1 / Technical Chart
Gartley pattern will trigger soon
after that my first target is first resistance are, which is at 1,148xxx
after that my second target is, 1,154xx level
wish you many pips
Thanks alot that you support me with your comment and likes

NpxBtc/ Daily / Technical ChartHead and Shoulders pattern will trigerred
I enter this trade from 18 level
But H&S will trigger after the breakout of the neckline
Wish you profitable trade

EURGBP / M15 / Technical ChartEURGBP / M15 / Technical Chart
price is inside of Triangle, I have to wait breakout of the triangle
targets are on the chart
wish you many pips, have a good week

USDTRY / H1 / Technical ChartUSDTRY / H1 / Technical Chart
I shared this chart at 14 January
and Today it broke the triangle, and it is time for open additional lot
Still I am Waiting for 4,90
move stops to 5,40 levels, and we secure 400 pips for the trade that we oppened at 5,44 levels
wish you great weekend

USDTRY / H1 / Technical ChartUSDTRY / H1 / Technical Chart
I am waitin reverse from Resistance zone
wish you many pips


RVNBTC / H1 / Support zoneRVNBTC / H1 / Support zone
It is at the level that was Resistance before, now it tries to make this level support
we have to wait bullish candles couse of that we will enter the trade at level of "Buy Stop"
wish you many pips
good luck

RVNBTC / H1 / Technical ChartRVNBTC / H1 / Technical Chart
It is at the level that was Resistance before, now it tries to make this level support
we have to wait bullish candles couse of that we will enter the trade at level of "Buy Stop"
wish you many pips
good luck

EURUSD / H4 / Support LineEURUSD / H4 / Support Line
I wait reverse from Support line
target and stop is on the chart
wish you many pips

EURUSD / H4 / Technical ChartEURUSD / H4 / Support Line
I wait reverse from Support line
target and stop is on the chart
wish you many pips

SUDTRY / H4 / Butterfly patternGood morning dear my friends,
I started to share USDTRY long term trade at 14 January, when it was at 5,44 and now it is 5,28
lets remeber my shares by date order
14 January
16 January
17 January
18 January
and Today
as you see, it broke and closed below the Strong Support Channel ( Green)
at the the 5,20 level, there is Butterfly pattern, When it will reach to that level, I will update chart again
I am waiting still 4,90 level
as you know, I shared at my other social media channels, and I have 2 open trade and until thattime they are $18K profit
wish you many pips
