GALAUSDT — Holding the Last Fortres, Recovery or Final BreakdownGALA has been in a long-term downtrend since 2021, with heavy selling pressure pushing the price into a prolonged bottoming phase. However, one thing stands out: despite repeated tests, price continues to hold the strong demand zone between 0.0057 – 0.012 USDT. This zone has become the “last fortress” for GALA.
---
🔎 Technical Structure & Pattern
Primary trend: Long-term bearish, consistently forming lower highs since the 2021 peak.
Current phase: Sideways / accumulation above the demand zone. This can either signal early accumulation for a rebound or final distribution before a breakdown.
Key levels:
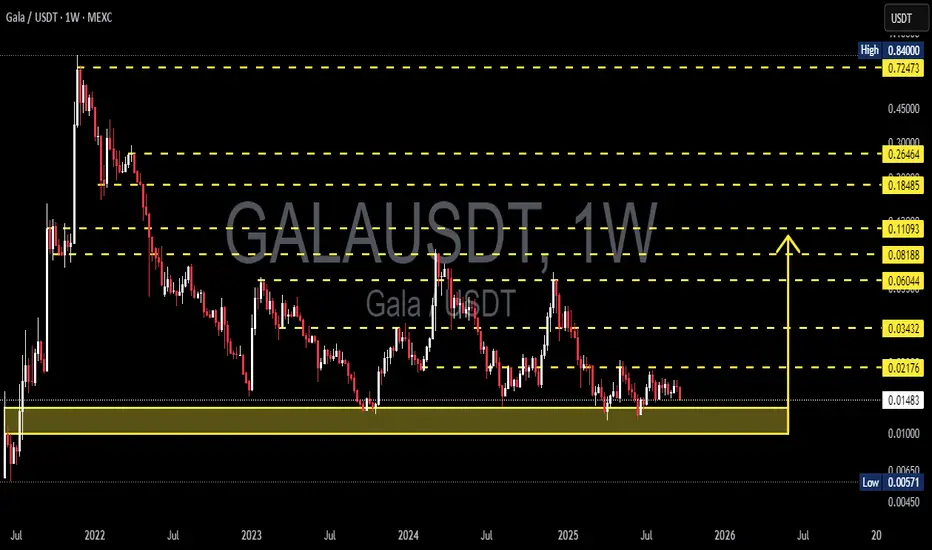
Support: 0.012 – 0.0057 (major demand zone).
Resistances to watch: 0.02176 → 0.03432 → 0.06044 → 0.08188 → 0.11093 → 0.18485 → 0.26464 → 0.72473.
---
🟢 Bullish Scenario
1. Confirmation: A weekly close above 0.02176 would be the first sign of strength.
2. Targets: 0.03432 → 0.06044 → 0.08188. Strong momentum could extend toward 0.11 – 0.18 in the medium term.
3. Upside potential: From the current price (~0.01495), a move to 0.03432 = +129%, to 0.06044 = +304%.
4. Bullish catalysts:
Overall crypto market recovery (BTC rally).
Strong updates from GALA Games ecosystem.
Rising volume indicating smart money inflows.
---
🔴 Bearish Scenario
1. Confirmation: Weekly close below 0.012 → demand zone fails.
2. Downside target: Retest of 0.0057 (≈ −62% from current price).
3. Further risk: A breakdown below 0.0057 could send GALA into new price discovery to the downside.
4. Bearish catalysts:
Market-wide weakness (BTC breakdown).
Thin liquidity around support zones.
Weakening sentiment in the gaming/NFT sector.
---
📌 Key Takeaway
GALA is at a crossroads:
Holding above 0.012 and breaking 0.0217 could ignite a recovery rally.
Losing 0.012 exposes the price to a deeper fall toward 0.0057.
The shrinking volatility on the weekly chart suggests a major move may be imminent.
---
🎯 Conclusion
GALA’s weekly chart is testing investor patience. Holding the demand zone could spark a powerful upside, but losing it risks a deeper slide to historical lows. The next weekly candles will be decisive for GALA’s mid-term direction.
---
#GALA #GALAUSDT #CryptoAnalysis #Altcoins #PriceAction #WeeklyChart #CryptoGaming
GALAUSDC
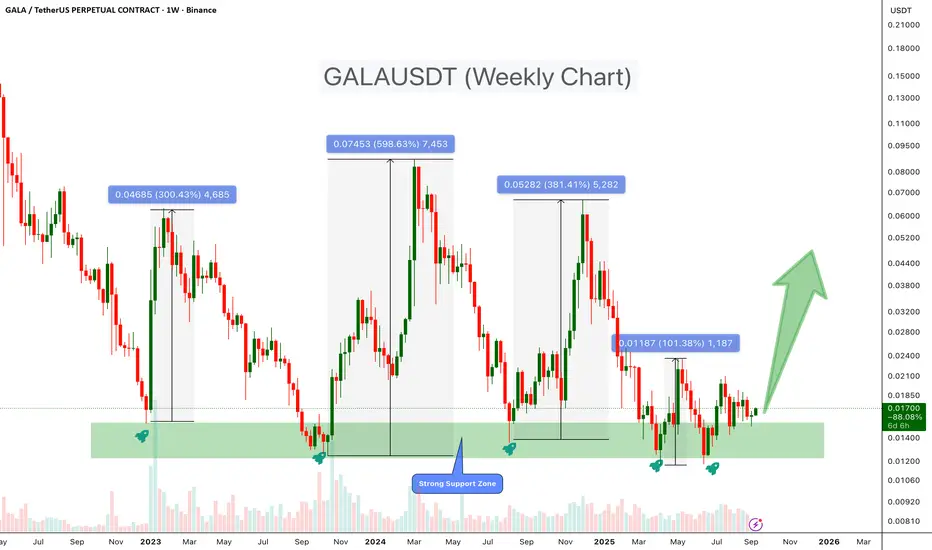
GALAUSDT – History Repeats? Another Bounce from Key Support ZoneGALA is once again testing its long-term support zone, which has historically acted as a strong base for major rallies. Every time the price touched this level in the past, it triggered significant upward moves ranging from +250% to +550%.
- Support Zone: Price is currently sitting in a key weekly support zone, where previous rallies originated.
Historical Bounces:
+300% rally in late 2022
+590% rally in early 2024
+381% rally in mid-2024
+101% rally earlier in 2025
Current Setup: Price has returned to this zone again, with potential for another bounce targeting ~200% -400% upside if history repeats.
Cheers
Hexa
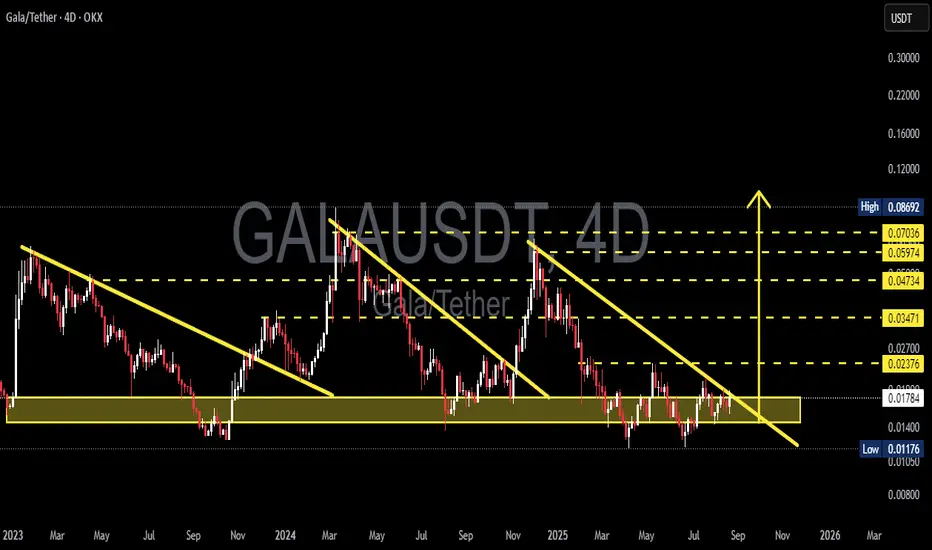
GALA/USDT — Approaching Decision Zone: Breakout or Breakdown?📊 Chart Overview (4D Timeframe)
GALA price is currently trading within the multi-year accumulation zone (0.012 – 0.018 USDT) that has held since 2023. This area represents a major battleground between buyers (accumulation) and sellers (distribution).
The chart reveals a recurring descending resistance line (falling wedge structure) that has historically led to strong rallies whenever broken. Price is now pressing against the apex where the long-term support zone meets the descending trendline — a decisive move is imminent.
---
🔎 Technical Structure & Pattern
Accumulation Zone (0.012 – 0.018):
Strong multi-year support where buyers have consistently absorbed selling pressure.
Descending Trendline:
Connecting lower highs since 2023; acts as the “ceiling” for price. A breakout often triggers rapid upside.
Repetitive Falling Wedges:
At least 3 major falling wedges since 2023; each breakout → triggered a rally.
Key Resistances Ahead:
0.0237 → 0.0347 → 0.0473 → 0.0597 → 0.0703.
Range Extremes:
Major High: 0.0869 USDT
Major Low: 0.0117 USDT
---
✅ Bullish Scenario
1. Confirmation: 4D/daily close above descending trendline + reclaim 0.0237 USDT.
2. Short-term targets: 0.0347 → 0.0473.
3. Mid-term targets: 0.0597 – 0.0703 (major resistance cluster).
4. Potential rally: Based on past wedge breakouts, a +100% upside in weeks is not impossible.
📌 Key factor: Breakout must come with strong volume + successful retest.
---
❌ Bearish Scenario
1. Confirmation: Failure to break trendline + 4D close below 0.0117 USDT.
2. Downside targets: 0.010 → 0.008 zone.
3. Risk: Losing this multi-year accumulation would shift GALA into a deeper distribution phase.
📌 Caution: Beware of false breakdowns leading to short squeezes.
---
🎯 Conclusion
GALA is sitting at a make-or-break level:
🔼 Breakout → opens path to a strong rally.
🔽 Breakdown → risk of revisiting lower structural zones.
The falling wedge repetition increases the odds of a bullish breakout if confirmed.
0.0237 USDT remains the “gateway” to trend reversal.
---
⚡ Trader Notes
Avoid FOMO — wait for clear confirmation.
Always use risk management & proper position sizing.
Watch BTC and broader altcoin sentiment, as GALA’s move will likely follow macro market conditions.
#GALA #GALAUSDT #CryptoAnalysis #Altcoins #Breakout #SupportResistance #Accumulation #TechnicalAnalysis #SwingTrading #CryptoMarket
GALA TRADE IDEA AND ANALYSISGALA stood from support and currently above the support line and forming a bullish setup. After successful breakout of the above trendline, we may expect bullish move in upcoming days.

GALA GOING TOWARDS ACCUMULATION ZONEGALA is falling sharply towards accumulation zone near 0.04 area. WHEN BTC stops playing or it goes up then we might see another good pump in GALA. So expecting correction for few more days.
