#GALA/USDT — Holding the Last Fortres, Recovery or Final Break#GALA
The price is moving in a descending channel on the 1-hour timeframe. It has reached the lower boundary and is heading towards breaking above it, with a retest of the upper boundary expected.
We have a downtrend on the RSI indicator, which has reached near the lower boundary, and an upward rebound is expected.
There is a key support zone in green at 0.00700. The price has bounced from this zone multiple times and is expected to bounce again.
We have a trend towards stability above the 100-period moving average, as we are moving close to it, which supports the upward movement.
Entry price: 0.00714
First target: 0.00721
Second target: 0.00741
Third target: 0.00763
Don't forget a simple principle: money management.
Place your stop-loss below the support zone in green.
For any questions, please leave a comment.
Thank you.
Galausdtanalysis

GALAUSDTThe overall structure remains bearish as the price continues to form lower highs and lower lows below the descending trendline.
However, compression near the 0.00670 dollar support suggests selling momentum is weakening and a short-term corrective bounce is possible if this level holds.
BINANCE:GALAUSDT

#GALA/USDT — Holding the Last Fortres, Recovery or Final Break#GALA
The price is moving within a descending channel on the 1-hour frame, adhering well to it, and is heading for a strong breakout and retest.
We have a bearish trend on the RSI indicator that is about to be broken and retested, which supports the upward breakout.
There is a major support area in green at 0.01014, which represents a strong support point.
We are heading for consolidation above the 100 moving average.
Entry price: 0.01087
First target: 0.01100
Second target: 0.01134
Third target: 0.01174
Don't forget a simple matter: capital management.
When you reach the first target, save some money and then change your stop-loss order to an entry order.
For inquiries, please leave a comment.
Thank you.

#GALA/USDT — Holding the Last Fortres, Recovery or Final Break#GALA
The price is moving within a descending channel on the 1-hour frame, adhering well to it, and is heading for a strong breakout and retest.
We have a bearish trend on the RSI indicator that is about to be broken and retested, which supports the upward breakout.
There is a major support area in green at 0.01400, which represents a strong support point.
We are heading for consolidation above the 100 moving average.
Entry price: 0.01416
First target: 0.01440
Second target: 0.01458
Third target: 0.01481
Don't forget a simple matter: capital management.
When you reach the first target, save some money and then change your stop-loss order to an entry order.
For inquiries, please leave a comment.
Thank you.

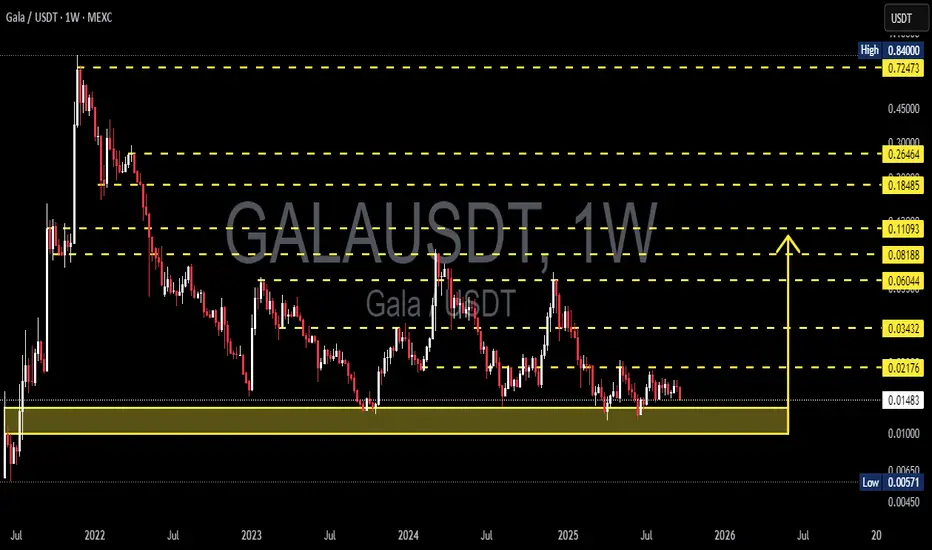
GALAUSDT — Holding the Last Fortres, Recovery or Final BreakdownGALA has been in a long-term downtrend since 2021, with heavy selling pressure pushing the price into a prolonged bottoming phase. However, one thing stands out: despite repeated tests, price continues to hold the strong demand zone between 0.0057 – 0.012 USDT. This zone has become the “last fortress” for GALA.
---
🔎 Technical Structure & Pattern
Primary trend: Long-term bearish, consistently forming lower highs since the 2021 peak.
Current phase: Sideways / accumulation above the demand zone. This can either signal early accumulation for a rebound or final distribution before a breakdown.
Key levels:
Support: 0.012 – 0.0057 (major demand zone).
Resistances to watch: 0.02176 → 0.03432 → 0.06044 → 0.08188 → 0.11093 → 0.18485 → 0.26464 → 0.72473.
---
🟢 Bullish Scenario
1. Confirmation: A weekly close above 0.02176 would be the first sign of strength.
2. Targets: 0.03432 → 0.06044 → 0.08188. Strong momentum could extend toward 0.11 – 0.18 in the medium term.
3. Upside potential: From the current price (~0.01495), a move to 0.03432 = +129%, to 0.06044 = +304%.
4. Bullish catalysts:
Overall crypto market recovery (BTC rally).
Strong updates from GALA Games ecosystem.
Rising volume indicating smart money inflows.
---
🔴 Bearish Scenario
1. Confirmation: Weekly close below 0.012 → demand zone fails.
2. Downside target: Retest of 0.0057 (≈ −62% from current price).
3. Further risk: A breakdown below 0.0057 could send GALA into new price discovery to the downside.
4. Bearish catalysts:
Market-wide weakness (BTC breakdown).
Thin liquidity around support zones.
Weakening sentiment in the gaming/NFT sector.
---
📌 Key Takeaway
GALA is at a crossroads:
Holding above 0.012 and breaking 0.0217 could ignite a recovery rally.
Losing 0.012 exposes the price to a deeper fall toward 0.0057.
The shrinking volatility on the weekly chart suggests a major move may be imminent.
---
🎯 Conclusion
GALA’s weekly chart is testing investor patience. Holding the demand zone could spark a powerful upside, but losing it risks a deeper slide to historical lows. The next weekly candles will be decisive for GALA’s mid-term direction.
---
#GALA #GALAUSDT #CryptoAnalysis #Altcoins #PriceAction #WeeklyChart #CryptoGaming
#GALA/USDT Sustain the Current Bullish Momentum !#GALA
The price is moving within an ascending channel on the 1-hour frame, adhering well to it, and is poised to break it strongly upwards and retest it.
We have support from the lower boundary of the ascending channel, at 0.01580.
We have a downtrend on the RSI indicator that is about to break and retest, supporting the upward move.
There is a key support area (in green) at 0.01600, which represents a strong basis for the upward move.
Don't forget one simple thing: ease and capital.
When you reach the first target, save some money and then change your stop-loss order to an entry order.
For inquiries, please leave a comment.
We have a trend of stability above the Moving Average 100.
Entry price: 0.01620
First target: 0.01687
Second target: 0.01791
Third target: 0.01907
Don't forget one simple thing: ease and capital.
When you reach the first target, save some money and then change your stop-loss order to an entry order.
For inquiries, please leave a comment.
Thank you.

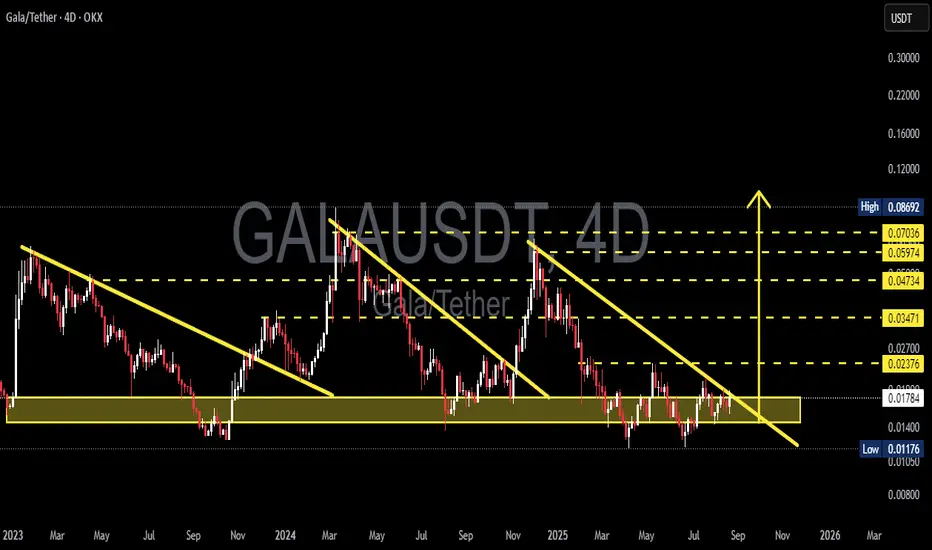
GALA/USDT — Approaching Decision Zone: Breakout or Breakdown?📊 Chart Overview (4D Timeframe)
GALA price is currently trading within the multi-year accumulation zone (0.012 – 0.018 USDT) that has held since 2023. This area represents a major battleground between buyers (accumulation) and sellers (distribution).
The chart reveals a recurring descending resistance line (falling wedge structure) that has historically led to strong rallies whenever broken. Price is now pressing against the apex where the long-term support zone meets the descending trendline — a decisive move is imminent.
---
🔎 Technical Structure & Pattern
Accumulation Zone (0.012 – 0.018):
Strong multi-year support where buyers have consistently absorbed selling pressure.
Descending Trendline:
Connecting lower highs since 2023; acts as the “ceiling” for price. A breakout often triggers rapid upside.
Repetitive Falling Wedges:
At least 3 major falling wedges since 2023; each breakout → triggered a rally.
Key Resistances Ahead:
0.0237 → 0.0347 → 0.0473 → 0.0597 → 0.0703.
Range Extremes:
Major High: 0.0869 USDT
Major Low: 0.0117 USDT
---
✅ Bullish Scenario
1. Confirmation: 4D/daily close above descending trendline + reclaim 0.0237 USDT.
2. Short-term targets: 0.0347 → 0.0473.
3. Mid-term targets: 0.0597 – 0.0703 (major resistance cluster).
4. Potential rally: Based on past wedge breakouts, a +100% upside in weeks is not impossible.
📌 Key factor: Breakout must come with strong volume + successful retest.
---
❌ Bearish Scenario
1. Confirmation: Failure to break trendline + 4D close below 0.0117 USDT.
2. Downside targets: 0.010 → 0.008 zone.
3. Risk: Losing this multi-year accumulation would shift GALA into a deeper distribution phase.
📌 Caution: Beware of false breakdowns leading to short squeezes.
---
🎯 Conclusion
GALA is sitting at a make-or-break level:
🔼 Breakout → opens path to a strong rally.
🔽 Breakdown → risk of revisiting lower structural zones.
The falling wedge repetition increases the odds of a bullish breakout if confirmed.
0.0237 USDT remains the “gateway” to trend reversal.
---
⚡ Trader Notes
Avoid FOMO — wait for clear confirmation.
Always use risk management & proper position sizing.
Watch BTC and broader altcoin sentiment, as GALA’s move will likely follow macro market conditions.
#GALA #GALAUSDT #CryptoAnalysis #Altcoins #Breakout #SupportResistance #Accumulation #TechnicalAnalysis #SwingTrading #CryptoMarket
GALA price analysis🪙 Please tell us, is the #GALA project still "alive"?
It's old, has gone through many cycles on the crypto market, and hasn't died yet.
Maybe now (being related to the CRYPTOCAP:ETH Ecosystem) is the best time to “come back to life”?
For this to happen, the price of OKX:GALAUSDT must finally:
1️⃣ confidently hold above $0.01390-0.01460
2️⃣ continue to grow confidently to $0.044
3️⃣ And finally, rapidly grow to $0.10-0.11 by the end of the year.
Is this a realistic scenario? Write your thoughts in the comments.

GALA/USDT | Testing Critical Historical Support – Rebound?🧠 Full & Professional Analysis:
GALA/USDT is currently sitting at a critical inflection point on the weekly timeframe. The price has returned to a major historical demand zone between $0.01200 – $0.01400, which has served as a strong support base for over a year.
This level has repeatedly acted as a launchpad for rallies since early 2023, making it a high-interest area for long-term investors and swing traders.
🔍 Key Technical Structure & Zones:
🟨 Major Weekly Support Zone:
$0.01200 – $0.01400 → A historically proven demand zone that has held multiple times. A stronghold for buyers, and a potential accumulation base.
🟦 Layered Resistance Zones (If Rebound Occurs):
$0.02176 → First minor resistance; initial confirmation of a bullish reversal.
$0.03432 → Mid-range resistance within current consolidation.
$0.06044 → Key breakout level to shift trend structure.
$0.11093 – $0.18485 → Medium-term targets if bullish momentum builds.
$0.26464 to $0.72473 → Historical distribution zones if full recovery unfolds.
🟥 Bearish Risk Zone (Breakdown Scenario):
Break below $0.01200 opens downside risk toward the all-time low at $0.00571, or even lower if sentiment worsens.
✅ Bullish Scenario:
If the $0.01200–$0.01400 support holds:
1. A bullish engulfing candle on the weekly chart could be an early reversal signal.
2. Potential formation of a double bottom in this demand zone (yet to be confirmed).
3. Initial target at $0.02176, with possible extension toward $0.06044—a major pivot zone.
4. Sustained buying and volume confirmation could push GALA toward $0.110 – $0.184 in the mid-term.
❌ Bearish Scenario:
If the price fails to hold above $0.01200:
1. A breakdown may trigger a capitulation move to the $0.00700 – $0.00571 range (historical lows).
2. This would invalidate the current sideways base structure and extend the downtrend.
3. Lack of buying interest could open the door to deeper losses.
📐 Pattern & Technical Context:
Accumulation Base Formation: Still possible if support holds and buyers step in.
Tight Range Compression: Price is coiling at the bottom, indicating a potential breakout move soon.
No major reversal patterns confirmed yet, such as Inverse H&S or W-bottom, but structure suggests accumulation pressure.
🧭 Summary:
> GALA is dancing on the edge of a crucial support level. The price action in this zone will likely determine the next major direction. A bounce could ignite a multi-week rally, while a breakdown may send the asset to new lows. Volume and weekly close will be key confirmation points.
📊 Recommendations:
Swing Traders: Watch for bullish candle patterns and breakout above $0.02176.
Long-Term Investors: Consider conservative accumulation in the support zone with clear risk management.
Bearish Traders: Wait for confirmed weekly close below $0.012 before considering short setups.
#GALA #GALAUSDT #CryptoTA #AltcoinAnalysis #WeeklyChart #BullishSetup #BearishScenario #TechnicalAnalysis #AccumulationZone #BreakoutWatch

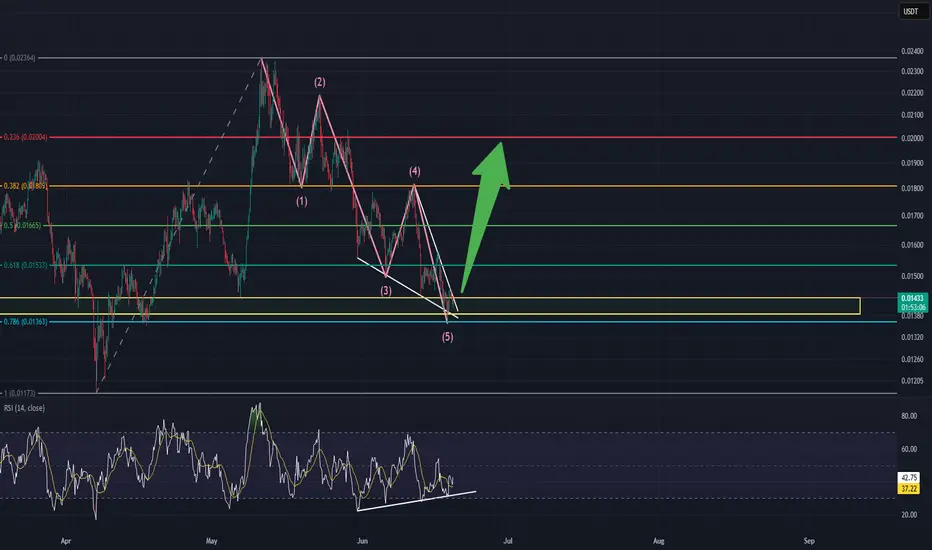
GALA/USDT - 4HR TIME FRAME - BULLISH!!This chart illustrates a bullish reversal setup using Elliott Wave Theory, Fibonacci retracement levels, and RSI divergence. Here's a detailed breakdown:
📉 Elliott Wave Count:
The chart shows a complete 5-wave impulse down labeled (1) to (5), suggesting a potential end of a bearish trend.
Wave (5) appears to have just completed, indicating a possible reversal point.
🔍 Falling Wedge Pattern:
A falling wedge is visible between waves (4) and (5), which is typically a bullish reversal pattern.
Price is near the wedge’s apex, hinting at an imminent breakout.
🟡 Strong Demand Zone:
Price is currently inside a yellow demand zone (roughly $0.0136 to $0.0144).
This zone coincides with the 0.786 Fibonacci retracement level at $0.01363, a common reversal level.
📊 RSI Indicator:
The RSI at the bottom shows a bullish divergence:
Price made a lower low, while RSI made a higher low.
This signals weakening bearish momentum and potential upside ahead.
🧠 Summary:
This is a technically sound bullish setup, suggesting a bottoming structure and an upcoming uptrend. The confluence of Elliott Wave completion, wedge breakout, RSI divergence, and Fibonacci support all point to a strong reversal probability.
GALAUSDT 1W AnalysisGALA ~ 1W Analysis
#GALA Buy at support block if you still have confidence in this coin with a short term target of at least 20%+ from here.

GALAUSDT 1D AnalysisGALA ~ 1D Analysis
#GALA Buy back on retest of this support block with short term target of at least 15%+ from here.

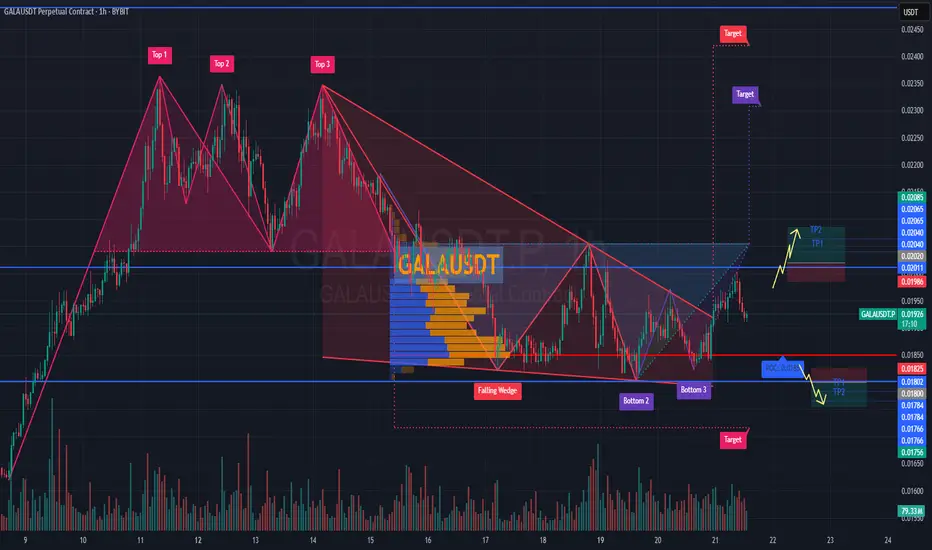
Forecast for #GALAUSDT📉 Forecast for BYBIT:GALAUSDT.P (1H TF)
🕒 Current Situation: The price is in a key decision zone near POC $0.01851, consolidating after a breakout from the Falling Wedge pattern.
➡️ The direction depends on the reaction to this area.
✅ Overview:
➡️ A Triple Bottom (Bottom 1-2-3) pattern is visible — a bullish signal.
➡️ Price broke out of the wedge and is now retesting.
➡️ Two scenarios remain: LONG if support holds or SHORT if it breaks.
📢 Bullish sign: candle wicks down + rising volume on bounce.
🧭 Watch price action and volume near $0.0185–0.0190.
************************
📈 LONG SCENARIO - Conditions: Holding above $0.0190
Entry: BYBIT:GALAUSDT.P from $0.02020
🛡 Stop loss: $0.01986
🎯 TP Targets:
💎 TP 1: $0.02040
💎 TP 2: $0.02065
💎 TP 3: $0.02085
📍 Confirming bullish strength after wedge breakout.
**************************
📉 SHORT SCENARIO - Conditions: Break and close below $0.0185
Entry: BYBIT:GALAUSDT.P from $0.01800
🛡 Stop loss: $0.01825
🎯 TP Targets:
💎 TP 1: $0.01784
💎 TP 2: $0.01766
💎 TP 3: $0.01756
📢 Confirmation: high volume + multiple closes below POC.
⚠️ Losing $0.0185 reactivates the bearish structure toward $0.01700.
🚀 Conclusion: We are in a decision zone.
📍 Hold above POC = bullish setup.
📍 Breakdown = bearish setup.
📢 Wait for confirmation with volume and price reaction BYBIT:GALAUSDT.P
#GALA/USDT
#GALA
The price is moving within a descending channel on the 1-hour frame, adhering well to it, and is heading for a strong breakout and retest.
We are seeing a bounce from the lower boundary of the descending channel, which is support at 0.01688.
We have a downtrend on the RSI indicator that is about to break and retest, supporting the upward trend.
We are looking for stability above the 100 moving average.
Entry price: 0.01703
First target: 0.01725
Second target: 0.01754
Third target: 0.01788

GALAUSDT 1D AnalysisGALA ~ 1D Analysis
#GALA Buy after successfully penetrating this resistant line with a short -term target of at least 10%+ from here.

#GALA/USDT#GALA
The price is moving within a descending channel on the 1-hour frame, adhering well to it, and is on its way to breaking it strongly upwards and retesting it.
We are seeing a bounce from the lower boundary of the descending channel, this support at 0.01415.
We have a downtrend on the RSI indicator that is about to break and retest, supporting the upward trend.
We are looking for stability above the 100 moving average.
Entry price: 0.01504
First target: 0.01540
Second target: 0.01577
Third target: 0.016532

quadruple bottom In Gala GALA Coin – Quadruple Bottom Formation & Long-Term Accumulation
GALA is showing strong signs of a quadruple bottom pattern on the charts, a rare but powerful bullish reversal signal. This formation reflects a solid support level that has been tested multiple times, indicating significant buying interest and strong defense against further downside.
The accumulation zone is observed between $0.012 and $0.07, where long-term investors and smart money are gradually building positions. The price has consistently held within this range, suggesting consolidation and preparing for a potential breakout.
Given the prolonged accumulation and resilient support, a bullish bounce is anticipated within the next 3 months. If the pattern plays out, this could trigger a strong upward move as market sentiment shifts and buying volume increases.

GALAUSDT 1WGALA ~ 1W Analysis
#GALA Buy gradually from here if you still have a Conviction on this coin with a short -term target of at least 20%+.

GALAUSDT 1WGALA ~ 1W Analysis
#GALA This is the lowest support for now. Buy from here if you still have a Conviction on this coin. with a short -term target of at least 20%+.

GALA/USDT BUYHello friends
Considering the price reaching the bottom and reaching good support, now is a good time to enter two buy steps. We have specified for you that you can buy steps.
We have also specified price targets for you.
*Trade safely with us*

#GALA/USDT#GALA
The price is moving in a descending channel on the 1-hour frame and is adhering to it well and is heading to break it strongly upwards and retest it
We have a bounce from the lower limit of the descending channel, this support is at a price of 0.01674
We have a downtrend on the RSI indicator that is about to break and retest, which supports the rise
We have a trend to stabilize above the Moving Average 100
Entry price 0.01870
First target 0.01870
Second target 0.01993
Third target 0.02129

#GALAUSDT is breaking resistance – expecting a moveBYBIT:GALAUSDT.P is trading near the key $0.02490 level, forming a consolidation zone before a potential breakout. Volume is increasing, and price is holding above POC $0.02255, confirming strong buyer activity. A breakout above $0.02495 could trigger an accelerated move toward $0.02520 – $0.02565.
📈 LONG BYBIT:GALAUSDT.P from $0.02495
🛡 Stop Loss: $0.02460
⏱ 1H Timeframe
✅ Overview:
➡️ BYBIT:GALAUSDT.P is approaching $0.02495, a key resistance level.
➡️ Price remains above POC $0.02255, confirming strong buyer interest.
➡️ Increasing volume supports the potential bullish move.
⚡ Plan:
🔵 Holding above $0.02495 increases the chance of an uptrend.
🔵 Main support at $0.02460 – losing this level invalidates the setup.
🔵 Target zones – $0.02520, $0.02540, and $0.02565, where profit-taking is expected.
🎯 Take Profit:
💎TP1: $0.02520 – first profit-taking zone.
💎 TP2: $0.02540 – strong resistance level.
💎 TP3: $0.02565 – final upside target.
📢 Recommendations:
✅ Bullish confirmation requires a strong close above $0.02495.
✅ If price slows down at $0.02520, partial profit-taking is recommended.
✅ A drop below $0.02460 invalidates the setup.
🚀 BYBIT:GALAUSDT.P is breaking resistance – expecting a move to $0.02565!
📢 Holding above $0.02495 opens the door for further gains. Watch volume closely – if it weakens, price may consolidate.
📢 Entry above $0.02495, targets at $0.02520 – $0.02565.
📢 Partial profit-taking recommended at $0.02540.
📢 If price drops below $0.02460, the setup is invalidated.
📌 Strategy: Resistance Breakout + Profit Targeting at Key Levels.

GALAUSDT 1WGALA ~ 1W Analysis
#GALA Buy gradually from here if you still have a Conviction on this Coin with a minimum target of 20%+.
