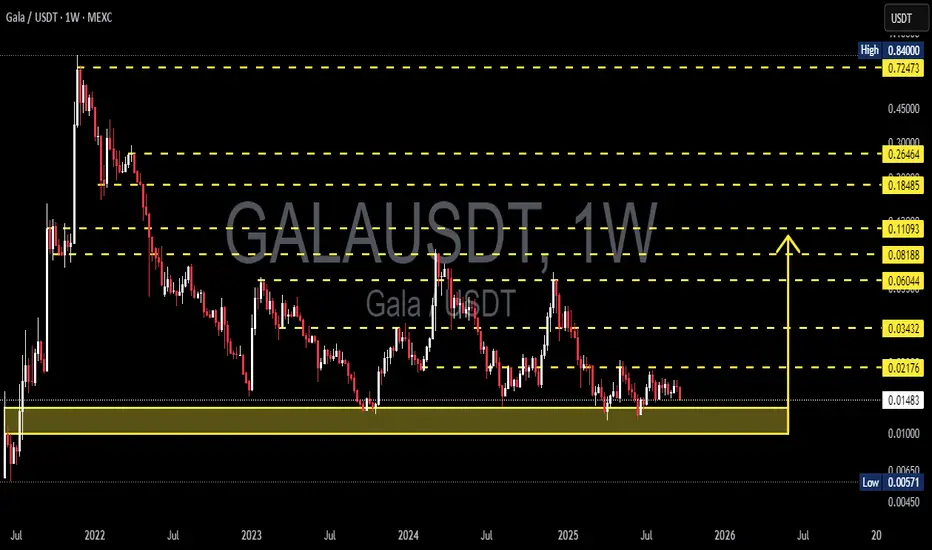
GALAUSDT — Holding the Last Fortres, Recovery or Final BreakdownGALA has been in a long-term downtrend since 2021, with heavy selling pressure pushing the price into a prolonged bottoming phase. However, one thing stands out: despite repeated tests, price continues to hold the strong demand zone between 0.0057 – 0.012 USDT. This zone has become the “last fortress” for GALA.
---
🔎 Technical Structure & Pattern
Primary trend: Long-term bearish, consistently forming lower highs since the 2021 peak.
Current phase: Sideways / accumulation above the demand zone. This can either signal early accumulation for a rebound or final distribution before a breakdown.
Key levels:
Support: 0.012 – 0.0057 (major demand zone).
Resistances to watch: 0.02176 → 0.03432 → 0.06044 → 0.08188 → 0.11093 → 0.18485 → 0.26464 → 0.72473.
---
🟢 Bullish Scenario
1. Confirmation: A weekly close above 0.02176 would be the first sign of strength.
2. Targets: 0.03432 → 0.06044 → 0.08188. Strong momentum could extend toward 0.11 – 0.18 in the medium term.
3. Upside potential: From the current price (~0.01495), a move to 0.03432 = +129%, to 0.06044 = +304%.
4. Bullish catalysts:
Overall crypto market recovery (BTC rally).
Strong updates from GALA Games ecosystem.
Rising volume indicating smart money inflows.
---
🔴 Bearish Scenario
1. Confirmation: Weekly close below 0.012 → demand zone fails.
2. Downside target: Retest of 0.0057 (≈ −62% from current price).
3. Further risk: A breakdown below 0.0057 could send GALA into new price discovery to the downside.
4. Bearish catalysts:
Market-wide weakness (BTC breakdown).
Thin liquidity around support zones.
Weakening sentiment in the gaming/NFT sector.
---
📌 Key Takeaway
GALA is at a crossroads:
Holding above 0.012 and breaking 0.0217 could ignite a recovery rally.
Losing 0.012 exposes the price to a deeper fall toward 0.0057.
The shrinking volatility on the weekly chart suggests a major move may be imminent.
---
🎯 Conclusion
GALA’s weekly chart is testing investor patience. Holding the demand zone could spark a powerful upside, but losing it risks a deeper slide to historical lows. The next weekly candles will be decisive for GALA’s mid-term direction.
---
#GALA #GALAUSDT #CryptoAnalysis #Altcoins #PriceAction #WeeklyChart #CryptoGaming
Galausdtidea
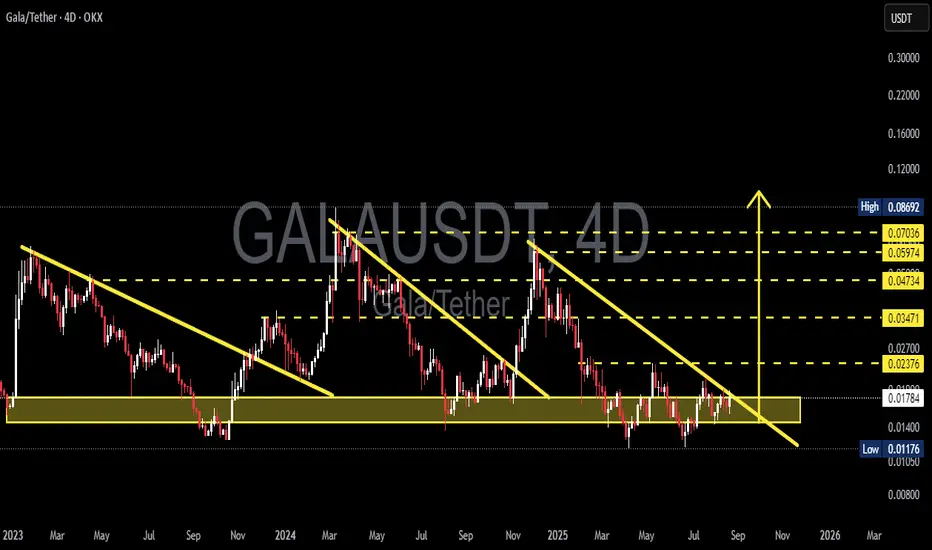
GALA/USDT — Approaching Decision Zone: Breakout or Breakdown?📊 Chart Overview (4D Timeframe)
GALA price is currently trading within the multi-year accumulation zone (0.012 – 0.018 USDT) that has held since 2023. This area represents a major battleground between buyers (accumulation) and sellers (distribution).
The chart reveals a recurring descending resistance line (falling wedge structure) that has historically led to strong rallies whenever broken. Price is now pressing against the apex where the long-term support zone meets the descending trendline — a decisive move is imminent.
---
🔎 Technical Structure & Pattern
Accumulation Zone (0.012 – 0.018):
Strong multi-year support where buyers have consistently absorbed selling pressure.
Descending Trendline:
Connecting lower highs since 2023; acts as the “ceiling” for price. A breakout often triggers rapid upside.
Repetitive Falling Wedges:
At least 3 major falling wedges since 2023; each breakout → triggered a rally.
Key Resistances Ahead:
0.0237 → 0.0347 → 0.0473 → 0.0597 → 0.0703.
Range Extremes:
Major High: 0.0869 USDT
Major Low: 0.0117 USDT
---
✅ Bullish Scenario
1. Confirmation: 4D/daily close above descending trendline + reclaim 0.0237 USDT.
2. Short-term targets: 0.0347 → 0.0473.
3. Mid-term targets: 0.0597 – 0.0703 (major resistance cluster).
4. Potential rally: Based on past wedge breakouts, a +100% upside in weeks is not impossible.
📌 Key factor: Breakout must come with strong volume + successful retest.
---
❌ Bearish Scenario
1. Confirmation: Failure to break trendline + 4D close below 0.0117 USDT.
2. Downside targets: 0.010 → 0.008 zone.
3. Risk: Losing this multi-year accumulation would shift GALA into a deeper distribution phase.
📌 Caution: Beware of false breakdowns leading to short squeezes.
---
🎯 Conclusion
GALA is sitting at a make-or-break level:
🔼 Breakout → opens path to a strong rally.
🔽 Breakdown → risk of revisiting lower structural zones.
The falling wedge repetition increases the odds of a bullish breakout if confirmed.
0.0237 USDT remains the “gateway” to trend reversal.
---
⚡ Trader Notes
Avoid FOMO — wait for clear confirmation.
Always use risk management & proper position sizing.
Watch BTC and broader altcoin sentiment, as GALA’s move will likely follow macro market conditions.
#GALA #GALAUSDT #CryptoAnalysis #Altcoins #Breakout #SupportResistance #Accumulation #TechnicalAnalysis #SwingTrading #CryptoMarket
GALA/USDT | Testing Critical Historical Support – Rebound?🧠 Full & Professional Analysis:
GALA/USDT is currently sitting at a critical inflection point on the weekly timeframe. The price has returned to a major historical demand zone between $0.01200 – $0.01400, which has served as a strong support base for over a year.
This level has repeatedly acted as a launchpad for rallies since early 2023, making it a high-interest area for long-term investors and swing traders.
🔍 Key Technical Structure & Zones:
🟨 Major Weekly Support Zone:
$0.01200 – $0.01400 → A historically proven demand zone that has held multiple times. A stronghold for buyers, and a potential accumulation base.
🟦 Layered Resistance Zones (If Rebound Occurs):
$0.02176 → First minor resistance; initial confirmation of a bullish reversal.
$0.03432 → Mid-range resistance within current consolidation.
$0.06044 → Key breakout level to shift trend structure.
$0.11093 – $0.18485 → Medium-term targets if bullish momentum builds.
$0.26464 to $0.72473 → Historical distribution zones if full recovery unfolds.
🟥 Bearish Risk Zone (Breakdown Scenario):
Break below $0.01200 opens downside risk toward the all-time low at $0.00571, or even lower if sentiment worsens.
✅ Bullish Scenario:
If the $0.01200–$0.01400 support holds:
1. A bullish engulfing candle on the weekly chart could be an early reversal signal.
2. Potential formation of a double bottom in this demand zone (yet to be confirmed).
3. Initial target at $0.02176, with possible extension toward $0.06044—a major pivot zone.
4. Sustained buying and volume confirmation could push GALA toward $0.110 – $0.184 in the mid-term.
❌ Bearish Scenario:
If the price fails to hold above $0.01200:
1. A breakdown may trigger a capitulation move to the $0.00700 – $0.00571 range (historical lows).
2. This would invalidate the current sideways base structure and extend the downtrend.
3. Lack of buying interest could open the door to deeper losses.
📐 Pattern & Technical Context:
Accumulation Base Formation: Still possible if support holds and buyers step in.
Tight Range Compression: Price is coiling at the bottom, indicating a potential breakout move soon.
No major reversal patterns confirmed yet, such as Inverse H&S or W-bottom, but structure suggests accumulation pressure.
🧭 Summary:
> GALA is dancing on the edge of a crucial support level. The price action in this zone will likely determine the next major direction. A bounce could ignite a multi-week rally, while a breakdown may send the asset to new lows. Volume and weekly close will be key confirmation points.
📊 Recommendations:
Swing Traders: Watch for bullish candle patterns and breakout above $0.02176.
Long-Term Investors: Consider conservative accumulation in the support zone with clear risk management.
Bearish Traders: Wait for confirmed weekly close below $0.012 before considering short setups.
#GALA #GALAUSDT #CryptoTA #AltcoinAnalysis #WeeklyChart #BullishSetup #BearishScenario #TechnicalAnalysis #AccumulationZone #BreakoutWatch

GALAUSDT 1W AnalysisGALA ~ 1W Analysis
#GALA Buy at support block if you still have confidence in this coin with a short term target of at least 20%+ from here.

GALAUSDT 1D AnalysisGALA ~ 1D Analysis
#GALA Buy back on retest of this support block with short term target of at least 15%+ from here.
GLong

GALAUSDT 1D AnalysisGALA ~ 1D Analysis
#GALA Buy after successfully penetrating this resistant line with a short -term target of at least 10%+ from here.

GALAUSDT 1WGALA ~ 1W Analysis
#GALA Buy gradually from here if you still have a Conviction on this coin with a short -term target of at least 20%+.

GALAUSDT 1WGALA ~ 1W Analysis
#GALA This is the lowest support for now. Buy from here if you still have a Conviction on this coin. with a short -term target of at least 20%+.

GALAUSDT 1WGALA ~ 1W Analysis
#GALA Buy gradually from here if you still have a Conviction on this Coin with a minimum target of 20%+.

GALAUSDT: Long-Term Bullish Potential Despite Bitcoin DipGreetings, fellow traders,
This analysis presents a brief overview of GALAUSDT's current market position and potential for a long-term trade.
While the recent two-day uptrend of GALAUSDT has been influenced by Bitcoin's price fluctuations, the overall outlook remains positive for a long-term, long position. Despite the current dip, Gala demonstrates significant potential for growth. As indicated on the 4-hour chart, the price currently resides at the bottom of the ascending channel, which is a very good point to take a Long position, presenting a strong opportunity for an upward move.
I've identified three potential price targets for this long trade:
Target 1: $0.03610
Target 2: $0.03950
Target 3: $0.04100
BINANCE:GALAUSDT
These targets are based on the current chart.
Investors are encouraged to conduct their own due diligence and manage their risk accordingly.
Profitable trades to all!

GALAUSDT: Short Opportunity as Downtrend ConfirmedGreetings, Traders,
GALAUSDT has officially entered a downtrend, presenting a solid opportunity for short positions.
I recommend entering a short trade below the $0.03150 price zone.
Target 1: $0.03020
Target 2: $0.02910
A stop-loss order placed above $0.03250 could be considered to manage potential risk
Following the breakdown below the key support level, as seen in the daily chart, a short position is favored.
This is not financial advice. Please do your research before making any trading decisions.
Exercise proper risk management and set a stop-loss order according to your risk tolerance.
Profitable trades to all!

GALAUSDT 5DGALA Update ~ 5D
#GALA If you still have Conviction on this coin,. Buy gradually within this support block,. with a short term target of at least 20%++
GLong

GALAUSDTGALA ~ 1W
INDEX:GALA This is the support block that has been holding the price from falling lower.
If you still have Conviction on this coin. do the buying in stages here. With a minimum target of 20%++. This is a very good buy with lower risk

GALAUSDTGALA ~ 1W
#GALA Are you interested in this Coin? If yes, this is an important support block that you might need to pay attention to. previously the price bounced quite high from this support block. we hope this will happen again.

GALAUSDT 1WGALA ~ 1W
#GALA If the price revisits this support block, it might be a very good buy. at least for the short term.

GALAUSD 5DGALA ~ 5D
#GALA Make purchases gradually on this Support block. Aim for at least 15%+ from here.

GALAUSDT 1D analysis.Hello, friends!
This is ESS team.
LOOK this chart that we expect some.
After a BIG rise, GALA is making a berish extended wave.
The BLUE 5D uptrend line is where GALA needs to be supported in order to rise.
If this trend line is supported, and rise up,
and then, If the upper end of the extended wave is also retested after the breaking upward,
the GALA will fly once again.
Unfortunately, If the blue uptrend line is retested after breaking through due to the strong sell-power, it could drop to the bottom of the extended wave.

GALA showing good investment opportunityHi Everyone;
today we have a good reward Investment opportunity
it is more than 51 times the risk and the chart is look very promising.

GALAUSDTBINANCE:GALAUSDT Long idea
⛔"Daily crypto market analyses I provide are personal opinions & not financial advice. Trading carries risks, so do your own research & seek advisor's help. #DYOR
Don't forget to 🚀 and comment

Best zone for sell (GALA)❤️❤️Thanks for boosting 🚀 and supporting us!
📈I not strong break resistance with big body candle , best zone for sell.
📊 (-sell) : 0.0328
🔴 Stop Loss : 0.03622
🎯 Take Profit : 0.0262 - 0.0182
🔗 For more communication with us, In the footnote and send a message in TradingView.
👨🎓 Experience and Education: Our trading team has five years of experience in financial markets, especially cryptocurrencies.

GALAUSDTBINANCE:GALAUSDT Long idea
⛔"Daily crypto market analyses I provide are personal opinions & not financial advice. Trading carries risks, so do your own research & seek advisor's help.#DYOR"
Don't forget to like and comment

GALAUSDT UpdateIn my previous post about BINANCE:GALAUSDT , I predicted a 30% pump. I have attached that post here.
However, you can see that the price has reacted to the resistance and has not yet been able to break through it. However, GALA is still bullish for me, and there are two scenarios that could happen in this situation. This currency is waiting for the next move of BINANCE:BTCUSDT and will start its next move with Bitcoin, which can be bullish or bearish. Or, the next upward move will begin from the points I marked on the chart. Please note that there have not been such upward movements in the crypto market for several years, and many people think this is the end of the bullish market. However, anything is possible in a volatile market.

GALA target 0.274h time frame
-
GALA finished the 1st pumping wave(0.0125 ~ 0.022), and start retesting the demand zone. The demand zone is also on the same level of 0.382 Fibonacci Retracement. Further, MANA which is the GameFi field as GALA is going up to structural supply zone, so we can set up a trading plan that target is benchmarking to MANA.
TP: 0.025~0.028
SL: 0.0168
