SuperVerse Weekly Downside Target📉 CRYPTO:SUPERUSD continues to trade in a bearish sequence from the December 2024 peak, with further downside expected toward the $0.15–$0.10 zone in the coming months.
Price has already broken below the neckline of a head & shoulders structure, which projects an even lower target below $0.10.
Gamefi

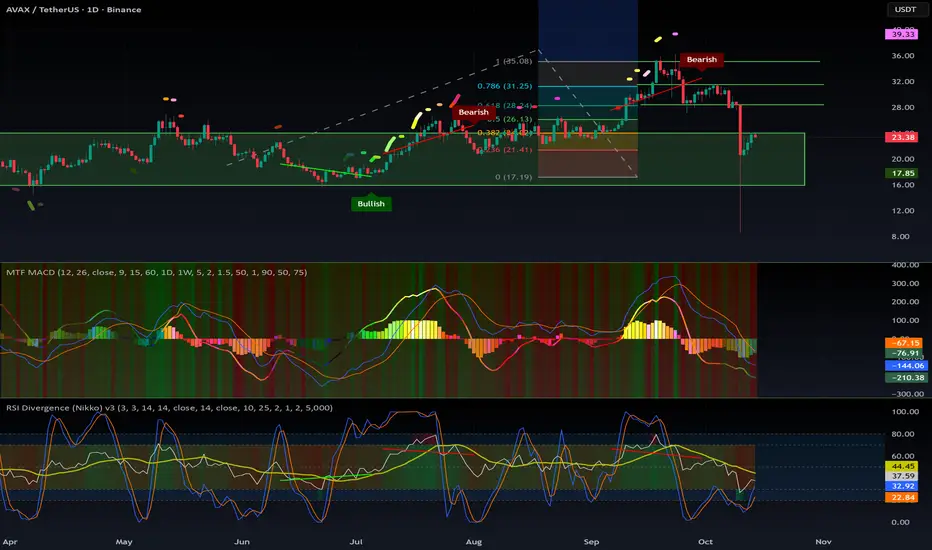
$AVAX: time to refill our bags!CRYPTOCAP:AVAX remains a solid project that’s not going anywhere. It’s now evolving into a game-oriented blockchain, which adds an interesting new use case to what was once a fairly mature ecosystem.
The current price range of $22–$23 sits in a strong demand zone, a level that has historically triggered major pumps.
With the Multi Timeframe MACD deeply oversold, the RSI low, and the Stochastic RSI bottomed out on the 1D, this looks like an excellent opportunity to build a position with a favorable risk/reward ratio.
It may take some time to fully clear the bearish divergence from the last rally, but the October 11th crash likely reset the structure — suggesting a bullish outlook moving forward.
Fibonacci targets:
🎯 TP1: $28.5
🎯 TP2: $31.4
🎯 TP3: $35.08
If the market enters a true altseason, CRYPTOCAP:AVAX could climb significantly higher — but for now, these are the most reasonable targets.
As always, DYOR before entering any trade.
#AVAX #CryptoAnalysis #Altcoins #TechnicalAnalysis #RSI #MACD #StochasticRSI #TradingSetup #Bullish #GameFi #Altseason #DYOR
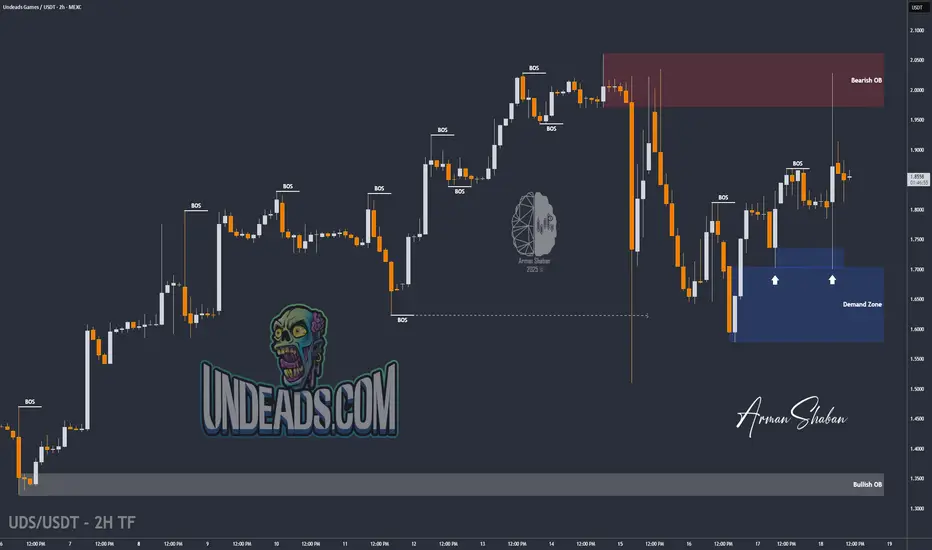
UDS/USDT | GameFi Token UDS Surges – Post-to-Earn Hype ContinuesIn the past two weeks, UDS (Undeads) has gained over 50%! UDS is a GameFi/Web3 project built on a metaverse economy, with staking and NFTs, and it uses a post-to-earn model to boost community engagement.
Looking at the 2-hour chart, we can see that yesterday the price surged by 19%, from $1.70 to $2.02, before correcting again. Right now, UDS is trading around $1.85. If the price can hold above the $1.78–$1.83 demand zone, we can expect more upside.
Keep in mind, this coin is highly volatile, so be cautious if trading it. The next bullish targets, if the rally continues, are $1.88, $1.91, and $1.97. This analysis will be updated again!
Please support me with your likes and comments to motivate me to share more analysis with you and share your opinion about the possible trend of this chart with me !
Best Regards , Arman Shaban
Superverse Is About to Make Someone Rich… and Wreck OthersSuperverse is sitting on a razor’s edge.
-If we can close above $0.4681, momentum opens the door to $1.19… and possibly the $1.80 range.
-But if price can’t hold $0.4681, then a drive down to $0.25 comes into play.
What makes this setup interesting is how compressed the risk/reward window is ;one close decides whether we see a 3–4x move higher… or a brutal halving.
Most traders will only react after the move. The real edge comes from knowing what to look for before it happens.
👉 I’m curious; if you had to choose, would you rather position for the upside breakout… or wait for the flush into $0.25?

GALA price analysis🪙 Please tell us, is the #GALA project still "alive"?
It's old, has gone through many cycles on the crypto market, and hasn't died yet.
Maybe now (being related to the CRYPTOCAP:ETH Ecosystem) is the best time to “come back to life”?
For this to happen, the price of OKX:GALAUSDT must finally:
1️⃣ confidently hold above $0.01390-0.01460
2️⃣ continue to grow confidently to $0.044
3️⃣ And finally, rapidly grow to $0.10-0.11 by the end of the year.
Is this a realistic scenario? Write your thoughts in the comments.

Pudgy Penguins PENGU Bullish Reversal Taking Shape🐧 Pudgy Penguins BINANCE:PENGUUSDT has bounced twice from the $0.009–$0.008 buying zone, showing resilience despite the choppy structure. As long as the June low holds, the setup favors a higher low formation next month, potentially setting the stage for the next impulsive leg higher.
Momentum is building — now it’s about follow-through and confirmation.

Is There Hope For BomBie ($BOMB)After a long awaited season, the Telegram P2E platform Bombie finally listed its native token on the TON blockchain called Bombie ($BOMB). However, this listing didn't take a favorable turn as the gamefi token on TON saw its value plummet by almost 95% currently trading at $0.00913.
Living us with a question. "Is There Still Hope for The Telegram P2E Token"?
With about 10 billion tokens created, and about 9 billion currently circulating, is the currecnt price metric fair enough? is there a burn mechanism? do the community have a say on the projects future? These and many more are questions raised by the community.
About Bombie
Bombie is a fast-paced, strategic mini-game available on Line DappPortal and Telegram, making it the first globally accessible dual-platform game. Players can compete and collaborate seamlessly across two of the world's largest instant messaging ecosystems, creating a unique gaming experience that fosters social interaction and competition.
Bombie Price Live Data
The Bombie price today is $0.000912 USD with a 24-hour trading volume of $43,731,178 USD. Bombie is down8.53% according to the 1-hour price chart. The current CoinMarketCap ranking is #1123, with a market cap of $8,080,209 USD.

Axie (AXS) Structure Analysis (1W - Log)After retesting the ~$2.0 demand zone, BINANCE:AXSUSDT broke out of its recent downtrend and could be headed for an attempt to reclaim the ~$4.0 S/R.
Key Levels to Watch
• ~$2.0: Demand zone dating back to May 2021, and current support. Any sustained break below it would invalidate any bullish TA.
• ~$4.0: Previous multi-year key support, and likely a strong resistance. Reclaiming it would flip the bias to bullish. It also aligns with the 200-day EMA, which has been very relevant for AXS in the past.
• ~$13.0: Multi-year S/R, and a reasonable target if ~$4.0 is reclaimed.
Still in a No-Trade Zone for me, until ~$4.0 is successfully reclaimed.

Phemex Analysis #72: Pro Tips for Trading FunToken (FUN)FunToken ( PHEMEX:FUNUSDT.P ) has surged in the crypto market, rising over 270% in the past month. This surge is attributed to its integration with the Binance Smart Chain (BSC) and the release of a roadmap that focuses on mobile gaming. Unlike many GameFi projects that prioritize web/desktop games, FUN is focusing on the mobile gaming sector, with plans to launch 40 mobile games featuring an "Earn-While-You-Play" mechanism. This strategic direction has generated significant market excitement regarding its growth potential.
Possible Scenarios
To provide a framework for trading FUN, let's explore potential scenarios based on technical analysis and market dynamics:
1. Bullish Breakout Continuation
If FUN sustains its upward momentum and breaks through key resistance levels with strong volume, it could signal a continuation of the bullish trend.
Pro Tips:
Identify key resistance levels, such as $0.85 and $0.89.
Consider entering a long position on a confirmed breakout above resistance with increasing volume and a high RSI (such as above 70).
Set a stop-loss order below the breakout point to manage risk.
2. Consolidation and Range Trading
After a significant price increase, FUN may enter a period of consolidation, trading within a defined range.
Pro Tips:
Identify key support ($0.006) and resistance levels ($0.009) that define the trading range.
Consider range-bound trading strategies, such as buying near support and selling near resistance; or consider using Phemex Grid Bots to capitalize on small price movements.
Remember to place stop-loss orders outside the range to prepare for potential breakouts or breakdowns.
3. Bearish Retracement.
A significant price surge is often followed by a retracement, especially as the broader market sentiment is currently bearish. If FUN fails to hold support levels ($0.006), it could experience a bearish retracement.
Pro Tips:
Monitor key support levels ($0.0064, $0.006).
Consider exiting long positions or reducing exposure if strong bearish signals appear.
Consider shorting opportunities on a break below key support, but exercise caution and manage risk carefully.
Conclusion
FUN Token's recent price action has demonstrated significant bullish momentum, driven by its strategic focus on the mobile gaming sector and its integration with the Binance Smart Chain. Traders should closely monitor price action, volume, and key support and resistance levels to identify potential trading opportunities. By considering various market scenarios and implementing appropriate risk management strategies, traders can navigate the volatility of the cryptocurrency market and capitalize on potential trends in FUN Token.
Tips:
🔥 Break free from "buy low, sell high"! Our new Pilot Contract empowers you to profit from ANY market direction on DEX coins with up to 3x leverage. Go long, go short, go further!
Check out Phemex - Pilot Contract today!
Disclaimer: This is NOT financial or investment advice. Please conduct your own research (DYOR). Phemex is not responsible, directly or indirectly, for any damage or loss incurred or claimed to be caused by or in association with the use of or reliance on any content, goods, or services mentioned in this article.

Tokenomics: How to avoid scams and fake projects?I've decided to write about the scams, Ponzi schemes, and fake projects in the crypto industry.
I'm a developer with 30+ years of experience in Web2, gaming (Unity, Unreal), and Web3. With this background, I can quickly spot fake projects riding a hot narrative that will never deliver or that mislead investors about their business model.
Meme Coins vs. Big Projects – Who's the Real Scam?
The common belief is that meme coins are scams. While some are, others have better tokenomics and fundamentals than major Layer 1 projects. On the other hand, big funded projects aren’t necessarily more honest—their scams are just more sophisticated, preying on investors' lack of technical knowledge.
Most Common Crypto Scams & Red Flags
1️⃣ Coins promising cheaper services using their own token 🚩
Many projects claim that using their token will make their services cheaper (e.g., Filecoin, Render). Why is this a scam?
If the coin succeeds and its price rises, then the service becomes more expensive—making it worse than the competition.
This contradicts their entire business model, proving it's unsustainable.
2️⃣ DeFi protocols without 1:1 backing 💰💀
Many bridges and lending protocols use their own token as collateral—this is a disaster waiting to happen (e.g., Thorchain, Thorswap).
As long as the token holds value, the system works.
But if FUD spreads, a bank run will wipe out liquidity and make the protocol insolvent—there’s no safety net.
3️⃣ Gaming projects claiming to use AI agents 🎮🤖 (It’s a lie!)
It is technically impossible to have AI-powered NPCs in a game at scale (e.g., Astra Nova).
AI agents require 12GB+ of VRAM per instance—you cannot have hundreds running in a game.
Many GameFi projects slap "AI" on their marketing because investors don’t know better.
🔍 How to spot a fake GameFi project:
No shadows on characters (e.g., BigTime, Valhalla) = outdated pre-2000s tech
"Arcade games" = nobody cares about them
League of Legends clones = LoL is 15+ years old!
Claims of 80+ devs = At EUROTLX:4K + per dev, that’s $380K/month in salaries—do the math!
Legit Meme Coins Can Be Better Than "Big Projects"
Example: CRYPTOCAP:PEPE 🐸
Despite being a meme, CRYPTOCAP:PEPE has better tokenomics than most of the top 200 projects.
✔️ No staking = No inflation (fixed supply, no endless token dilution).
✔️ No central ownership = No rug pulls (tokens distributed to the community).
✔️ Strong market makers (e.g., Wintermute).
✔️ No fake narrative—it’s just a meme, no BS.
✔️ Huge liquidity & low slippage on major exchanges.
Final Thoughts
🚫 Don’t judge a project by its marketing—check its fundamentals!
✅ Avoid inflationary projects
✅ Avoid projects with too many insiders
✅ Avoid narrative-based scams that sell you fairy tales
💡 Hope you found this post insightful!
DYOR! 🧐

TradeCityPro | AXS: Axie Infinity's Play to Earn Dynamics👋 Welcome to TradeCityPro!
In this analysis, I want to discuss the coin AXS, which belongs to the project Axie Infinity. This coin gained a lot of hype during the previous bull run as part of a Play to Earn game.
📅 Weekly Time Frame
In the weekly time frame, we see a very large and long-term range box where the price has been oscillating between 4.221 and 12.610 since late 2022.
🔍 The SMA 99 has even entered the range, indicating a severe ranging market. I do not recommend buying this coin as it has very high inflation, and the coin has a consumptive and reward aspect in the game, leading most users to sell the coin they earn, which is why it has not been able to break out of its range box yet.
🔽 If the price breaks below the support at 4.221, it will be very challenging for AXS as a sharp and heavy drop is very likely, and selling pressure will significantly increase. The only support area below this is at 1.355.
✅ If the price manages to break the resistance at 12.610, the potential for an uptrend increases. The next resistances are at 19.426 and 44.596. The major resistance near the ATH is at 161.591.
📅 Daily Time Frame
In the daily time frame, we can observe the price behavior in more detail. As you can see, there is a descending trend line that has been driving the price downward after reaching a high of 9.534, starting as a correction but turning into a downward movement due to the volume of sales.
🔽 If support at 5.439 is broken, it confirms the end of the uptrend, and the price will return to the box between 4.306 and 5.439. If support at 4.306 is broken, the situation will worsen for AXS as, as seen in the weekly frame, there is no significant support until 1.355.
🧩 Conversely, if the price can regain upward momentum and buying volume enters the market, we can expect the price to rise. The first significant trigger is the breaking of the descending trend line, which could introduce momentum into the market. Breaking above the 50 area in RSI could also assist in this upward movement.
📈The main trigger for a price increase is breaking through 7.366, a risky move, with primary buying triggers at the resistances of 9.534 and 12.610.
📝 Final Thoughts
This analysis reflects our opinions and is not financial advice.
Share your thoughts in the comments, and don’t forget to share this analysis with your friends! ❤️

GALA/USD 4H 100-200 sma cross impendingGala is about to experience a 100-200 sma cross on the 4 hour timeframe. This is also occuring as the coin attempts to break the down trend that has been in place since December 4th of last year. Gala is back to trading above its 50, 100 and 200 sma which is a good sign. RSI is 58 at time of publishing. Levels to watch are marked with green horizontal lines. The top most line is the 1.618 extension of the previous high swing low. Gala could gain as much as 12-30% in the coming days.
Not financial advice.
Do your own DD.
Thanks for viewing the idea.

TradeCityPro | MAGIC: Daily Dynamics and Key Resistance Reaction👋 Welcome to TradeCityPro!
In this analysis, I will examine the MAGIC coin. This project falls under the category of crypto gaming and is one of the major projects in this field.
📅 Daily Timeframe: Reaction to Key Resistance In the daily timeframe, the price recorded its main support floor at $0.2983 and was in the Accumulation phase up to $0.4085. With the breakout above this box, an upward movement began towards the $0.7101 area. The volume of this leg was increasing, showing convergence with the trend.
🔍 Upon reaching the $0.7101 resistance, the price initiated a corrective phase on its first contact, starting with a short-term correction but then extending into a deeper pullback to $0.4085, and now it is again building a new structure.
📊 As we approach the New Year, the market volume gradually decreases, and personally, in this situation, I prefer to hold fewer positions and wait for the volume to re-enter the market.
🔽 If the $0.4085 level breaks, the market momentum will completely reset, and the price will create a new structure for building a new trend. The most important support for MAGIC is the $0.2983 area, which is the historical floor of this coin and a very strong demand zone. Entry of the RSI into the oversell area will increase the likelihood of breaking this resistance.
📈 For a long position, the main trigger for now is $0.7101, and if the price stabilizes above this key area, the next resistance will be $0.9344, which is a minor resistance. The main chart resistance currently is at $1.4473. While not the ATH, it is a very strong supply zone, and the price will need significant bullish momentum to break through this area.
🧩 A risky trigger for a long position is $0.4694, where breaking this trigger presents a suitable early long position but raises the risk of the position higher and increases the likelihood of hitting a stop loss.
📝 Final Thoughts
This analysis reflects our opinions and is not financial advice.
Share your thoughts in the comments, and don’t forget to share this analysis with your friends! ❤️

HEROES OF MAVIA positioned for a great move. We have a solid foundation for bid support.
If you still have faith in the crypto gaming sector, low-risk opportunities could yield great rewards.

MemeFi: Bridging Gaming, Blockchain, and Growth PotentialMemeFi has rapidly established itself as a pioneering force in the Telegram mini-app space, seamlessly blending the fun of mobile gaming with the power of blockchain technology. With over 55 million users and 10 million on-chain wallets, the platform has transformed from a simple tap-to-earn game into a thriving ecosystem that merges entertainment with decentralized finance (DeFi).
Fundamental Strengths of MemeFi
At its core, MemeFi offers an engaging meme fantasy universe integrated into the Sui network. This strategic integration provides users with an accessible entry point into Web3, making it a standout project in the crypto-gaming space. The recent launch of the MemeFi Ads platform has added a revenue stream, boosting the platform's long-term sustainability and appeal to both users and advertisers.
Market Performance and Potential
Currently trading at approximately $0.01283, MemeFi ($MEMEFI) shows impressive resilience and market interest. Key metrics include:
- Market Cap: $125.7 million
- 24-hour Trading Volume: $569.8 million, reflecting a 14.3% increase
- All-Time High (ATH): $0.01376 (Nov 27, 2024)
- All-Time Low: $0.005246 (Nov 24, 2024)
This rapid rebound, with prices up 101.83% in the past 7 days, signals strong buying momentum and increasing investor confidence.
Technical Analysis
From a technical perspective, $MEMEFI is showing strong signs of bullish momentum. The token recently formed a bullish symmetrical triangle pattern, with a breakout point at the $0.014 pivot level. This zone represents the upper ceiling of the triangle, suggesting a potential surge toward its recent ATH of $0.01411.
Key Indicators:
Currently the RSI is at 60, indicating $MEMEFI still has room for upward movement without entering the overbought zone. Support Levels at $0.0108 provides a buy zone, with strong bullish sentiment above this level.
A confirmed breakout above $0.014 could pave the way for higher gains, potentially revisiting or surpassing its ATH.
Broader Market Influence
The overall bullish sentiment in the crypto market, particularly with Bitcoin ( CRYPTOCAP:BTC ) hovering between $90K and GETTEX:97K , further supports $MEMEFI's potential growth. If Bitcoin maintains its upward trajectory, MemeFi's performance could ride this wave, benefiting from increased capital flow into altcoins and meme tokens.
Conclusion
MemeFi's strong fundamentals, innovative approach, and promising technical setup position it as a compelling investment opportunity. With its expanding ecosystem and bullish market trends, $MEMEFI is not just a game—it’s a significant player in the evolving world of Web3 gaming and decentralized finance.

Gala 50-150 SMA cross impendingGala is currently experiencing a 50-150 simple moving average on the daily time frame. This is a bullish signal for the gamefi token that has already been rallying for the last recent week. RSI is about to leave nuetral territory at time of publishing. Targets are horizontal lines above taken from fib extensions of the previous high swing low.
Not financial advice. Do your own DD.
Thanks for viewing the idea.

Gala/USD weekly 50-100 sma cross bullish signalThe 50-100 cross is currently occuring for gala on the weekly timeframe. This is very bullish for the token because of the timeframe. RSI is nuetral around 47. Cross occured during downtrend and that downtrend in now clearly broken. A weekly close above the rising support will confirm this. Target is between 1.618 and 1.382 of previous high swing low.
Not financial advice. Do your own DD.
Thanks for viewing the idea.

$ATLAS - Wave 5 RallyCan see a clear 4 wave count & breakout of abcde correction.
Log scale 1hr tf. 265% move with the trend-based fib extension to the 1.618.
55m mcap gem, huge community and product game already listed on epic game store in beta. Recent update looks good, and they hired new marketing manager.

MYTH Volcano Moon ChartMythical Chain has huge growth potential and I feel it is massively undervalued. The chain has some of the best fundamentals and partnerships in the Gaming space and I expect this token to be catapulted to the $10 mark by the end of 2025.

(SUPER) superverseFrom the looks of this chart and the indicators I've placed onto the chart Superverse is clearing up from a rough break out. The indicators seem to tell the story there is a position within Superverse to which the price will hold and potentially improve away from such a rough break out.

Illuvium: GameFi or ScamFi?))) Chart looks good. Time will tell if there will be another dive or not. If this was the bottom, then we are in for a quick rise. RR 1:1000 lets go😂

SKALE #SKL is positioned nicely versus Ethereumright in accumulation zone
which was a previous launchpad for good gains versus #ETH
can it do it again?
Well odds favour YES
and you have a well defined area/level that if you see skale breakdown on this ratio you can abandon the trade.
But I believe Skale can go on a Run
Gasless Gaming blockchains are very much needed if #Crypto is to succeed in bringing millions of more people into this space.

IMX Analysis: Daily Review and Bitcoin Update🔍Let's dive into today's analysis. Today, we're focusing on the IMX coin, examining it in the daily timeframe. But before we get into that, as usual, let's review the daily Bitcoin analysis and provide an update on yesterday's analysis in the 1-hour timeframe.
👑 Bitcoin Analysis
1-Hour Timeframe
Bitcoin analysis is in the 1-hour timeframe. As mentioned yesterday, the market needs to establish a new structure. Given that today is Saturday and market volume is low, it is advisable not to open any positions today and tomorrow.
📈 After the recent drop, we saw a slight upward movement with very low volume, which appears to be a pullback to 64530, overlapping with the middle line of the descending channel. If selling volume enters the market simultaneously with a rejection from this area, despite it being Saturday, I might open my position with less risk. The target for this position could be the channel's bottom or 63343.
🔑 Breaking 44.53 can be a good confirmation for this risky short position.
⚠️ Currently, I don't have a trigger for a long position and won't open one until buying volume enters the market. If you want to open a long position, breaking 64530 could be suitable, but I don't recommend opening a position with this trigger, and I won't either.
🎮 IMX Analysis
🔫Overview
IMX operates in the field of crypto games, providing infrastructure for other projects. It allows both game creation and gameplay within its ecosystem, making it a comprehensive platform for enthusiasts of crypto games and play-to-earn models.
📅Daily Timeframe
Looking at the chart in the daily timeframe, the first thing that stands out is the head and shoulders pattern, with its trigger already activated. This pattern emerged from the coin's upward movement from 0.4915 to 3.6567, with the trigger appearing at the 0.382 level. Upon breaking this trigger, we can aim for the targets indicated in the chart.
🎯 The first target is the 1 Fibonacci extension point on the downside, overlapping with the 1.2463 support, forming a strong area. The second target is an extremely strong area for several reasons: it is the 1.618 Fibonacci extension point and one of the most important support levels for this coin. Additionally, it is the 0.786 Fibonacci retracement point and the first target of the head and shoulders pattern.
🔻 Currently, the trend for this coin appears bearish. Breaking 23.75 in RSI can introduce more downward momentum into the market. However, for a long or spot purchase, I'll wait until the price moves above the 1.7739 area and RSI breaks 39.60. Only then will I consider a long position.
📝 In summary, while the current market sentiment for both Bitcoin and IMX is bearish, careful observation of key levels and triggers can present potential trading opportunities. For Bitcoin, caution is advised with low market volume over the weekend. For IMX, the head and shoulders pattern indicates possible downward targets, but significant levels must be watched for potential reversal signals. Always wait for volume confirmation to avoid false moves and optimize your trading decisions.
