GAS Buy/Long Signals (4H)Price is currently trading at a major key level, which is an important area to watch for a potential reaction. A strong bullish CH has formed on the chart, indicating a clear shift in market sentiment. The overall price structure is supportive of buy/long positions, and as long as this structure remains intact, our primary focus is on looking for long opportunities within this setup.
There are two well-defined entry zones marked on the chart, and positions should be built using a DCA strategy to optimize entries and manage risk effectively.
targets:2.030$ _ 2.151$_ 2.24$
Once the first target is reached, it is recommended to move the position to break-even to protect capital and secure a risk-free trade.
If you would like us to analyze a coin or altcoin for you, first like this post, then comment the name of your altcoin below.
GASUSDT

GASNatural Gas
- Double Top as an corrective pattern in Long Time Frame
- Change of Characteristics
- RSI - Divergence
- Resistance Level
- Symmetrical Triangle in Short Time Frame

#GASUSDT #1D (ByBit) Falling broadening wedge breakout & retestNeoGas printed a golden cross on daily and a morning star at the same time, just like last year.
Also formed a triangle, seems likely to bounce on 200MA support then break bullish in the coming weeks.
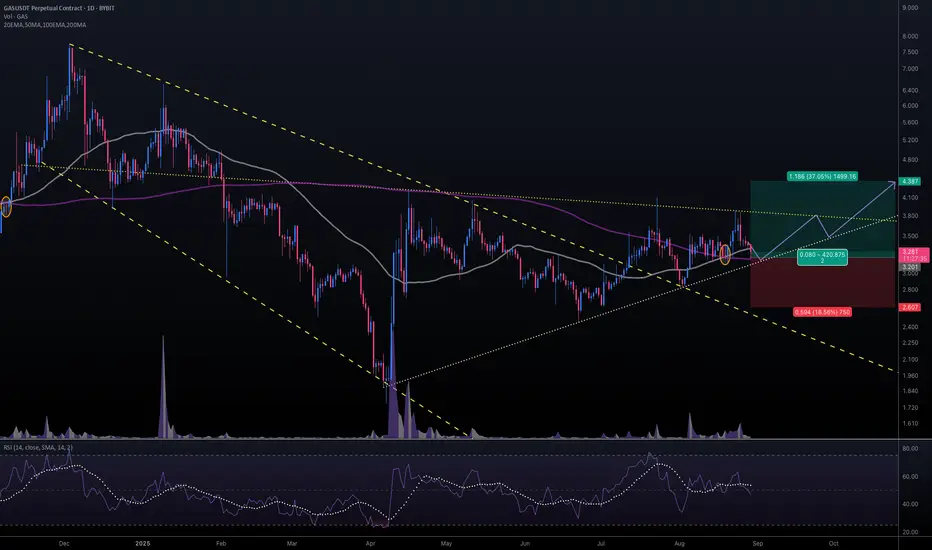
⚡️⚡️ #GAS/USDT ⚡️⚡️
Exchanges: ByBit USDT
Signal Type: Regular (Long)
Leverage: Isolated (2.0X)
Amount: 5.4%
Current Price:
3.281
Entry Targets:
1) 3.201
Take-Profit Targets:
1) 4.387
Stop Targets:
1) 2.607
Published By: @Zblaba
HOSE:GAS BYBIT:GASUSDT.P #1D #NeoGas #dBFT neo.org
Risk/Reward= 1:2.0
Expected Profit= +74.1%
Possible Loss= -37.1%
Estimated Gaintime= 1-2 months
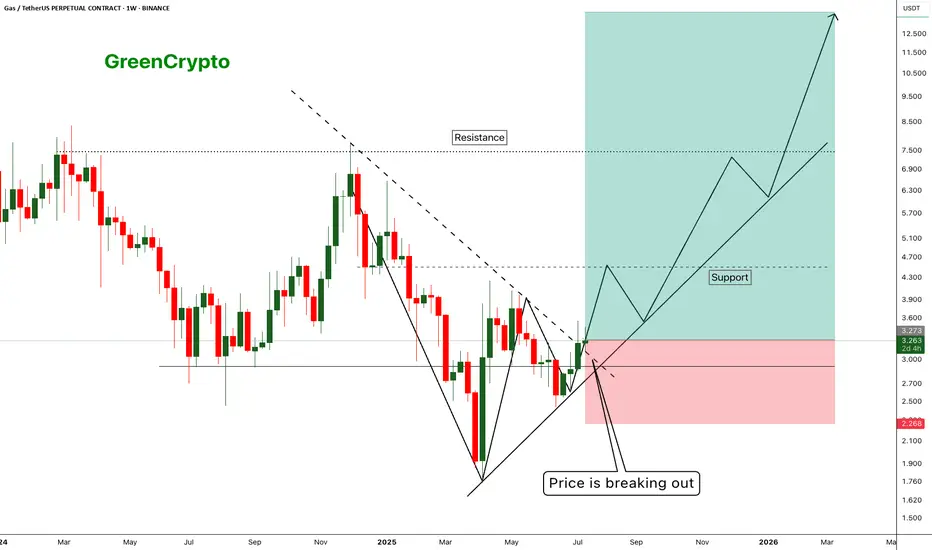
GAS - Huge Risk:Reward Trade 1:10 - Is there any Gas Left ?- Gas has finally managed to breakout from the resistance trendline and now trading just above the resistance
- I'm expecting this trend to continue along the support line shown in the chart.
Entry Price: 3.281
Stop Loss: 2.271
TP1: 3.944
TP2: 4.589
TP3: 6.775
TP4: 8.412
TP5: 13.512
Max Leverage 5x.
Don't forget to keep stoploss.
Support us by Liking and following.
Thanks and Cheers!
GreenCrypto
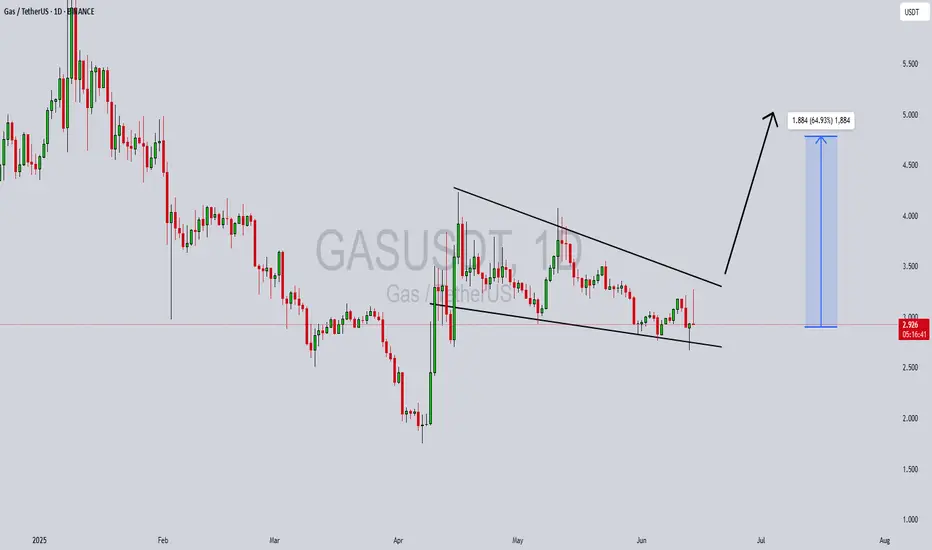
GASUSDT Forming Strong Bullish ReversalGASUSDT is currently presenting a classic falling wedge pattern, a historically strong bullish reversal signal in technical analysis. This structure often precedes significant upward breakouts, especially when accompanied by increasing volume — which we’re seeing here. The price action suggests accumulation is underway, and with investor sentiment turning optimistic, a move to the upside appears increasingly likely. The expected gain ranges from 10% to 50%, with solid risk-reward potential for swing traders and mid-term holders.
Volume analysis confirms a healthy increase in interest, which often precedes momentum-driven rallies in crypto pairs like GASUSDT. The falling wedge has formed after a sustained downtrend, and now with a breakout on the horizon, the bullish case is further supported. GAS, the utility token for the NEO blockchain, remains a key asset in smart contract execution, and renewed activity on the NEO network could add fundamental strength to this technical setup.
From a macro perspective, GASUSDT is gaining traction as investors look to capitalize on undervalued altcoins with real utility and strong development backing. The project’s underlying use case — fueling transactions and resources on the NEO blockchain — continues to hold relevance in the broader smart contract ecosystem. As blockchain infrastructure plays come back into focus, GAS may benefit from both a technical breakout and a fundamental narrative shift.
In summary, GASUSDT is aligning both technically and fundamentally for a bullish phase. The falling wedge breakout potential, rising volume, and ecosystem utility create a compelling opportunity for investors looking to gain exposure to a medium-cap crypto with solid upside potential.
✅ Show your support by hitting the like button and
✅ Leaving a comment below! (What is You opinion about this Coin)
Your feedback and engagement keep me inspired to share more insightful market analysis with you!
GASUSDT 1D Analysis GAS ~ 1D Analysis
#GAS Buy gradually after successfully breaking through this resistance line with a short-term target of at least 10%+.

#GAS/USDT#GAS
The price is moving within a descending channel on the 1-hour frame, adhering well to it, and is heading towards a strong breakout and retest.
We are experiencing a rebound from the lower boundary of the descending channel, which is support at 3.55.
We are experiencing a downtrend on the RSI indicator that is about to break and retest, supporting the upward trend.
We are looking for stability above the 100 Moving Average.
Entry price: 3.58
First target: 3.74
Second target: 3.83
Third target: 3.96

GAS/USDT Analysis – A Good Long Opportunity
This coin is approaching strong support.
Previously, we observed large player activity in the $3.20–$2.95 zone .
We’re considering a long position if the zone is tested and we see a buyer reaction.

NeoGas: The Altcoins Market Bull Market Is Here Pt.2The dynamics here are the same as with STRAXUSDT. A very strong bullish bias is developing. NeoGas is growing and has grown by 142% since 7-April. The bottom is in, this means that only higher prices are possible now and long-term. This is the meaning of the bottom, it cannot go any lower.
The pattern that came up as the bottom is the classic rounded bottom, it is very easy to spot on the chart. After the bottom was established, the action quickly followed to move above long-term support, which is above the July and August 2024 lows.
Trading volume is high. Signals are bullish all across. This is only the start.
The bottom is set and a bullish breakout takes place. This bullish breakout leads to the development of an uptrend. This uptrend can least 3 months just as it can last 6 months, 12 months, 18 months or more. It can for years for all we know.
Once the bottom is in... Leave a comment and follow.
The only place left to go now is up!
» The Altcoins market Bull Market is here, it is still early though. These pairs have the potential to grow by 1,000% or more.
Namaste.

GASUSDT (Gas) Updated till 09-01-25GASUSDT (Gas) Daily timeframe range. when most of the alts are down today its actually trying for a retrace back. which indicates good performance. it will be its second try at 6.115. breaking that clean can continue the push. recent support at 4.319.

Alikze »» GAS | Ascending channel - 1D🔍 Technical analysis: Ascending channel - 1W
After a climb up to the $30 range, the BINANCE:GASUSDT currency has faced a zigzag correction in the daily time frame, which has faced demand again in the $2.50 range.
- It is currently moving in an ascending channel with higher floors and ceilings.
💎 According to the current momentum, which is currently at the top of the short-term ascending channel.
- In case of selling pressure at the ceiling of the channel, it can face demand again in the middle of the channel or the green box area and an upward trend up to the ceiling of the second channel in the range of 8 to 10 dollars. go through
⚠️ In addition, if the golden box is broken, the bullish scenario will be invalidated and should be reviewed and updated again. ⚠️
»»»«««»»»«««»»»«««
Please support this idea with a LIKE and COMMENT if you find it useful and Click "Follow" on our profile if you'd like these trade ideas delivered straight to your email in the future.
Thanks for your continued support.
Best Regards,❤️
Alikze.
»»»«««»»»«««»»»«««

GASUSDT : New Direction AheadGASUSDT Technical analysis update.
GAS price has broken through the resistance zone with high volume after 120 days of ranging. With the price trading above the 100 EMA, we can expect a strong bullish move in GAS following a small retest.
Regards
Hexa

The Rise of Gas Crypto: Exploring NEO’s Hidden GemGas serves as the fuel for transactions on the NEO blockchain. It powers smart contracts, enabling developers to create decentralized applications seamlessly. Without Gas, these processes would come to a halt.
In September 2024, we will witness the expected outcome of the Gas crypto supply and demand analysis as the strong monthly demand level takes over. Currently, a significant reaction is taking place. This reaction has also allowed for short-term and intraday cryptocurrency trades using supply and demand strategies or other intraday strategies. This analysis is intended for long-term investments. This crypto will probably provide new trade opportunities using the smaller timeframes.

GAS/USDT For the Bullish move, need to breakout the supply area!💎 GAS has indeed garnered significant attention in the market. Currently, there is a possibility that GAS will undergo a retesting phase at the support area before resuming its upward movement to attempt a breakout of the supply area. It's noteworthy that GAS has consistently faced rejection upon reaching the supply zone.
💎 If GAS manages to successfully break above the supply area, it could trigger a bullish momentum, probability the price further upward toward our target area.
💎 However, if GAS fails once again to break above the supply zone, there's a likelihood of the price being rejected and retracing back towards the support area, or potentially even descending to the demand area.
💎 If GAS retraces to the demand area around $5.5, it is crucial for it to bounce from this level. Failure to do so could indicate a continuation of the downward movement for GAS, leading to further declines.

#GAS/USDT SPOT LONG ENTRY#GAS/USDT SPOT LONG ENTRY🍀
Leverage: 1x
Entries: $8.124
Take profit 1: $9.206
Take profit 2: $13.578
Take profit 3: $22.643
Stop Loss: $5.075
NOTE: This is just my prediction. Be sure to use STOPLOSS and remember that I am not a financial adviser. your money, your risk!
Thanks
The sroced.

GAS buy setupThe price had tried to form a bearish CH but failed to form a bearish CH with the body of the candlestick. (I mean on the chart where I put a line without a name)
A demand range is now formed. It is expected that the demand will move towards the targets from this range.
The targets are marked on the chart.
Closing a daily candle below the invalidation level will violate the analysis.
Note that the financial market is risky, so:
Do not enter any position without confirmation and trigger.
Do not enter a position without setting a stop.
Do not enter a position without capital management.
When we reach the first TP, save some profit and try to move the stop continuously in the direction of your profit.
If you have any comments please post them, comments will help us improve our performance
Thanks

GAS will hit its pedal again to accelerate its RISE again to 30!GAS went parabolic to reached 29.9 the last time and as any parabolic moves, a massive correction followed and the coin touched 7.3 down there which is massive in any scale.
Now, the heated short volatility has waned down. Net buyers / accumulators are back in the zone again based on the current 4h metrics.
Expect some significant ascend from here on -- with some huge movements, a characteristic of this coin.
A retest of its previous peak at 30.0 is not farfetched.
The RR ratio on this one is attractive -- and that's an understatement.
Spotted at 9.0
TAYOR.

GAS / GASUSDTGood Luck >>
• Warning •
Any deal I share does not mean that I am forcing you to enter into it, you enter in with your full risk, because I'll not gain any profits with you in the end.
The risk management of the position must comply with the stop loss.
(I am not sharing financial or investment advice, you should do your own research for your money.)

GASUSDT LONG IDEAhello everyone here i setup a long position as you see on chart. i believe gas refill this needle around 7 $. for this my stop level is 6.38 and my target around 7. my leverage is 50x. good luck!
entry 6.5
stop 6.38

GAS will explode soonFrom where we entered "START" on the chart, it looks like a correction has started.
Examining the waves, it looks like a diametric is over.
There is a nice support range on the chart, and by maintaining this range, GAS can be pumped to sweep the liquidity pools.
Closing a daily candle below the invalidatio level will violate the analysis.
For risk management, please don't forget stop loss and capital management
Comment if you have any questions
Thank You

GAS/USDT Nearing a Key Supply Zone with Potential for Action? 👀
💎Paradisers! Let's dive into the intriguing world of #GASUSDT as it navigates towards a crucial supply zone, signaling potential market moves.
💎 On its path, ASX:GAS is tracing a descending channel but now has its sights set on the supply level at $6.406. The real excitement kicks in if it crosses the $6.406 threshold, potentially propelling #GAS towards overcoming the bearish Order Block above.
💎 For the astute traders among us, should the upward momentum hesitate, look for a bullish resurgence from the support level at $5.494. Falling beneath this could steer us into bearish territory.

#GASIn 15 minutes, it is moving in a short-term upward channel, which is an upward correction of the previous wave. Therefore, if you can identify the continuation of the downward trend in the red box with the confirmation candle, you can enter the continuation of the sale transaction. After confirmation in the specified area, the sales transaction can be entered. Otherwise, the transaction will be canceled.

GAS will break new Level, SPOT HOLD🔥 Price on the 4H chart might come at these support areas and see the next history good entry for market at now 22/1/2024🔥
