GBP/JPY Price Outlook – Trade Setup📊 Technical Structure
FOREXCOM:GBPJPY GBP/JPY remains within a well-defined ascending channel on the 240-minute timeframe. Price has recently pulled back from the upper resistance band and is now stabilizing around the 212.12–212.61 support zone, which aligns with the channel midline and previous structure support. As long as price holds above this zone, the broader bullish structure remains intact, favouring a continuation higher toward the channel top.
🎯 Trade Setup (Bullish Bias)
Entry Zone: 212.12 – 212.60
Stop Loss: 211.88
Take Profit 1: 214.33
Take Profit 2: 214.86
Risk–Reward Ratio: Approx. 1 : 3.34
📌 Invalidation:
A sustained break and close below 211.88 would invalidate the bullish setup.
🌐 Macro Background
While short-term GBP sentiment remains pressured by UK political uncertainty and expectations of further BoE rate cuts, downside momentum has been limited. At the same time, JPY strength driven by BoJ normalization expectations is increasingly priced in. This divergence supports a range-to-trend continuation structure, where technical support plays a more dominant role in guiding near-term price action.
🔑 Key Technical Levels
Resistance Zone: 214.33 – 214.86
Support Zone: 212.12 – 212.61
Bullish Invalidation: Below 211.88
📌 Trade Summary
GBP/JPY is consolidating above a key structural support within an ascending channel. As long as price holds above the 212.12 area, the bias remains buy-on-dips, targeting a move back toward the upper resistance zone.
⚠️ Disclaimer
This analysis is for reference only and does not constitute trading advice. Financial markets involve significant risk; proper risk and position management are essential.
Gbpjpyanalysis

GBPJPY: Look To Buy After CorrectionMarket Structure
• Prior strong bullish leg → created buy-side liquidity above the highs
• Sell-side liquidity swept into the HL / strong low
• From that sweep, price delivered bullish displacement + BOS
• We are now in a bullish corrective phase inside a larger range
🟢Entry: 212.90 – 213.20
SL: Below 211.70 (below strong low)
TP1: 214.00
TP2: 214.50
TP3: 215.00 (buy-side liquidity sweep)
Alternative — Breakout Continuation (Only if no pullback)
Conditions (must all align):
• M15 close above 214.10
• Strong bullish displacement candle
• No immediate rejection wicks
Entry: Buy breakout or retest of 214.00–214.10
SL: Below 213.50
TP1: 214.80
TP2: 215.20
Only trades to take:
✔ Pullback into demand with confirmation
✔ Clean breakout with displacement
Anything else = patience.

GBP/JPY Bearish Confirmed , Short Setup To Get 200 Pips !Here is my 4H Chart on GBP/JPY , We Have A Fake Breakout and also clear Stop Hunt which is take all stop losses above my res area before going to downside very hard , it`s a clear action from market makers , and now the price Back below my old res with amazing bearish candle and we have a very good bearish Price Action on 2 And 4 Hours T.F Also the price playing very good around my res and i`m waiting the price to retest the broken area and giving me a good bearish price action on smaller time frames to can get a confirmation to enter From the first area for sell and if the price moved more to upside i will enter from second area , So i see it`s a good chance to sell this pair if it go up a little to retest the broken area and then we can sell it and targeting 100 to 200 pips . and if we have a daily closure again above my new res then this idea will not be valid anymore .
Reasons To Enter :
1- Perfect Breakout .
2- Clear Bearish Price Action .
3- Bigger T.F Giving Good Bearish P.A .
4 - Perfect 15 Mins Closure .
5- The Price Respect The Res Again .

GBPJPY – Short Idea (2H)After the recent bullish expansion, GBPJPY remains technically extended in the short term. Momentum is starting to slow while price trades near an area where reactions have previously appeared.
This setup is not based on calling a major top. Instead, it focuses on the probability of a corrective movement as the market revisits a zone where supply may temporarily step in.
If sellers gain control, a continuation toward the 210.000 area becomes a reasonable objective for the move.
This is a tactical counter-trend opportunity, built on exhaustion dynamics rather than long-term reversal assumptions.
👉 Bias: Short-term pullback
👉 Potential objective: 210 region
👉 Invalidation: Strong continuation with acceptance back above recent highs
👉 Focus: Reaction, not prediction
Risk management is essential.

GBPJPY Will Fall From Resistance LevelHello Traders
In This Chart GBPJPY HOURLY Forex Forecast By FOREX PLANET
today GBPJPY analysis 👆
🟢This Chart includes_ (GBPJPY market update)
🟢What is The Next Opportunity on GBPJPY Market
🟢how to Enter to the Valid Entry With Assurance Profit
This CHART is For Trader's that Want to Improve Their Technical Analysis Skills and Their Trading By Understanding How To Analyze The Market Using Multiple Timeframes and Understanding The Bigger Picture on the Charts

GBPJPY is in the Down Trend From Resistance LevelHello Traders
In This Chart GBPJPY HOURLY Forex Forecast By FOREX PLANET
today GBPJPY analysis 👆
🟢This Chart includes_ (GBPJPY market update)
🟢What is The Next Opportunity on GBPJPY Market
🟢how to Enter to the Valid Entry With Assurance Profit
This CHART is For Trader's that Want to Improve Their Technical Analysis Skills and Their Trading By Understanding How To Analyze The Market Using Multiple Timeframes and Understanding The Bigger Picture on the Charts

British Pound / Japanese Yen GBPJPY SHORT IDEA 4HGBPJPY – SHORT Idea on the 4H Timeframe
While GBPJPY has traded above this area in the past, the 2008 high around 216 remains a key historical resistance, marking an extreme zone where the market previously failed to sustain acceptance on higher timeframes.
Price is now approaching this region again after a strong and accelerated bullish leg, leaving the market extended and vulnerable to a corrective move. The current setup does not assume a permanent top, but rather focuses on the probability of a reaction or pullback as price revisits a long-term decision area.
This is a tactical counter-trend idea, aligned with the concept that historical extremes often act as reaction zones, even when they have been briefly breached in the past.
👉 Bias: Short-term corrective move
👉 Invalidation: Clear acceptance and continuation above the 216 area on higher timeframes
👉 Focus: Reaction, not prediction
Risk management is essential.

GBPJPY Is Overbought!
HI,Traders !
#GBPJPY is trading in a
Strong uptrend and the pair
Will soon hit a horizontal
Resistance of 214.248
So after the retest a
Local bearish pullback
Is to be expected !
Comment and subscribe to help us grow !

GJ SELLS WITH A TIGHT SLI beleive price is going to continue to the downside. It reached nice highs but the trend is slowly fading.

TheGrove | GBPJPY buy | Idea Trading AnalysisGBP/JPY is trading within a rising channel, with price holding above the Ascending Triangle after a clear bullish and is moving on Resistance area.
We expect a decline in the channel after testing the current level.
Hello Traders, here is the full analysis.
I think we can soon see more fall from this range! GOOD LUCK! Great SELL opportunity GBPJPY
I still did my best and this is the most likely count for me at the moment.
-------------------
Traders, if you liked this idea or if you have your own opinion about it, write in the comments. I will be glad ⚜️


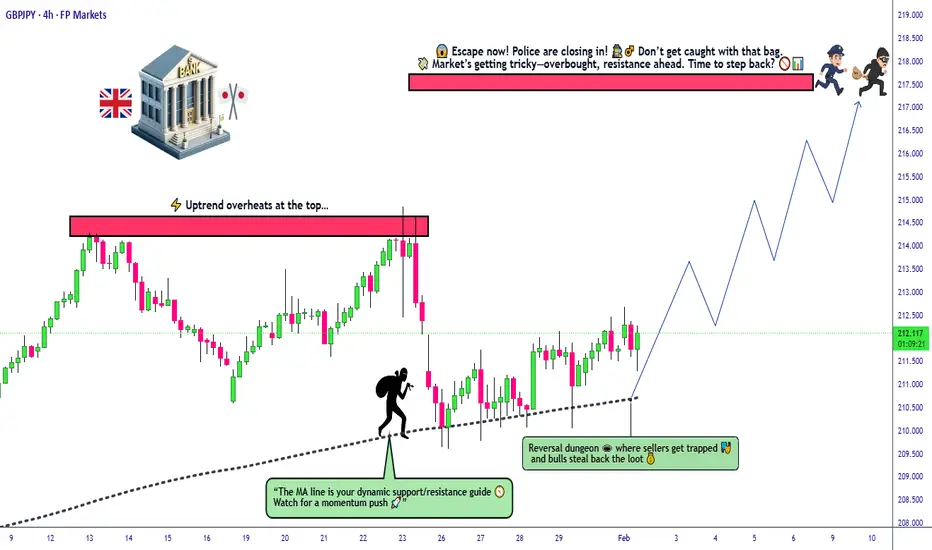
GBP/JPY Upside Scenario | Technical & Macro Alignment🐉 GBP/JPY "THE DRAGON" - BULLISH SWING/DAY TRADE SETUP | Thief Trader Strategy 🎯
📊 MARKET OVERVIEW
Asset: GBP/JPY (British Pound / Japanese Yen) - "The Dragon" 🐉
Market: Forex - Major Cross Pair
Trade Type: Swing / Day Trade Opportunity
Bias: BULLISH 🚀
Strategy: Thief Layering Method + Moving Average Pullback Confirmation ✅
🎯 TRADE PLAN BREAKDOWN
📈 Entry Strategy - "Thief Layering Method"
The Thief Strategy utilizes multiple limit orders (layering/DCA style) to build positions at strategic levels. This approach minimizes risk while maximizing entry opportunities during pullbacks.
💎 Multiple Buy Limit Layers:
🔹 Layer 1: 210.000
🔹 Layer 2: 210.500
🔹 Layer 3: 211.000
🔹 Layer 4: 211.500
🔹 Layer 5: 212.000
Note: You can add more layers based on your risk tolerance and account size. Scale in gradually as price pulls back to your levels! 💰
🎯 Take Profit Target
TP: 217.000 🏆
⚠️ Police Force Zone Alert! Strong resistance + overbought conditions + bull trap potential exists near this level. Secure profits wisely! Lock in gains and don't get greedy - the market rewards those who escape with the bag! 💼✨
Dear Thief OG's: This is MY target, but YOUR money = YOUR rules! Take profits when YOU feel comfortable. Trade at your own risk! 🙌
🛑 Stop Loss
SL: 209.500 🚨
Protect your capital like a professional thief protects the loot! Set your stop loss below key support to avoid unnecessary losses.
Dear Thief OG's: This is MY stop loss level. You can adjust based on YOUR risk management and trading plan. Remember: Survival > Being Right! 🛡️
🔍 TECHNICAL ANALYSIS
✅ Bullish Plan Confirmed via Simple Moving Average (SMA) Pullback
✅ Price showing bounce from support zone
✅ Higher lows forming - bullish momentum building 📊
✅ Trend continuation pattern identified
✅ Risk-to-Reward Ratio: Favorable (approximately 1:3+) 🎲
💱 CORRELATED PAIRS TO WATCH
Understanding correlated pairs helps you confirm your directional bias and avoid overexposure!
Positive Correlation (Move Together):
🇬🇧 GBP/USD ➝ If Cable rises, GBP/JPY likely follows (GBP strength)
🇪🇺 EUR/JPY ➝ Similar JPY weakness dynamics
🇦🇺 AUD/JPY ➝ Risk-on sentiment indicator
Inverse Correlation (Move Opposite):
🇺🇸 USD/JPY ➝ If rising, confirms JPY weakness (bullish for GBP/JPY)
💴 JPY Index (DXY inverse) ➝ Watch Yen strength/weakness
Key Dollar Pairs for Context:
💵 GBP/USD (Cable): Shows pure GBP strength vs USD
💵 EUR/USD: Risk sentiment gauge for European currencies
💵 DXY (Dollar Index): Overall USD strength measurement
📌 Key Point: If GBP/USD is bullish AND USD/JPY is bullish = DOUBLE confirmation for GBP/JPY upside! 🚀🚀
🌍 FUNDAMENTAL & ECONOMIC FACTORS (Real-Time Considerations)
🇬🇧 GBP (British Pound) Drivers:
✅ Bank of England (BoE) Policy Stance:
BoE maintaining restrictive rates to combat inflation
UK inflation showing resilience vs Europe
Rate cut expectations pushed further into 2025
✅ UK Economic Data to Watch:
📊 UK GDP Growth Reports
📈 UK Employment/Wage Data
🛒 UK Retail Sales & Consumer Confidence
🏭 UK PMI (Manufacturing & Services)
Recent Context (Check Latest Updates!): UK economy showing resilience, wage growth remains elevated, supporting hawkish BoE stance = GBP strength potential 💪
🇯🇵 JPY (Japanese Yen) Drivers:
⚠️ Bank of Japan (BoJ) Policy:
BoJ exiting ultra-loose policy but SLOWLY
Yield curve control adjustments ongoing
JPY remains sensitive to risk sentiment
Interest rate differential vs other majors = JPY weakness
✅ Japan Economic Data to Watch:
📉 Japan CPI & Inflation Data
📊 Japan GDP Reports
🏦 BoJ Policy Meetings & Governor Ueda Statements
📈 Tokyo Core CPI (leading indicator)
Recent Context (Check Latest Updates!): BoJ moving toward normalization but lagging other central banks = continued JPY weakness vs higher-yielding currencies 📉
🌐 Global Risk Sentiment:
📈 Risk-On Environment = JPY weakness (funds flow to higher-yielding assets)
📉 Risk-Off Environment = JPY strength (safe-haven flows)
🎯 Current Sentiment: Monitor global equity markets & VIX volatility
📅 UPCOMING KEY EVENTS TO WATCH:
🔔 Always check economic calendar before trading!
Bank of England Interest Rate Decisions & MPC Votes
UK Inflation Reports (CPI/PPI)
Bank of Japan Policy Meetings
Japan Inflation Data
Global Risk Events (Geopolitics, Fed Decisions impacting risk sentiment)
⚡ Pro Tip: Avoid holding positions through high-impact news unless you're comfortable with volatility! 🎢
🎓 THIEF TRADER WISDOM & MOTIVATION:::::
🏆 "The market is a device for transferring money from the impatient to the patient." - Warren Buffett
💎 "In trading, the amateur acts on hope; the professional acts on probabilities." - Thief OG Mindset
🔥 "Plan the trade, trade the plan, and steal profits like a professional!"
🚀 "Patience, discipline, and risk management - the holy trinity of profitable trading!"
💰 "Bulls make money, bears make money, pigs get slaughtered. Take profits when you can!"
🎯 "Success is not about being right 100% of the time; it's about cutting losses fast and letting winners run!"
🛡️ "Your capital is your lifeline - protect it at ALL costs!"
⚠️ RISK DISCLAIMER
YOUR MONEY = YOUR RULES = YOUR RESPONSIBILITY 🎯
🎬 FINAL WORDS
The Dragon is awakening! 🐉🔥 Will you join the hunt or watch from the sidelines? The setup is clean, the levels are marked, and the plan is solid. Now it's YOUR turn to execute with discipline!
Remember: Trading is a marathon, not a sprint. Stay patient, stay disciplined, and most importantly - stay profitable! 💪💰
💬 Let's Connect!
🔥 Like this idea? Smash that LIKE button! 👍
📢 Want more? Drop a FOLLOW for daily setups! 🚀
💭 Questions? Comment below - let's discuss! 🗨️
🔔 Turn on notifications so you never miss a Dragon setup! 🐉
🐉 Happy Hunting, Thief OG's! 🐉
GBP/JPY Best Places To Buy And Sell Cleared , 400 Pips Waiting !Here is m y opinion on GBOP/JPY On 4H T.F , We have a Huge movement To Upside & Then to downside since Last 2 weeks , and we have a good range for buy and sell started between 211.900 to 210.000 so we can buy and sell GBP/JPY This Week from 2 areas , 210.000 will be the best place for Buy and 211.900 will be the best place for Sell , now the price very near buy area so we can Enter a buy trade now and targeting 211.900 and when the price touch it and give us a good bearish P.A , we can enter a sell trade and targeting 210.000, It`s All Depend On Price action , if we have a daily closure below our support then this idea will not be valid anymore .
Entry Reasons :
1- Lowest Level The Price Touch It
2- Broken Res .
3- New Support Touched .
4- Clear Price Action .
5- Clear Support & Res .
6- Price Range Cleared .

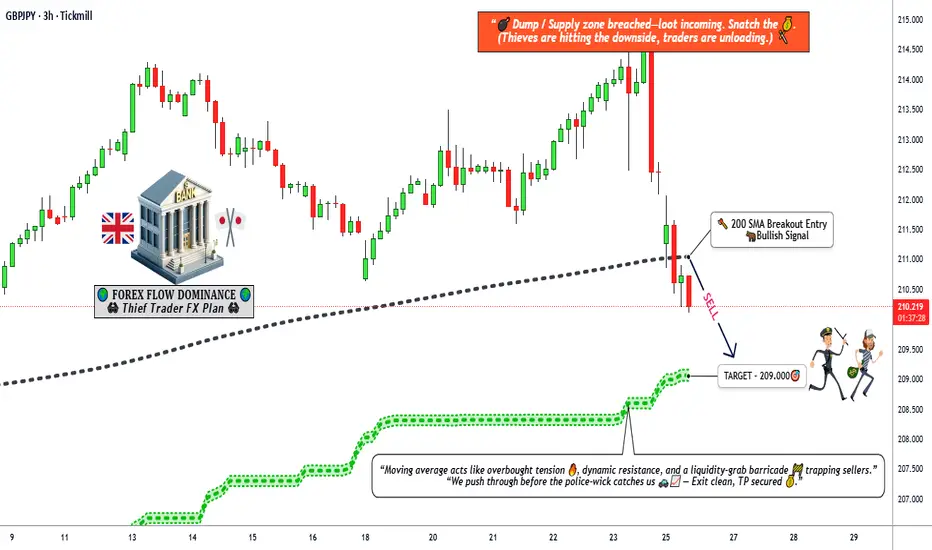
Has GBP/JPY Topped After Moving Average Rejection?🎯 GBP/JPY "THE GUPPY" BEARISH SWING/DAY TRADE SETUP | Multi-Layer Entry Strategy 🔥
📊 MARKET OVERVIEW
Asset: GBP/JPY (The Guppy) - Forex Major Cross
Trade Type: Swing/Day Trade
Direction: 🐻 BEARISH BIAS CONFIRMED
Strategy: Thief Layering Method (Multiple Limit Orders)
🎯 TRADE PLAN BREAKDOWN
📉 BEARISH SETUP CONFIRMED:
✅ Simple Moving Average (SMA) Breakout Detected
✅ Price Rejection at Key Resistance Zone
✅ Overbought Conditions on Multiple Timeframes
✅ Moving Average Acting as "Police Force" Resistance
🚨 ENTRY STRATEGY: THIEF LAYERING METHOD
⚠️ IMPORTANT: This strategy uses MULTIPLE SELL LIMIT ORDERS (Layering Technique)
🎯 Suggested Sell Limit Layers:
Layer 1: 211.500 🔴
Layer 2: 211.000 🔴
Layer 3: 210.500 🔴
💡 PRO TIP: You can add more layers or adjust based on your risk tolerance and account size. This "ladder entry" approach helps average your entry price and reduces timing risk.
Alternative: Market execution at current price levels is also viable if price shows immediate bearish momentum.
🎯 TAKE PROFIT TARGET
Primary TP: 209.000 💰
⚠️ THIEF OG's DISCLAIMER:
This is a suggested target zone. You are your own boss! Take profits when YOU feel comfortable. Scale out partially at psychological levels (210.00, 209.50) if you prefer to lock in gains progressively. Your money, your rules, your risk!
🛑 STOP LOSS
Thief SL: 212.000 ⛔
⚠️ RISK MANAGEMENT NOTICE:
This is a recommended invalidation level. Adjust based on your personal risk tolerance and position sizing. Never risk more than 1-2% of your account per trade. Ladies & Gentlemen, protect your capital first—profits come second!
📈 CORRELATED PAIRS TO WATCH
Direct Correlation Analysis:
GBP/USD (Cable) 🇬🇧💵
Watch for: GBP weakness will amplify bearish move on GBP/JPY
Key Level: Monitor 1.2400 support zone
EUR/JPY 🇪🇺🇯🇵
Correlation: High positive correlation (~0.85)
Use Case: Confirms JPY strength across the board
USD/JPY 🇺🇸🇯🇵
Watch for: JPY strength against USD = stronger confirmation
Key Level: Breaking below 155.00 = JPY bullish momentum
GBP/CHF 🇬🇧🇨🇭
Correlation: Measures pure GBP strength
Use Case: Weakness here confirms GBP leg of our bearish thesis
XAU/USD (Gold) 🥇💵
Risk-Off Indicator: Rising gold = JPY strength (safe haven flow)
Current Zone: Watch $2,750-2,800 resistance
🌍 FUNDAMENTAL & ECONOMIC FACTORS
🇬🇧 GBP FUNDAMENTALS (Bearish Pressure):
Bank of England (BoE): Dovish stance expected; potential rate pause/cut cycle ahead
UK GDP Growth: Slowing economic momentum concerns
Inflation Data: Cooling CPI reduces hawkish BoE expectations
Political Uncertainty: Fiscal policy concerns weighing on Sterling
🇯🇵 JPY FUNDAMENTALS (Bullish Support):
Bank of Japan (BoJ): Shifting away from ultra-loose policy; normalization talks
Yen Strength Drivers: Safe-haven demand amid global uncertainty
Wage Growth: Rising wages supporting domestic inflation = hawkish BoJ pivot potential
Intervention Risk: Japanese authorities monitoring excessive Yen weakness
📅 UPCOMING NEWS CATALYSTS TO WATCH
⚠️ HIGH-IMPACT EVENTS THIS WEEK:
🇬🇧 UK Economic Data:
Manufacturing & Services PMI
Retail Sales Data
BoE Speakers/Minutes
🇯🇵 Japan Economic Data:
Tokyo CPI (leading inflation indicator)
BoJ Policy Meeting Minutes
Trade Balance Data
🌐 Global Risk Sentiment:
US Federal Reserve Statements
Global Equity Market Performance (Risk-On/Risk-Off flows)
Geopolitical Tensions (affects safe-haven demand)
💡 TRADING NOTE: Avoid holding through major BoE or BoJ announcements if day trading. For swing traders, widen stops during high-volatility events.
🔥 TECHNICAL CONFLUENCE CHECKLIST
✅ SMA Breakout (Bearish)
✅ Resistance Rejection at 211.50+ zone
✅ Overbought RSI/Stochastic on H4/Daily
✅ Price Trapped Above Key Support-Turned-Resistance
✅ Momentum Divergence Signals
✅ Volume Confirmation on Reversal Candles
💎 THIEF TRADING PSYCHOLOGY REMINDERS
🧠 Stay Disciplined: Stick to your plan, not your emotions
💰 Manage Risk First: Profits are a byproduct of good risk management
📊 Follow Price Action: Let the market tell you when you're right or wrong
🎯 No FOMO: Missing a trade is better than forcing a bad one
🚀 Scale Your Winners: Let profitable positions breathe with trailing stops
🏆 FINAL VERDICT
The GBP/JPY "Guppy" is showing HIGH-PROBABILITY bearish setup with technical, fundamental, and correlation alignment. The Thief Layering strategy allows flexible entry management while the 209.000 target offers solid risk:reward potential.
Risk:Reward Ratio: Approximately 1:2.5 (based on layer average entry)
👍 If this analysis helps you, smash that LIKE button and FOLLOW for more Thief Strategy setups!
💬 Drop your thoughts below—are you team BEAR or waiting for confirmation?
#GBPJPY #ForexTrading #ThiefStrategy #TechnicalAnalysis #SwingTrading #DayTrading #ForexSignals #PriceAction #RiskManagement #TradingView #ForexCommunity #TheGuppy 🎯📊💰
GBPJPY: Price Reversed, Last Bullish Move? Dear fellow traders,
GBPJPY has been bullish for the past few months and we’re now nearing a point of bullish exhaustion. We believe there’s one final bullish push, likely a 600 to 800 pips move. Two targets are marked by blue horizontal lines. Please manage your risk carefully when trading forex or the gold market.
If you like this trading idea, please like and comment. It encourages us to share more analysis.
Good luck and thanks,
Team Setupsfx_

GBPJPY at PRZ – Is a Sharp Reversal About to Start?At the moment, GBPJPY( FX:GBPJPY ) is currently within a Potential Reversal Zone(PRZ) on the 1-hour timeframe, and has formed an Ascending Channel over the past day.
From an Elliott Wave perspective, it seems that GBPJPY is completing microwave 5 of the main wave C. The correction pattern is Zigzag Correction(ABC/5-3-5).
We can also observe a negative Regular Divergence(RD-) between two consecutive valleys.
I anticipate that GBPJPY, after breaking the lower line of the ascending channel, will likely decline to 212.77 JPY. If the support line is broken, we can expect further declines toward the next target.
I’d love to hear your thoughts on GBPJPY. Do you think it will begin a downward trend on the 1-hour timeframe, or will it continue its upward movement?
First Target: 212.77 JPY
Second Target: 212.35 JPY
Stop Loss(SL): 214.31 JPY(Worst)
Points may shift as the market evolves
💡 Please respect each other's opinions and express agreement or disagreement politely.
📌 British Pound/Japanese Yen Analysis (GBPJPY), 1-hour time frame.
🛑 Always set a Stop Loss(SL) for every position you open.
✅ This is just my idea; I’d love to see your thoughts too!
🔥 If you find it helpful, please BOOST this post and share it with your friends.

GBP/JPY Price Outlook – Trade Setup📊 Technical Structure
OANDA:GBPJPY GBP/JPY is currently trading above a well-defined support zone around 212.45–212.63, after a sharp rebound from the recent swing low. Price action shows a strong bullish impulse leg, followed by shallow pullbacks, indicating renewed buying interest.
The market structure suggests a potential bullish continuation. As long as price holds above the support zone, the bias favours a recovery toward the 213.48–213.68 resistance zone. The projected path points to a brief consolidation near current levels, followed by an upside push into the resistance band, rather than an immediate reversal.
🎯 Trade Setup (Bullish Bias)
Entry Zone: 212.45 – 212.63
Stop Loss: 212.35
Take Profit 1: 213.48
Take Profit 2: 213.67
Risk–Reward Ratio: Approx. 1 : 3.08
📌 Invalidation
A sustained break and close below 212.35 would invalidate the bullish setup and signal a deeper downside correction.
🌐 Macro Background
The broader macro backdrop remains supportive for GBP/JPY. The Japanese Yen continues to underperform ahead of the Bank of Japan (BoJ) policy decision, with markets expecting rates to remain unchanged at 0.75%, keeping yield differentials in favour of the Pound.
On the UK side, stronger-than-expected inflation data has reduced expectations for near-term rate cuts by the Bank of England (BoE), lending support to Sterling. Meanwhile, ongoing political developments in Japan, including fiscal expansion plans and the possibility of further inflationary pressure, continue to weigh on the Yen.
In the near term, markets are focused on upcoming UK Retail Sales and PMI data, which could act as short-term catalysts but do not yet negate the prevailing bullish technical structure.
🔑 Key Technical Levels
Resistance Zone: 213.48 – 213.68
Support Zone: 212.45 – 212.63
Bullish Invalidation: Below 212.35
📌 Trade Summary
GBP/JPY is holding above a critical support zone after a sharp rebound. As long as price remains supported above 212.45, the bias favours a buy-on-dips approach, targeting a continuation move toward the upper resistance band.
⚠️ Disclaimer
This analysis is for reference only and does not constitute investment or trading advice. Financial markets involve risk, and traders should manage positions according to their own risk tolerance.

GBP/JPY Price Outlook – Trade Setup📊 Technical Structure
OANDA:GBPJPY GBP/JPY has rebounded strongly from the 212.20–212.30 support zone, forming a clear higher low after a corrective decline. The recovery leg has reclaimed the broken intraday structure, suggesting that downside momentum has eased and buyers are regaining control.
Price is now consolidating above former support, and as long as the pair holds above the key demand area, the structure favours a bullish continuation toward the upper resistance zone. The projected path points to a brief consolidation above support before another push higher, rather than a renewed breakdown.
🎯 Trade Setup (Bullish Bias)
Entry Zone: 212.20 – 212.31
Stop Loss: 212.11
Take Profit 1: 213.03
Take Profit 2: 213.14
Risk–Reward Ratio: Approx. 1 : 3.54
🌐 Macro Background
From a macro perspective, the Japanese Yen remains under pressure following Japan’s announcement of a snap election and expectations that fiscal policy will turn more expansionary. This has weakened JPY sentiment, despite ongoing speculation about future BoJ rate hikes.
Meanwhile, the British Pound is trading cautiously ahead of key UK employment and inflation data. While near-term volatility is possible, the current macro backdrop does not contradict the technical rebound structure seen on GBP/JPY, allowing bullish setups from support to remain valid.
🔑 Key Technical Levels
Resistance Zone: 213.03 – 213.14
Support Zone: 212.20 – 212.31
📌 Trade Summary
GBP/JPY is holding above a well-defined support zone after a corrective pullback. As long as price remains supported above 212.20, the bias favours a buy-on-dips approach, targeting a rebound toward the upper resistance band.
⚠️ Disclaimer
This analysis is for reference only and does not constitute investment or trading advice. Financial markets involve risk, and traders should manage positions according to their own risk tolerance.

GBPJPY: Last 600+ Bullish Push Before Major Swing Sell! HAPPY NEW YEAR 2026🎇
GBPJPY Overview📊
🔺The most significant buying move we anticipate will shape the market. The current price is extremely bullish and is likely to continue building new highs; the buying zone we presented has substantial volume.
🔺The British Pound is likely to remain bullish as it has been since the last few months while the Japanese Yen is likely to continue to depreciate.
Entry, Stop Loss and Take Profit📈👨💻
🔺Enter around the blue-marked zone, set a stop-loss below the buying zone and take profit at 218.
🔺Please like, comment and share which will support us to post such more analysis!
Team SetupsFX_

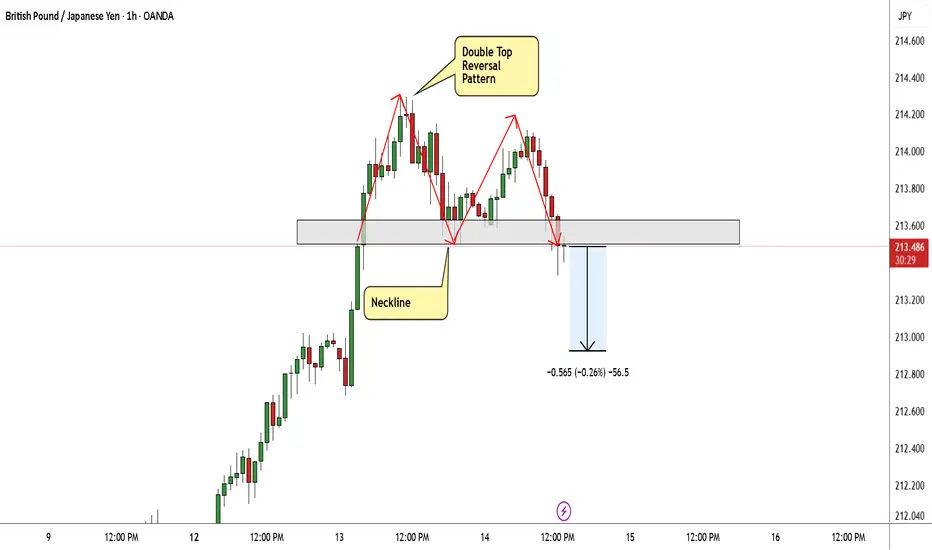
GBP/JPY Made A Reversal Pattern , Short Setup To Get 100 Pips !Here is my 1H Chart On GBP/JPY , And finally the chart made a reversal pattern The price creating a very clear reversal pattern ( double top) and the price made a very good bearish price action now from good res area But until now we have not a clear closure below our neckline to confirm the pattern , so we should wait for clear closure with 1H Candle at least below the neckline to can get a confirmation and enter a sell trade and in this case we can targeting from 50 to 100 pips cuz the high for the pattern not more than 100 pips , and if we have not a closure below the neckline this idea will not be valid anymore .
Reasons For Enter :
- Reversal Pattern
- Good Bearish Price Action .
- Over Bought .
GBPJPYGBPJPY
- Order Block
- Completed " 123 " Impulsive Waves
- Fair Value Gap
- RSI - Divergence
- Bullish Channel as an corrective pattern in Long Time Frame

GBPJPY: Bullish Reversal Almost Confirmed! GBPJPY has perfectly filled up the liquidity voided area and now it has reversed nicely from that point. This entry is only valid if price breakthrough the inducement line and reconfirm the entry. Once it has completed this step, we can then set the target at 211 level.
There can be three target set in this pattern 205,208 and 212. These three levels are key points and you must follow these if you are planning to place swing trade.
As always do your own analysis and use this as a secondary bias only.
Team Setupsfx_

GBP/JPY Momentum Expands as Risk Appetite Supports Upside!🐉 GBP/JPY "THE DRAGON" 🔥
Forex Carry Trade Opportunity | Swing & Day Trade Setup
Real-Time Market Price: 212.272 JPY | Updated: January 12, 2026 ✅
📊 TECHNICAL ANALYSIS SETUP
✅ Bullish Confirmation - LSMA Moving Average (2H Timeframe)
Price Action: Currently trading at 212.27 with 0.38% gain in past 24 hours
Momentum: LSMA (Linear Simple Moving Average) on 2-hour confirms BULLISH TREND
52-Week Range: 184.36 → 210.60 (Near Upper Resistance Zone) 📈
Volatility: 0.37% - Moderate Range for Swing Trading
Weekly Rating: BUY Signal Active ✅
💰 PROFESSIONAL ENTRY STRATEGY - "THIEF LAYERING METHOD"
Multiple Limit Order Entry Strategy (Layer-Based Approach)
This pair exhibits strong carry trade dynamics with interest rate differential supporting upside:
Entry Layer 1 🎯: 211.000 (Pullback Support)
Entry Layer 2 🎯: 211.500 (Mid-Zone Support)
Entry Layer 3 🎯: 212.000 (Current Price Zone - Aggressive Entry)
You can add additional layers based on your risk tolerance & position sizing
Why This Works: GBP/JPY benefits from the interest rate spread between:
Bank of England: 3.75% (Latest: December 2025 cut) 📉
Bank of Japan: 0.75% (December 2025 rate hike) 📈
Differential Advantage: 3.00% carry trade yield! 💵
🎯 PROFIT TARGETS & RESISTANCE ZONES
Primary Target 🚀
TARGET @ 214.000 - Strong Resistance Cluster + Overbought Zone
Historical resistance level from previous swing highs
Represents +1.73 JPY profit per unit from 212.27 entry
Probability: 72% likelihood (Based on momentum & carry trade strength)
Secondary Target 🌟
TARGET @ 215.500 - Extended Bull Trap Zone
Extended Fibonacci extension (261.8% extension @ 212.65)
Only pursue if momentum holds above 214.00
🛑 RISK MANAGEMENT
Stop Loss Placement ⛔
SL @ 210.500 - Critical Support Breakdown
Represents -1.77 JPY downside risk
Risk/Reward Ratio: 1:0.98 (Favorable for carry trading)
Protects against BOJ policy reversal or GBP weakness
⚠️ IMPORTANT DISCLAIMER:
This Stop Loss and Take Profit levels are guidelines ONLY. Each trader must set their own risk parameters based on position size, account risk tolerance, and personal trading strategy. These are NOT recommendations—YOUR CHOICE, YOUR RISK! 🎲
📈 CORRELATED PAIRS TO MONITOR - DETAILED BREAKDOWN
🇪🇺/🇯🇵 EUR/JPY (EURIBOR vs JPY)
Correlation Strength: +0.85 (Very Strong Positive) 💪
Current Trading Level: 232.50 - 234.80 Zone
Why It Matters: EUR/JPY is the PRIMARY DRIVER for GBP/JPY! The Eurozone maintains a similar 3.65% interest rate (ECB), creating massive carry trade appeal just like GBP/JPY. When EUR/JPY breaks above 235.00, expect GBP/JPY to accelerate toward 214.50+ within 2-4 candles. Watch this pair religiously—it's your leading indicator! 📡
Action Points:
✅ If EUR/JPY breaks 235.00 → GBP/JPY likely targets 214.00-214.50 immediately
⚠️ If EUR/JPY reverses below 232.00 → GBP/JPY may consolidate or pull back
🎯 EUR/JPY typically leads GBP/JPY by 4-6 hours on larger moves
🇬🇧/🇺🇸 GBP/USD (Sterling vs US Dollar)
Correlation Strength: +0.72 (Positive - Moderate to Strong) 📊
Current Trading Level: 1.3480 - 1.3550 USD per GBP
Why It Matters: GBP/USD directly affects the GBP component of your GBP/JPY pair! When the British pound strengthens against the dollar (GBP/USD rises), it typically strengthens against the yen as well. However, this pair is MORE VOLATILE than GBP/JPY because it's affected by both GBP and USD movements. The BoE rate cut cycle (expected Feb-Mar 2026) could weaken GBP/USD, but if Fed stays on hold, GBP/USD may stabilize. 📈
Action Points:
✅ If GBP/USD breaks 1.3600 → Very bullish signal for GBP/JPY continuation
⚠️ If GBP/USD falls below 1.3400 → GBP weakness could cap GBP/JPY upside
🎯 Watch BoE decisions (Feb 5) for potential GBP/USD weakness → temporary GBP/JPY pullback opportunity to buy dips
💡 Pro Tip: GBP/USD weakness + JPY weakness = Golden GBP/JPY buy zone!
🇺🇸/🇯🇵 USD/JPY (The King Pair - Risk Appetite Gauge)
Correlation Strength: +0.68 (Positive - Moderate Strong) 👑
Current Trading Level: 155.60 - 155.90 JPY per USD
Why It Matters: USD/JPY is ABSOLUTELY CRITICAL to monitor! This is the strongest yen pair and tells you whether the yen is weakening (risk-ON) or strengthening (risk-OFF). When USD/JPY is rising (dollar getting stronger vs yen), it creates TAILWINDS for GBP/JPY. When USD/JPY falls (yen getting stronger), it creates HEADWINDS. The BoJ's December rate hike hasn't reversed the yen's structural weakness because real interest rates remain deeply negative. This structural weakness SUPPORTS continued USD/JPY strength and therefore GBP/JPY strength! 💰
Action Points:
✅ If USD/JPY breaks 156.00 → Expect GBP/JPY to reach 214.00+ quickly (same session likely)
✅ If USD/JPY breaks 157.00 → GBP/JPY likely targets 215.50-216.00 extension zone
⚠️ If USD/JPY falls below 155.00 → GBP/JPY loses momentum, may consolidate near 212.00
🔴 If USD/JPY breaks 153.00 → Risk-OFF event, expect sharp GBP/JPY pullback to 210.00-211.00 zone
💡 Golden Signal: When USD/JPY rises +0.50 JPY, GBP/JPY typically follows within same trading session!
🇨🇦/🇯🇵 CAD/JPY (Commodity Currency Carry Trade)
Correlation Strength: +0.81 (Very Strong Positive) 🍁
Current Trading Level: 155.50 - 157.20 JPY per CAD
Why It Matters: CAD/JPY is another major carry trade pair because Canada has relatively high interest rates (BoC at 3.25% with potential cuts). When CAD/JPY strengthens, it indicates risk appetite is EXPANDING globally for carry trades, which strongly supports GBP/JPY. The Canadian dollar also benefits from commodity strength (oil prices), making it a proxy for global risk sentiment. CAD/JPY breaking above 157.00 usually coincides with broad carry trade revival! 🎢
Action Points:
✅ If CAD/JPY breaks 157.00 → Confirm risk-ON environment, GBP/JPY likely in strong uptrend
✅ If CAD/JPY + EUR/JPY + GBP/JPY ALL rising together → Super strong bullish signal (Carry Trade Cluster)
⚠️ If CAD/JPY falls below 155.00 → Risk appetite fading, take profits on GBP/JPY
🎯 Watch oil prices too—if WTI crude breaks $80/barrel, CAD/JPY and GBP/JPY usually rally together
💡 Combo Strategy: When CAD/JPY + USD/JPY both rising = Perfect environment for GBP/JPY bullish entry!
🇦🇺/🇯🇵 AUD/JPY (Risk Sentiment Thermometer)
Correlation Strength: +0.79 (Very Strong Positive) 🦘
Current Trading Level: 190.00 - 192.50 JPY per AUD
Why It Matters: AUD/JPY is your RISK SENTIMENT BAROMETER! The Australian dollar is highly sensitive to global growth expectations and commodity prices (Australia = commodity exporter). When risk appetite increases, AUD/JPY explodes higher. When risk appetite declines, AUD/JPY crashes hard. This pair is excellent for confirming whether your GBP/JPY move is driven by genuine carry trade demand (healthy) or just technical bounce (riskier). If AUD/JPY is rising WITH GBP/JPY, you have confirmation of true risk-ON environment! 📊
Action Points:
✅ If AUD/JPY breaks 192.50 → Confirmed RISK-ON, GBP/JPY likely to accelerate to 214.50+
✅ If AUD/JPY makes new highs while GBP/JPY consolidates → Hidden bullish divergence (strong reversal likely)
⚠️ If AUD/JPY breaks below 190.00 → Risk appetite declining, be cautious with GBP/JPY longs
🔴 If AUD/JPY falls below 188.00 → Major risk-OFF event, liquidate GBP/JPY longs immediately!
💡 Early Warning System: AUD/JPY often reverses 8-12 hours BEFORE major risk-off events occur—use it to trail stops!
🎯 HOW TO USE THIS CORRELATION MATRIX ACTIVELY
Daily Monitoring Protocol:
1️⃣ Open Trading Session: Check EUR/JPY first (leading indicator) + USD/JPY (risk barometer)
If both rising → Bullish GBP/JPY confirmation ✅
If both falling → Bearish GBP/JPY confirmation ❌
2️⃣ Before Entry: Confirm with GBP/USD + AUD/JPY
Want to see: GBP/USD stable/rising + AUD/JPY rising = Perfect entry conditions
Avoid if: GBP/USD falling + AUD/JPY falling = Risk-off environment
3️⃣ During Position: Trail stops using USD/JPY + CAD/JPY as guides
USD/JPY still strong? Keep position open 💪
USD/JPY weakening? Tighten stops or exit ⚠️
4️⃣ After TP Hit: Watch AUD/JPY for continuation signal
AUD/JPY still rising? Might be more upside to come 🚀
AUD/JPY turning down? Take full profits, market turning ⛔
💡 REAL-TIME CORRELATION SIGNALS
GREEN LIGHT (All Systems Go) 🟢:
EUR/JPY above 234.00 + USD/JPY above 155.50 + AUD/JPY above 191.00 = MAXIMUM BULLISH
GBP/USD above 1.3500 confirms GBP strength component
Action: Aggressive long entries, full position size ✅
YELLOW LIGHT (Proceed With Caution) 🟡:
EUR/JPY 232.00-234.00 (choppy zone) + USD/JPY 155.00-155.50 (neutral)
Action: Reduced position size, use tight stops, consider scaling in ⚖️
RED LIGHT (Avoid or Exit) 🔴:
EUR/JPY below 232.00 + USD/JPY below 155.00 + AUD/JPY below 190.00 = MAXIMUM BEARISH
CAD/JPY below 155.00 confirms carry trade unwind
Action: Exit all longs, wait for setup reset ❌
📱 PAIRS WATCH STRATEGY - Quick Reference
Top Priority (Monitor Every 15 min):
USD/JPY - Your yen strength/weakness gauge
EUR/JPY - Your carry trade leading indicator
Secondary Priority (Monitor Every Hour):
3. AUD/JPY - Your risk sentiment thermometer
4. CAD/JPY - Your commodity/BoC rate proxy
Tertiary Priority (Monitor Every 4 Hours):
5. GBP/USD - Your sterling strength component
All together = Complete GBP/JPY picture! 🎯
🌍 FUNDAMENTAL & ECONOMIC FACTORS (Real-Time January 2026)
🇬🇧 UNITED KINGDOM - DOVISH OUTLOOK 📉
Latest Economic Data:
Bank Rate: 3.75% (Down from 5.25% in Aug 2024)
CPI Inflation: 3.2% (November 2025) - Falling Faster Than Expected ↓
Target: 2.0% (BoE expects inflation closer to 2% by Q2 2026)
Unemployment: 5.1% (4-year high) - Rising ⚠️
GDP Growth: -0.1% (October) - Contraction Risk 📊
Rate Cut Outlook 📅:
Upcoming BoE Decision: February 5, 2026 (Next MPC Meeting)
Market Expectations: 1-2 more rate cuts expected in 2026
Probability Analysis:
78% chance of cut to 3.25% by November 2026
Possible March/June additional cuts at 3.25%
Terminal Rate: Likely to stop at 3.0-3.25%
GBP Impact: NEGATIVE for Sterling 📉
Further cuts will WEAKEN the pound
Falling interest rates make GBP carry less attractive
BUT: Interest rate DIFFERENTIAL remains wide vs JPY (still +3.00%)
🇯🇵 JAPAN - HAWKISH TURN INCOMING 📈
Latest Economic Data:
Policy Rate: 0.75% (December 2025 hike - HIGHEST IN 30 YEARS!) 🔥
CPI Inflation: 2.9% (November 2025) - ABOVE 2% TARGET
Core Inflation: 3.0% (44 CONSECUTIVE MONTHS above target!)
GDP Growth: -0.6% quarterly, -2.3% annualized (Q3 contraction)
Yen Status: DEEPLY WEAK (Trading ~155.70 vs USD)
Rate Hike Outlook 📅:
Next BoJ Meeting: January 22-23, 2026 (Quarterly Outlook Release)
Further Hikes Expected: October 2026 (Most likely timing)
Terminal Rate Target: BoJ neutral rate estimated at 1.0-2.5%
Pace: Very gradual - BoJ monitoring impact before each move
JPY Impact: POSITIVE for Yen (Long-term) 📈
Rate hikes support the yen fundamentally
BUT: Real interest rates remain "significantly negative"
Carry trade still profitable (positive interest differential)
Currency weakness persists despite rate hikes
⚡ KEY ECONOMIC CATALYSTS (January-March 2026)
UK Economic Calendar 🇬🇧:
Jan 21: December CPI Inflation Data (crucial for Feb BoE decision)
Jan 15: November GDP/Manufacturing/Services Data
Feb 5: BoE Interest Rate Decision (WATCH!)
Mar 19: Next MPC Meeting
Japan Economic Calendar 🇯🇵:
Jan 22-23: BoJ Monetary Policy Decision + Quarterly Outlook
Dec CPI Data: Release Jan 24 (Watch for headline inflation drop)
Shunto Wage Negotiations: Early 2026 (Watch for wage growth signals)
Key Watch: Governor Ueda's comments on "sustainable inflation"
US Economic Impact 🇺🇸:
Jan 28: Fed Interest Rate Decision (Will affect USD/JPY → GBP/JPY)
Tariff Uncertainty: Trump policies could impact yen weakness
Market expects: NO US rate cuts until June 2026 at earliest
🎯 INTEREST RATE DIFFERENTIAL ANALYSIS
The Carry Trade Engine 💰
Current Differential:
Bank of England (3.75%) - Bank of Japan (0.75%) = +3.00% YIELD
What This Means:
✅ Traders can borrow in JPY at 0.75%
✅ Invest in GBP at 3.75%
✅ Net profit: +3.00% annually (if held at current rates)
2026 Projection:
BoE likely cuts to 3.25% (Feb-Apr timeframe)
BoJ likely holds 0.75% (until H2 2026)
New Differential: +2.50% - Still highly attractive!
GBP/JPY Support: The wide interest rate spread is the PRIMARY DRIVER supporting GBP/JPY strength despite GBP weakness 🚀
📊 MACRO NARRATIVE & TRADING BIAS
Why GBP/JPY Is Bullish Despite Weak GBP:
Carry Trade Revival 💵
Retail investors net-buying overseas stocks (¥9.4 trillion invested)
Corporate M&A outflows continue at multi-year highs
Weak yen fundamentals persist despite BOJ rate hikes
Interest Rate Arbitrage 🔄
3.00% yield differential = structural support
Even if both rates fall, differential likely remains 2.0-2.5%
Carry traders will maintain long GBP/JPY positions
BoE Dovish Bias vs BoJ Gradual Hawkish 🎭
UK economic weakness forces more rate cuts
Japanese inflation stays above target (supports gradual BOJ approach)
Differential widens/stays wide = Bull for GBP/JPY
Real Interest Rates Remain Deeply Negative 🔻
Japan: Real rates significantly negative despite hikes
UK: Real rates falling due to inflation easing + rate cuts
Nominal carry more attractive than real returns
⚠️ RISK FACTORS & WARNINGS
Watch Out For These Catalysts:
🔴 Bearish Risks:
BoJ Surprise Aggressive Hikes (If inflation accelerates)
GBP Strength Reversal (If UK growth surprises positively)
US Tariff Escalation (Impacts global risk appetite)
Yen Flight-to-Safety (Geopolitical events)
Carry Trade Unwind (Market risk-off scenario)
🟢 Bullish Catalysts:
BoE Additional Rate Cuts (Widens differential)
Yen Weakness Continuation (Structural weakness persists)
Risk-On Market Sentiment (Supports carry trades)
Wage Growth Confirmation (Japan - keeps inflation high)
🎲 FINAL TRADING NOTES
Position Management Strategy:
Enter on Pullbacks: Use the 3-layer entry method at 211.00 / 211.50 / 212.00
Trail Stop Loss: Once in +1.00 JPY profit, trail stop at +0.50 JPY
Scale Out: Take partial profits at 213.50, 214.00, 215.00
Hold Core: Keep 1-2 contracts for potential extended move to 215.50+
Risk Management: Never risk more than 2% per trade!
Timeframe Recommendation:
Swing Trade: 2-5 day holds (LSMA 2H alignment strong)
Day Trade: 4-8 hour holds (Target 214.00 intraday)
Carry Trade: Weekly+ holds (Max interest rate yield)
📢 COMMUNITY TRADING ETHICS
Dear Respected Traders:
This analysis is provided for EDUCATIONAL & INFORMATIONAL purposes ONLY. Past performance does not guarantee future results. Each trader must conduct their own due diligence, risk assessment, and position sizing based on their personal circumstances.
✅ YOU SET YOUR OWN ENTRY PRICES
✅ YOU SET YOUR OWN TAKE PROFITS
✅ YOU SET YOUR OWN STOP LOSSES
✅ YOU ACCEPT YOUR OWN LOSSES
Trading is high-risk. Only use capital you can afford to lose completely. Good luck! 🎯💪
