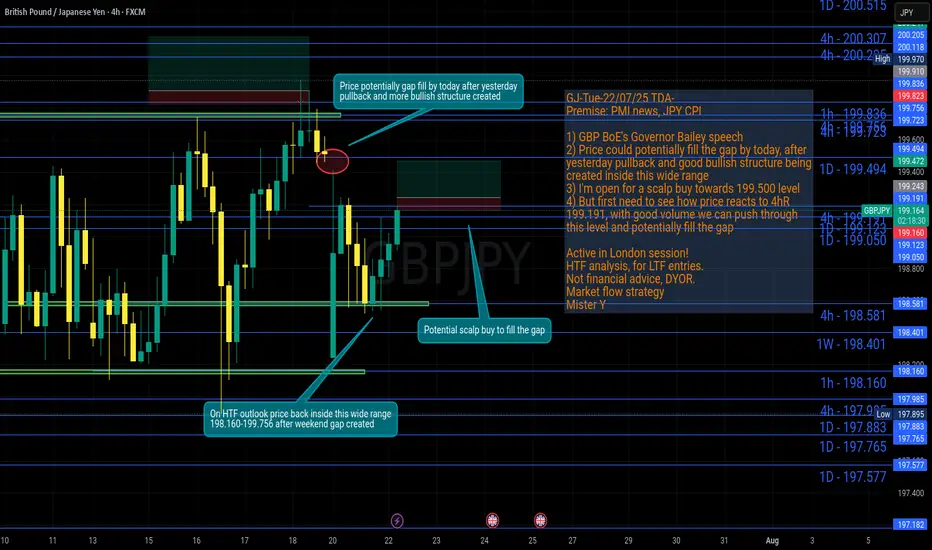
GJ-Wed-23/07/25 TDA-Gap hasn't been filled yet!Analysis done directly on the chart!
Premise:
A simple idea plan (like Tradingview public posts) won't describe everything.
No one can predict how market will move, it's always good to react to how it moves.
It gives an idea of how price might move, but no one come from FUTURE.
So I always encourage people to openly and actively discuss in real time.
I don't give signals blindly, people should learn
and understand the skill.
Following blindly signals you won't know how to
manage the trade, where precisely put sl and tp,
lot size and replicate the move over time.
That's why you need active real time discussions.
Trading is not get rich quick scheme!
Active in London session!
Not financial advice, DYOR.
Market Flow Strategy
Mister Y
Gbpjpyanalysis

GBPJPY is in the Down Trend From Resistance LevelHello Traders
In This Chart GBPJPY HOURLY Forex Forecast By FOREX PLANET
today GBPJPY analysis 👆
🟢This Chart includes_ (GBPJPY market update)
🟢What is The Next Opportunity on GBPJPY Market
🟢how to Enter to the Valid Entry With Assurance Profit
This CHART is For Trader's that Want to Improve Their Technical Analysis Skills and Their Trading By Understanding How To Analyze The Market Using Multiple Timeframes and Understanding The Bigger Picture on the Charts

GJ-Tue-22/07/25 TDA-Potential scalp buy to fill the gap!Analysis done directly on the chart!
Weekend gaps in the majority of times (if not all the time) at some point
will be filled.
Premise:
A simple idea plan (like Tradingview public posts) won't describe everything.
No one can predict how market will move, it's always good to react to how it moves.
It gives an idea of how price might move, but no one come from FUTURE.
So I always encourage people to openly and actively discuss in real time.
I don't give signals blindly, people should learn
and understand the skill.
Following blindly signals you won't know how to
manage the trade, where precisely put sl and tp,
lot size and replicate the move over time.
That's why you need active real time discussions.
Trading is not get rich quick scheme!
Active in London session!
Not financial advice, DYOR.
Market Flow Strategy
Mister Y
Gbpjpy buy signal. Don't forget about stop-loss.
Write in the comments all your questions and instruments analysis of which you want to see.
Friends, push the like button, write a comment, and share with your mates - that would be the best THANK YOU.
P.S. I personally will open entry if the price will show it according to my strategy.
Always make your analysis before a trade

British Pound / Japanese Yen - 4h (OANDA)4-hour candlestick chart from OANDA shows the GBP/JPY currency pair's price movement, currently at 199.038 with a decrease of 0.542 (-0.27%). The chart highlights a recent consolidation phase around the 199-200 range, with key levels marked at 201.000, 200.268, 199.038, 198.986, and 198.435. The data reflects trading activity as of 03:08:55.

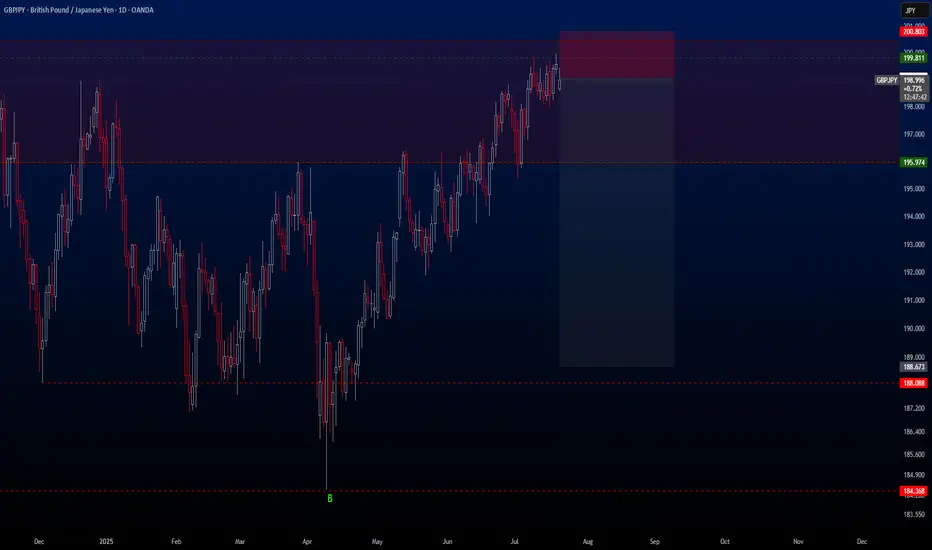
GBPJPYHello traders,
The holidays are over and we’re back to trading again! 🙂
Our first trade is on the **GBPJPY** pair. This setup is quite ideal for those thinking long-term. I’ve already activated this trade on my side.
🔍 **Trade Details**
✔️ **Timeframe**: D/W
✔️ **Risk-to-Reward Ratio**: 1:6
✔️ **Trade Direction**: Sell
✔️ **Entry Price**: 199.073
✔️ **Take Profit**: 188.673
✔️ **Stop Loss**: 200.803
🔔 **Disclaimer**: This is not financial advice. I’m simply sharing a trade I’ve taken based on my personal trading system, strictly for educational and illustrative purposes.
📌 Interested in a systematic, data-driven trading approach?
💡 Follow the page and turn on notifications to stay updated on future trade setups and advanced market insights.
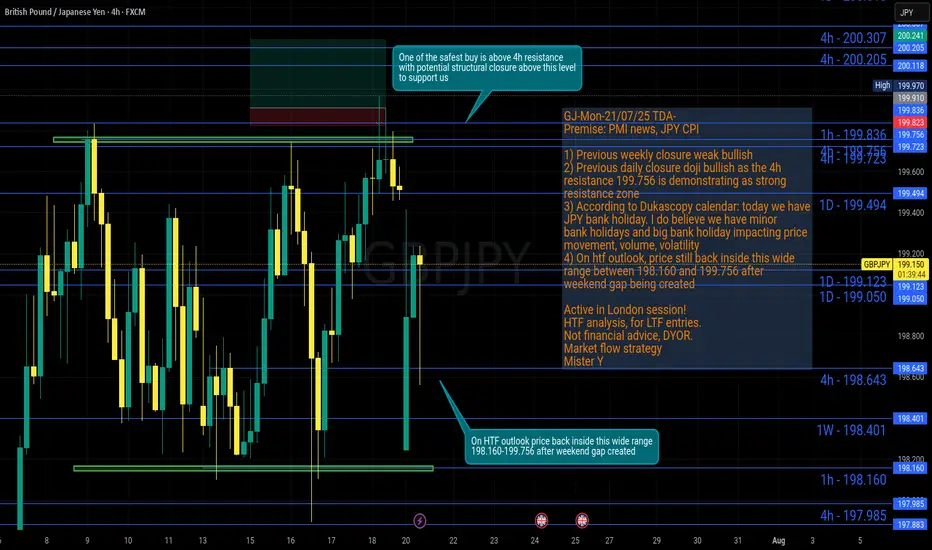
GJ-Mon-21/07/25 TDA-Wide range GJ, weekend gap at open!Analysis done directly on the chart!
We have big bank holidays and minor bank holidays.
Surely minor bank holidays impact less the price
Premise:
A simple idea plan (like Tradingview public posts) won't describe everything.
No one can predict how market will move, it's always good to react to how it moves.
It gives an idea of how price might move, but no one come from FUTURE.
So I always encourage people to openly and actively discuss in real time.
I don't give signals blindly, people should learn
and understand the skill.
Following blindly signals you won't know how to
manage the trade, where precisely put sl and tp,
lot size and replicate the move over time.
That's why you need active real time discussions.
Trading is not get rich quick scheme!
Active in London session!
Not financial advice, DYOR.
Market Flow Strategy
Mister Y
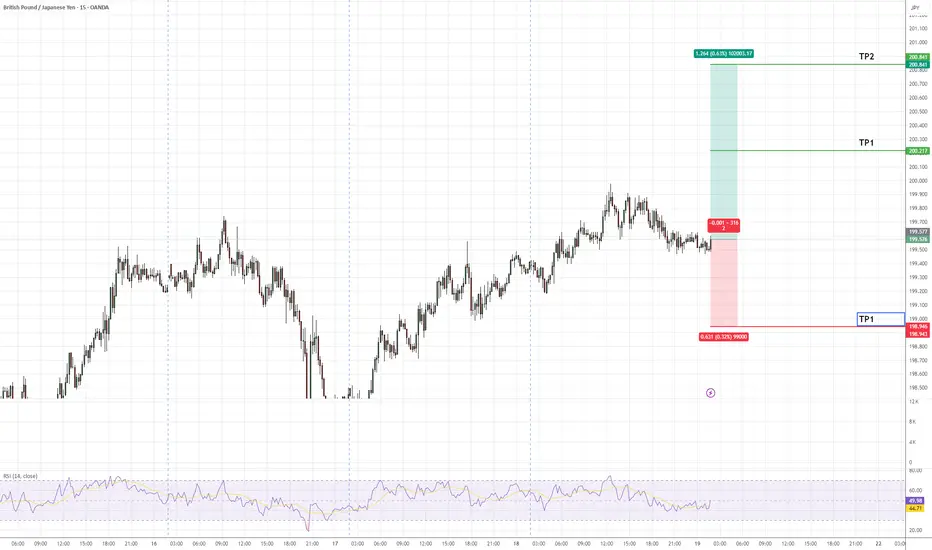
Potential Bullish Trade in GBPJPYGBPJPY continues to exhibit strong bullish momentum, with price action aligning with the prevailing uptrend. The pair is projected to advance towards the identified target zones (TP1 and TP2) as marked on the chart. A stop-loss level (SL) has been defined to manage downside risk effectively.
Traders are advised to monitor key support and resistance levels for potential confirmations as the setup develops.
GBPJPY - 1D SetupThe Japanese yen may get stronger for a while due to the weakening of the British Economy, which may lead to a pullback of the GBPJPY currency, and this seems to be a good trading opportunity in sells with a strict stop-loss. OANDA:GBPJPY
Note- This is my own view and not a financial advice as trading comes with high risk.

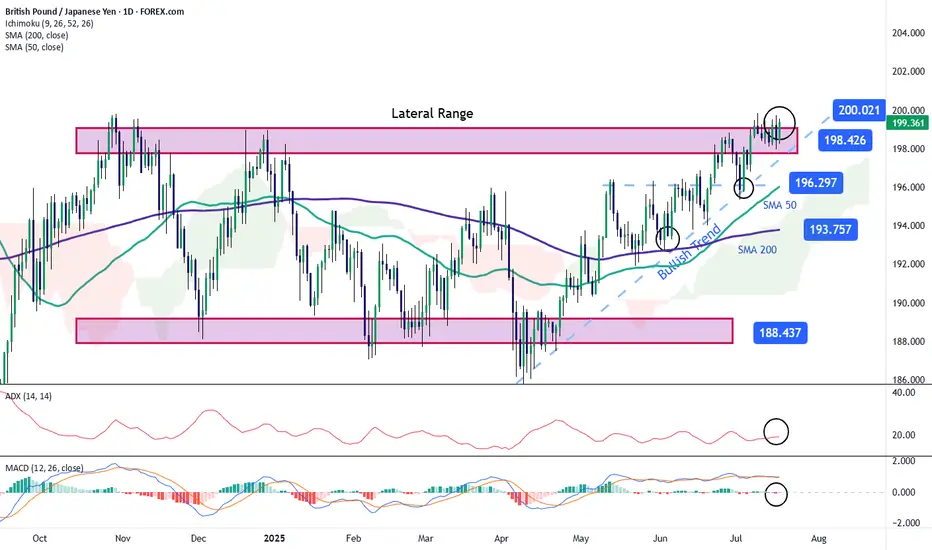
GBP/JPY: Pound Attempts to Break Out of a Broad Sideways RangeThe GBP/JPY pair has gained over 0.5% today in favor of the British pound, as the Japanese yen continues to weaken steadily. The recent escalation in the trade war, where potential 25% tariffs may begin to affect Japan in the short term, has contributed to the yen’s steady decline. For now, this remains one of the main catalysts behind the price movement, which is trending lower in the near term. As uncertainty surrounding the yen persists, buying pressure on GBP/JPY could become more significant.
Broad Sideways Range at Risk
Recent short-term bullish movements are beginning to test the upper boundary at 198.42, a key level within the broad sideways range that has dominated the chart in recent months. For now, the price could face a period of persistent neutrality as it tries to push through this upper barrier, which remains the most relevant resistance zone. If buying pressure holds steady over the coming sessions, the range could come under threat, potentially giving way to a more dominant and consistent bullish trend in the short term.
ADX
The ADX line is currently oscillating close to the 20 level, which typically indicates low average volatility over the past 14 sessions. This could be signaling a period of price consolidation, especially as the pair approaches current resistance zones.
MACD
The MACD histogram remains close to the zero line, suggesting a lack of clear direction in the short-term momentum of the moving averages. As long as this persists, it will likely reinforce the current neutral sentiment around resistance levels.
Key Levels:
200.00 – Tentative resistance zone, corresponding to the next psychological level to watch in the short term. Sustained price action above this level could confirm a breakout of the broad channel, paving the way for a dominant bullish trend.
198.42 – Nearby barrier, marking the upper boundary of the broad range. Sustained moves above this level could further reinforce the prevailing bullish bias.
196.297 – Key support level, marking the recent low. If selling pressure brings the price back to this area, the market could resume the broad sideways range seen in previous sessions.
Written by Julian Pineda, CFA – Market Analyst
GBPJPY in Premium Zones of 2008 Financial Crisis - {17/07/2025}Educational Analysis says that GBPJPY (FX pair) may give trend Trading opportunities from this range, according to my technical analysis.
Broker - FXCM
So, my analysis is based on a top-down approach from weekly to trend range to internal trend range.
So my analysis comprises of two structures: 1) Break of structure on weekly range and 2) Trading Range to fill the remaining fair value gap
Will Jpy start to lose value like it is doing since 2019 or it will do free fall same like 2008 crisis.
Let's see what this FX pair brings to the table for us in the future.
Please check the comment section to see how this turned out.
DISCLAIMER:-
This is not an entry signal. THIS IS FOR EDUCATIONAL PURPOSES ONLY.
I HAVE NO CONCERNS WITH YOUR PROFIT OR LOSS,
Happy Trading.

British Pound / Japanese Yen (GBP/JPY) 4-Hour Chart Analysis4-hour performance of the British Pound against the Japanese Yen (GBP/JPY) via OANDA data. The current price is 199.352, reflecting a 0.129 (0.06%) increase. The chart highlights a recent upward trend, with key support levels around 198.107 and 198.994, and resistance near 200.415. A breakout above the recent high is indicated, suggesting potential for further gains.

GBPJPY RangingGBPJPY is still in the range. For this range we can trade between the zones drawn. It has taken previous day high already. There is S&R level and supply zone if gets buyer push and crosses previous week high we may expect further bullish momentum. Till now we can trade between zones if we see any bullish signs.

GBPJPY AccumulatingGBPJPY is building liquidity. We can see it around these zones. So trading between the zones will be wonderful. We can not say anything about the direction of GBPJPY right now because it is oscillating between the zones. The clear picture can be trade zones for scalping. No any potential move seen here.

GBPJPY Swing Trade Setup, Sell, Short SetupA Good RR setup, wait for the entry, when price reaches the poi, look for any weakness ltf and then take trade, we are taking trade on 1hr, so for entry look for 5m tf. I will update the trade status where to take or not!

GBPJPY is still in retracementWe can see from the graph GBPJPY is oscillating between the two S&R levels. For today we expect GJ to touch the demand zone and then go higher. Therefore we can expect GBPJPY in go further down and hit the demand zone because it is still retracing. The possibilities for the GJ are shown.

GBP/JPY) Bearish Analysis Read The captionSMC trading point update
Technical analysis of GBP/JPY on the 3-hour timeframe, suggesting a potential short-term pullback within a larger ascending channel.
---
Analysis Summary
Pair: GBP/JPY
Timeframe: 3H
Current Price: 198.883
Bias: Bearish move toward channel support
---
Key Technical Insights
1. Ascending Channel Formation:
Price is moving within an upward-sloping channel.
Current structure suggests price is heading toward the lower trendline support.
2. Support Level & Target Zone:
The yellow zone around 196.355 is a major support area and target point, coinciding with both structural support and the bottom of the channel.
3. EMA (200 Close):
Price is still above the 200 EMA (197.067), so overall trend remains bullish — but current move is a correction.
4. RSI (14):
RSI is neutral near 51.14, allowing room for further downward movement before becoming oversold.
---
Target Point
Target: 196.355 (support zone and bottom of channel)
---
Trade Idea
Direction Entry Stop-Loss Target
Sell 198.80–199.00 Above 199.70 196.35
SMC trading point
---
Summary
GBP/JPY is likely to retrace toward support at 196.35 before possibly bouncing within the larger bullish structure. This offers a short-term selling opportunity, with potential buy setups near the lower trendline later.
Please support boost 🚀 this analysis)

STEAL THIS TRADE! GBP/JPY Long Setup(Thief Trader’s Secret Plan)💰 Thief Trader’s GBP/JPY Heist Alert – Stealthy Long Setup Loading!
🌍 Greetings, Profit Raiders!
Hola, Konnichiwa, Ni Hao, Privyet, Hallo, Bonjour!
📢 Attention Market Bandits & Chart Pirates—the GBP/JPY Beast is ripe for plunder! Time to execute the next Thief Trader Masterplan.
🎯 Entry Zone – Loot the Dip!
Current price = Open vault. Fire longs now or snipe pullbacks (15M/30M charts recent swing low level).
Pro Thief Move: Stack buy limits near swing lows/highs. Chart alerts = your secret weapon. 🔫
🛑 Stop Loss – Guard the Treasure!
Swing Thieves: Hide SL below 2H swing low of candle wick @ (~197.000).
Day Raiders: Adjust SL to your risk size & order count. No free rides!
🎯 Profit Target – Escape with the Cash!
Take the 202.000 bag or exit early if momentum fades.
🔪 Scalpers vs. Swingers – Choose Your Weapon!
Scalpers (Quick Strikes): Longs only. No distractions.
Swing Traders (Patient Hunters): Trail stops & lock in gains.
🌪️ Market Pulse – Bullish Winds Blowing!
Price battling MA Resistance? No panic. Bulls still rule thanks to:
Fundamentals + Macro Trends
COT Data + Sentiment Shift
Quant Scores & Intermarket Alignments
(Check Linnkss for the full heist blueprint.)
⚠️ News Trap Warning!
Upcoming high-impact events? Freeze trades or tighten stops. Trailing SL = your escape route.
🚨 Join the Thief Trading Crew!
Like 👍 or Boost 🚀 this idea to fuel our next raid.
Thief Trader Tactics = Daily Market Domination. Your support keeps the heists alive! 💰❤️
🤑 Stay Locked In – The Next Big Score is Coming…
Timing is everything. Watch the charts. Strike hard. Exit smarter.

"GBP/JPY: High-Risk Pips Grab – Escape Before Cops! 🏴☠️ GBP/JPY "Dragon Heist" – Bulletproof Bullish Raid (High-Risk, High-Reward) 🚨
🔥 Attention Market Pirates & Profit Raiders! 🔥
(Day/Swing Trade Plan – Long Entry Focused)
🔑 Entry Zone (Vault Cracked!):
"The Dragon’s loot is unguarded! Bullish pullback = prime stealing opportunity."
Buy Limit Orders: Layer entries near 15M/30M swing lows (wick/body). DCA-friendly!
Thief Pro Tip: Scalpers ride long-only waves. Swing traders? Stack slowly, escape rich.
🎯 Target (Escape Routes):
200.600 (or bail early if cops (resistance) swarm!)
🚨 Red Zone = High-Risk Take-Profit (Overbought? Reversal? Police (bears) lurk here!)
⛔ Stop Loss (Emergency Exit):
4H Swing Low/High (Wick-based) – Adjust for risk/lot size!
No martyr trades! SL = your heist survival kit.
📢 Breaking News (Fundamental Edge):
Dragon’s bullish fuel? Macro data, COT reports, sentiment—CHEK THE LIiNKk 👉🔗 (Don’t skip homework!)
💣 Trading Alerts:
News = Landmines! Avoid new trades during releases.
Trailing SL = Your Getaway Car (Lock profits, dodge volatility.)
💥 Boost This Heist!
Smash 👍, hit 🔔, and fund our next raid! Every boost = more stolen pips for the crew.
Stay tuned—another heist drops soon! 🤑 #ForexBandits

GBPJPY: Bullish Structure Still IntactGJ created a new HH then turned sideways. More consolidation or a deeper pull back could be seen before the next rally.
Last BOS: Break above 199.70 → confirmed bullish strength
H4 Demand Zone (Pullback): 198.30–198.60
Liquidity Above: Clean pools at 200.30 – 200.70
H1 Key Zone: 198.60–198.90 (H1 OB + unfilled FVG) → currently being tested.
Momentum Trigger: BOS above 199.30 to confirm buyers stepping back in.
M15 Micro-Structure: Slightly bearish (short-term), sweeping liquidity under 198.80.
What to Watch: M15 bullish BOS above 199.10–199.30 for intraday buy confirmation.
🟢Entry Zone 198.30 – 198.60
SL 197.90
TP1 199.70
TP2 200.30
TP3 201.00
❌ Bullish Invalidation
H1 close below 197.90 → bullish bias neutralized, expect deeper retrace into 197.20 – 197.50.

GBPJPY: Still BullishPrice has pulled back and is currently reacting to H1 OB at 197.00–197.20
* FVG Support: Between 196.80–197.10
* Watch for: Bullish BOS above 197.50 to confirm buyers stepping back in
* Confirmation Needed: M15 bullish BOS above 197.50–197.60 for buy entry
🟢Entry: 196.80 – 197.10
Stop Loss: 196.4
TP1: 198
TP2: 198.6
TP3: 200
Breakout Option: If price pushes above 198.30 (M15 BOS + retest), you can enter.
❌ Bullish Bias Invalidation
H1 close below 196.40 → signals potential deeper retracement

GBPJPY is still in pullbackGJ possibilities has been drawn on chart. GJ is in pullback still. It had developed liquidity around S&R Level and has taken. GJ may touch PD high today because it has already taken PD low. It may go towards the demand zone residing below PD low.

GBPJPY is in the Down Trend From Resistance LevelHello Traders
In This Chart GBPJPY HOURLY Forex Forecast By FOREX PLANET
today GBPJPY analysis 👆
🟢This Chart includes_ (GBPJPY market update)
🟢What is The Next Opportunity on GBPJPY Market
🟢how to Enter to the Valid Entry With Assurance Profit
This CHART is For Trader's that Want to Improve Their Technical Analysis Skills and Their Trading By Understanding How To Analyze The Market Using Multiple Timeframes and Understanding The Bigger Picture on the Charts
