GBPJPY Ready for a Pullback from 208 Zone!📊 GBPJPY 4H Technical Analysis (Wedge Pattern Forming)
Pair: GBPJPY
Timeframe: 4H
Price: 207.70 (approx.)
📈 Structure Overview
Price is trading inside a rising wedge pattern. Both higher highs & higher lows are visible, but momentum is slowing down near the wedge resistance.
➡️ Resistance Zone: Around 207.90 – 208.20
➡️ Support Trendline: Rising support connecting higher lows
➡️ Possible Breakdown: Expected toward lower wedge support
🔍 Indicators
SMA 9 & SMA 20 are both below current price showing trend remains bullish,
but distance is shrinking → indicating weakening momentum.
📉 Bias: Bearish Correction Expected
Price is repeatedly rejected from the upper wedge, showing exhaustion.
A short-term pullback toward lower support is likely.
📌 Bearish Targets
happens):
TP1: 206.80
TP2: 205.90
TP3: 204.80 (if momentum increases)
📌 Invalidation
Bullish continuation only if 208.20+ breakout & close above wedge.
Gbpjpyshort

GBPJPY is in the Down Trend From Resistance LevelHello Traders
In This Chart GBPJPY HOURLY Forex Forecast By FOREX PLANET
today GBPJPY analysis 👆
🟢This Chart includes_ (GBPJPY market update)
🟢What is The Next Opportunity on GBPJPY Market
🟢how to Enter to the Valid Entry With Assurance Profit
This CHART is For Trader's that Want to Improve Their Technical Analysis Skills and Their Trading By Understanding How To Analyze The Market Using Multiple Timeframes and Understanding The Bigger Picture on the Charts

GBP/JPY) Bearish trend analysis Read The captionSMC Trading point update
Technical analysis of GBPJPY – Bearish Continuation Setup
Timeframe: 1H
Current Price: ~ 205.60
Indicators:
Price below 50 EMA (blue) → short-term bearish pressure active
Price below 200 EMA (black) → overall trend bearish
Descending channel structure confirms continuation trend
---
Market Structure Analysis
Price is moving inside a large descending channel, forming lower highs and lower lows.
Recently price tapped the upper channel resistance and the 50 EMA, rejected strongly with a bearish candle.
Break of minor structure supports bearish momentum return.
Liquidity & SMC View
The spike above intraday highs likely acted as liquidity grab / stop-hunt.
Sell-side liquidity expected to be targeted below the recent swing low.
Projection shows potential consolidation and continuation, creating a staircase move lower.
---
Expected Move
The projected path indicates:
1. Pullback/retest of trendline or EMA
2. Continuation inside the descending channel
3. Drop toward the target zone
---
Target Level
Level Purpose
204.680 – 204.700 Main TP / previous demand zone / channel bottom
---
Trade Idea Concept
> SELL on retest of the broken internal trendline / EMA rejection
Entry Zone: 205.75 – 205.90 (if price pulls back)
SL: above 206.20 region (above previous high and channel break)
TP: 204.70
---
Bearish Bias Validity
The setup remains valid only if:
Price stays under 206.20
Channel structure remains intact
If price breaks above channel + EMA → shift bias to neutral temporarily.
Mr SMC Trading point
---
Summary
Bearish trend structure
Rejection from channel resistance + EMAs
Liquidity sweep + continuation pattern
Target at 204.68 looks realistic
Please support boost 🚀 this analysis

GBPJPY H1 | Bearish Reaction Off Key ResistanceMomentum: Bearish
Price is currently within the bearish ichimoku cloud.
Sell entry: 206.167
- Strong pullback resistance
- 61.8% Fib retracement
- 61.8% Fib projection
Stop Loss: 206.816
- Overlap resistance
Take Profit: 205.551
- Pullback support
High Risk Investment Warning
Stratos Markets Limited (tradu.com/uk ), Stratos Europe Ltd (tradu.com/eu ):
CFDs are complex instruments and come with a high risk of losing money rapidly due to leverage. 70% of retail investor accounts lose money when trading CFDs with this provider. You should consider whether you understand how CFDs work and whether you can afford to take the high risk of losing your money.
Stratos Global LLC (tradu.com/en ): Losses can exceed deposits.
Please be advised that the information presented on TradingView is provided to Tradu (‘Company’, ‘we’) by a third-party provider (‘TFA Global Pte Ltd’). Please be reminded that you are solely responsible for the trading decisions on your account. Any information and/or content is intended entirely for research, educational and informational purposes only and does not constitute investment or consultation advice or investment strategy. The information is not tailored to the investment needs of any specific person and therefore does not involve a consideration of any of the investment objectives, financial situation or needs of any viewer that may receive it. Past performance is not a reliable indicator of future results. Actual results may differ materially from those anticipated in forward-looking or past performance statements. We assume no liability as to the accuracy or completeness of any of the information and/or content provided herein and the Company cannot be held responsible for any omission, mistake nor for any loss or damage including without limitation to any loss of profit which may arise from reliance on any information supplied by TFA Global Pte Ltd.

GBPJPY H1 | Bearish Reaction Off Pullback ResistanceMomentum: Bearish
Price is currently below the ichimoku cloud.
Sell entry: 206.14
- Strong pullback resistance
- 50% Fib retracement
- 100% Fib projection
Stop Loss: 206.789
- Overlap resistance
Take Profit: 205.32
- Multi-swing low support
High Risk Investment Warning
Stratos Markets Limited (tradu.com/uk ), Stratos Europe Ltd (tradu.com/eu ):
CFDs are complex instruments and come with a high risk of losing money rapidly due to leverage. 70% of retail investor accounts lose money when trading CFDs with this provider. You should consider whether you understand how CFDs work and whether you can afford to take the high risk of losing your money.
Stratos Global LLC (tradu.com/en ): Losses can exceed deposits.
Please be advised that the information presented on TradingView is provided to Tradu (‘Company’, ‘we’) by a third-party provider (‘TFA Global Pte Ltd’). Please be reminded that you are solely responsible for the trading decisions on your account. Any information and/or content is intended entirely for research, educational and informational purposes only and does not constitute investment or consultation advice or investment strategy. The information is not tailored to the investment needs of any specific person and therefore does not involve a consideration of any of the investment objectives, financial situation or needs of any viewer that may receive it. Past performance is not a reliable indicator of future results. Actual results may differ materially from those anticipated in forward-looking or past performance statements. We assume no liability as to the accuracy or completeness of any of the information and/or content provided herein and the Company cannot be held responsible for any omission, mistake nor for any loss or damage including without limitation to any loss of profit which may arise from reliance on any information supplied by TFA Global Pte Ltd.

GBP/JPY Best Place For Sell Cleared After This Massive Move !Here is my opinion on Daily T.F On GBP/JPY Chart , the price Very Near to touch a very strong res area that forced the price to respect it and go down for more than 500 pips for 1 time , and if we checked the chart we will see that the price is going up very hard without any correction so we need a very strong res area to force the price to go down at least for 300 pips so i choose this area cuz it`s the highest place the price touch it and it respect it very much and go down very hard as it go up very hard , so i`m waiting the price at this area to sell it and targeting from 100 to 300 pips . if we have a daily closure above my res area this idea will not be valid anymore .
Entry Reasons :
1- Very Strong Daily & Weekly Res Area .
2- Perfect Bearish Price Action Last Time .
3- Bigger Time Frames Confirmed .

GBPJPYGBPJPY
- Demand Zone
- Fibonacci Level - 50.00% / 61.80%
- Break of Structure
- Completed " 12345 " Impulsive Waves
- Sell Side Liquidity

GBPJPY H1 | Bearish Reaction Off Key ResistanceMomentum: Bearish
Price is currently below the ichimoku cloud, and has broken past the previous ascending trendline.
Sell entry: 205.697
- Pullback resistance
- 50% Fib retracement
- 78.6% Fib projection
Stop Loss: 206.683
- Swing high resistance
Take Profit: 204.576
- Swing low support
High Risk Investment Warning
Stratos Markets Limited (tradu.com/uk ), Stratos Europe Ltd (tradu.com/eu ):
CFDs are complex instruments and come with a high risk of losing money rapidly due to leverage. 70% of retail investor accounts lose money when trading CFDs with this provider. You should consider whether you understand how CFDs work and whether you can afford to take the high risk of losing your money.
Stratos Global LLC (tradu.com/en ): Losses can exceed deposits.
Please be advised that the information presented on TradingView is provided to Tradu (‘Company’, ‘we’) by a third-party provider (‘TFA Global Pte Ltd’). Please be reminded that you are solely responsible for the trading decisions on your account. Any information and/or content is intended entirely for research, educational and informational purposes only and does not constitute investment or consultation advice or investment strategy. The information is not tailored to the investment needs of any specific person and therefore does not involve a consideration of any of the investment objectives, financial situation or needs of any viewer that may receive it. Past performance is not a reliable indicator of future results. Actual results may differ materially from those anticipated in forward-looking or past performance statements. We assume no liability as to the accuracy or completeness of any of the information and/or content provided herein and the Company cannot be held responsible for any omission, mistake nor for any loss or damage including without limitation to any loss of profit which may arise from reliance on any information supplied by TFA Global Pte Ltd.

GBPJPY BuysOverall Weekly Outlook for GBPJPY (Nov 24-28, 2025)GBPJPY has been in a broader uptrend since dipping to around 184 earlier this year, with recent price action showing resilience after a corrective pullback to 199-200 levels in late October/early November. As of today (Monday, Nov 24), the pair is trading around 205.57, up from last week's close near 205.18, with intraday highs testing 205.91. Technical indicators point to a bullish continuation, supported by the structure of the rally from 184.35—any dips look corrective rather than reversal signals. Key resistance sits at 205.30-206.86 (recent highs), with upside potential toward 208.09 if breached. Support levels are at 204.22 (pivotal for bullish bias) and 203.85 (stronger daily support). Forecasts suggest an average around 205 for November, with potential swings to 210 on strength or 199 on weakness, but the momentum favors bulls amid divergent BoE/BoJ policies—UK yields stabilizing higher while JPY remains sensitive to fiscal stimulus hints. Economic events this week are light for both currencies (Japan's holiday on Monday limits Asian flow; potential BoJ minutes mid-week and UK PMI Tuesday could add volatility), so expect technical-driven moves with risk-on sentiment supporting GBP over JPY. Overall, I see a 60-70% chance of net upside by Friday, targeting 206.50-207.00, unless global risk-off (e.g., US data spillover) flips the carry trade.Now, breaking it down day by day, session by session (times in GMT; Asian: 00:00-08:00, London: 08:00-16:00, NY: 13:00-22:00). These are my reasoned thoughts based on current momentum, levels, and sentiment—pure speculation, trade at your own risk.Monday, Nov 24: Consolidation with Mild Upside BiasAsian Session: Light volume due to Japan's Labor Thanksgiving Day holiday (markets closed). Expect range-bound action between 205.00-205.90, with minimal direction. Any early JPY safe-haven bids could test 205.10 support, but no major catalysts—likely flat open around current levels.
London Session: Volume picks up; look for a bullish probe above 205.57 if GBP sentiment holds (tied to softer USD). Target 206.00 on a clean break of 205.91 high. Risk: If below 205.22, minor pullback to 204.80.
NY Session: Overlap with London could extend gains if US data (e.g., consumer confidence echoes) weakens USD broadly, benefiting crosses like GBPJPY. Close around 205.80-206.20. Sentiment from X traders leans buy here, with FVG tests on lower TFs suggesting liquidity grabs upward.
Tuesday, Nov 25: Bullish Momentum Builds, Watch UK PMIAsian Session: Post-holiday normalization; JPY might see initial selling if Tokyo reopens flat. Bias up from Monday's close, testing 205.80 early. Support at 205.10 holds unless BoJ hints leak (minutes possibly previewed).
London Session: Key event—UK Flash Manufacturing/Construction/Services PMI (~09:30 GMT, expected ~50/50/52). Stronger-than-expected (above 51 combined) could fuel GBP rally to 206.50, confirming uptrend resumption. Weaker print risks dip to 204.50. Overall, expect positive flow.
NY Session: Follow-through on PMI; if bullish, pair pushes 206.86 high. X outlooks highlight buy setups above 204.65, targeting hourly resistances. End day near 206.00 if no USD reversal.
Wednesday, Nov 26: Sideways to Bullish, Potential JPY VolatilityAsian Session: Steady grind higher if Tuesday's momentum carries; watch for 206.00 break. Low-impact JPY data (e.g., Coincident Index) unlikely to disrupt, but any BoJ fiscal package whispers could cap upside.
London Session: Neutral start, but structure favors continuation above 205.50. Resistance at 206.20; break signals 207.00 path. Bearish risk low unless Eurozone spillover weakens GBP crosses.
NY Session: US durable goods orders (~13:30 GMT) could indirectly pressure via USDJPY—stronger USD might drag GBPJPY to 205.50 test. Still, technicals (e.g., RSI not overbought) support close above 206.10. Weekly forecasts on X emphasize bullish H4 structures here.
Thursday, Nov 27: Upside Acceleration, Thanksgiving Thin LiquidityAsian Session: Momentum from mid-week; target 206.50 if above 206.00. JPY holiday echoes keep it quiet—ideal for trend continuation.
London Session: Pre-US holiday thinning; expect amplified moves. Bullish if holding 205.80, eyeing 207.00. UK data light (perhaps mortgage approvals ~09:30), so technicals dominate.
NY Session: US markets close early for Thanksgiving—low volume, high volatility risk. Positive bias to 206.80 close, but watch for reversals below 205.50 on thin books. Aligns with broader weekly targets around 205-206 avg.
Friday, Nov 28: Profit-Taking, Range Close to WeekAsian Session: Post-holiday fatigue; likely consolidation 205.50-206.50. Any JPY rebound (e.g., from weekly Tankan previews if released) tests support.
London Session: Final push? If week builds bullishly, one last stab at 207.00. But profit-taking probable near resistance.
NY Session: Thin Friday flows; expect choppy close around 206.20-206.50. Weak close below 205.80 signals overextension, but uptrend intact per structure. X sentiment mixed but leans buy-to-high.
In summary, I anticipate a steady climb with pullbacks as buying opportunities—classic carry trade resumption unless JPY surprises hawkish. Monitor 204.22 closely; breach flips bearish. Always pair with your risk management!

GBPJPY: Bearish Drop to 202?As the previous analysis worked exactly as predicted, FX:GBPJPY is eyeing a bearish reversal on the 4-hour chart , with price approaching a key resistance zone near recent highs, converging with cumulative buy liquidation and a potential entry area that could trigger downside momentum if sellers defend against further upside. This setup suggests a pullback opportunity amid the ongoing rally, targeting lower support levels with favorable risk-reward.
Entry between 205.57-206 for a short position🎯. Targets at 203.64 (first), 202.63 (second). Set a stop loss at a close above 207 to limit exposure📊, yielding a risk-reward ratio of greater than 1:3 overall. Monitor for confirmation via a bearish candle close below entry with rising volume, leveraging yen's persistent weakness.🌟
Fundamentally , GBPJPY is holding near 206.00 after refreshing its yearly high, with early signs of a short-term pullback as markets digest BoE's hawkish stance amid expectations of a December rate cut and upcoming UK CPI data. Forecasts indicate continued volatility driven by diverging central bank policies, with BoJ's dovish measures weakening the yen further, though GBP faces pressures from slowing UK growth and potential fiscal uncertainties. 💡
📝 Trade Setup
🎯 Entry Zone (Short):
205.57 – 206.00
🎯 Targets:
• TP1: 203.64
• TP2: 202.63
❌ Stop Loss: Close above 207.00
⚖️ Risk-to-Reward: Greater than 1:3 overall
What's your outlook on this setup? Drop your thoughts below! 👇

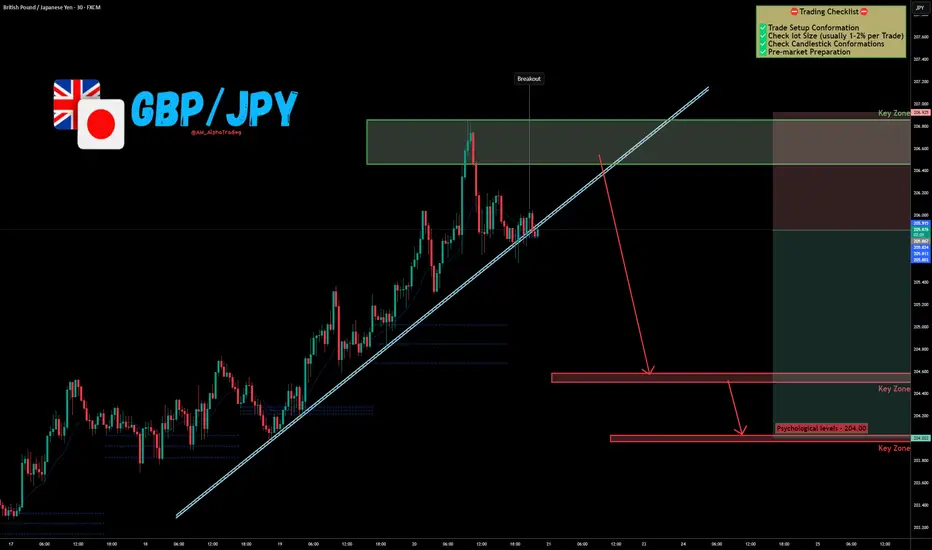
GBP/JPY Rejection at Supply → Next Stop: 204.00 !The GBP/JPY Pair, Price has been trading within a Trendline Breakout on the M30 chart, forming consistent lower highs and lower lows. Price action is now testing the lower boundary of the pattern, signalling a possible breakdown.
✅Market Context:
1️⃣Downward structure building inside the pattern.
2️⃣Sellers are showing strength near support levels.
3️⃣Breakdown below the trendline indicates momentum continuation toward lower zones.
✅Trade Plan :
Entry: Sell after confirmed breakdown below the support (Candle close below trendline or retest of the breakout).
💰Take Profit (TP): At the Key Zone – major support area identified ahead.
🛑Stop Loss (SL): Above the pattern structure / recent swing high.
✅Psychological Discipline:
1️⃣Stick to plan – No Revenge Trades.
2️⃣Accept losing trades as part of the strategy.
3️⃣Risk only 1–2% of your account balance per trade.
✅ Support this analysis with a
LIKE 👍 | COMMENT 💬 | FOLLOW 🔔
It helps a lot & keeps the ideas coming!
⚠️ Disclaimer: This analysis is for educational purposes only and does not constitute financial advice. Forex trading involves high risk. Trade only with capital you can afford to lose and always do your own research.
GBPJPY:LIVE TRADEHello friends
With the breakdown of the ascending channel, you can see that the power has fallen to the sellers and now the price is expected to see lower targets.
Don't forget risk and capital management.
*Trade safely with us*

GBPJPY | Institutional Sell Setup – D1 & W1 Sweeps AlignGBPJPY has completed a multi-timeframe liquidity sweep, with both W1 and D1 sweeps aligning inside a premium price zone.
The structure has shifted bearish following a clear CHOCH and a rejection from the FVG imbalance area, confirming potential downside continuation.
🔹 Execution Bias: Instant Sell
🔹 Entry Zone: 202.60–202.80
🔹 Stop-Loss: Above 203.40 (protected high)
🔹 Target: 199.00 (liquidity zone)
🔹 Bias: Bearish
Technical Breakdown:
• Weekly sweep confirms distribution.
• Daily sweep adds confluence of liquidity grab.
• CHOCH at discount confirms bearish intent.
• FVG + refined OB = smart-money entry zone.
• Targeting inefficiency and old liquidity lows.

GBPJPY Short From Resistance!
HI,Traders !
#GBPJPY made a retest
Of the key horizontal
Resistance level of 204.004
From where we are already
Seeing a bearish pullback so
As we are locally bearish
Biased and we will be
Expecting a further
Bearish move down !
Comment and subscribe to help us grow !

GBPJPY - H1 [Outlook]Looking at GBPJPY we can see that it's currently trading on our diagonal resistance, failure to breakout of it and close above it will result in potential opportunities to the downside..

GBPJPYGBPJPY
- Bearish Channel in Long Time Frame and Bullish Channel in Short Time Frame
- Order Block
- Break of Structure
- Completed " 1234 " Impulsive Waves
- Resistance Level

GBP/JPY Rejection at Resistance – Potential Drop AheadOn the GBP/JPY 15-minute chart, the price has reacted strongly from the resistance zone around 202.95. If the market fails to break and hold above this level, we could see a bearish move toward the support zone around 201.02. A break below that level could open the way toward 199.50. Watching for a clear confirmation before entering a sell setup. Trading with patience and discipline is key.

GBP/JPY) Bearish trend analysis Read The captionSMC Trading point update
Technical analysis of GBP/JPY (4H timeframe) based on Smart Money Concepts (SMC) and Fibonacci premium zone confluence.
Let’s break down the full analysis and idea 👇
---
Overall Concept
This setup illustrates a retracement sell idea, expecting GBP/JPY to reverse from a premium Fibonacci zone (0.62–0.79) after a corrective rally.
The chart suggests price is likely to reject the supply zone and continue downward toward the 198.820 target point.
---
Technical Breakdown
1. Market Structure
The overall structure has shifted bearish — price broke a prior higher low, confirming a Change of Character (ChoCH).
The move up is seen as a retracement to fill imbalance and mitigate a supply zone before continuation down.
The chart shows a lower-high formation in progress, aligning with bearish momentum.
2. Key Levels
Current Price: 201.899
50 EMA: 201.561 → currently acting as dynamic resistance.
200 EMA: 201.531 → additional confluence resistance level.
Premium Fibonacci Zone (0.62–0.79): 201.80–202.40 (marked by the blue area).
This is the ideal sell zone where liquidity above recent highs may be collected before the drop.
Target Point: 198.820 — previous demand zone and potential liquidity area.
3. Fibonacci & Supply Confluence
The retracement is drawn from the previous swing high to swing low.
Price has tapped into the 0.705–0.79 zone, which overlaps with the EMA resistance cluster.
Red arrow marks the potential entry trigger area where institutions may enter short.
4. Expected Price Action
1. Price rejects the blue premium zone (0.62–0.79).
2. A bearish rejection candle or engulfing pattern forms.
3. Market structure confirms with a lower low on smaller timeframes.
4. Price continues downward toward 198.820 — the target point and liquidity draw.
5. Volume & Confirmation
Volume (37.2K) indicates market participation, aligning with a potential exhaustion of buyers near resistance.
The clean liquidity sweep above EMAs supports the bearish mitigation scenario.
---
Trade Idea Summary
Aspect Detail
Bias Bearish
Entry Zone 201.80 – 202.40 (Fibonacci 0.62–0.79 + supply area)
Stop Loss Above 202.60 (structure invalidation)
Take Profit 198.82 (target liquidity zone)
Risk-to-Reward (RR) ≈ 1:3 or better
---
Confirmation to Watch
Bearish rejection candle or engulfing pattern within blue zone
Price holding below EMA50/200
Break of internal support confirming bearish continuation
Mr SMC Trading point
---
Summary
GBP/JPY is showing signs of distribution after a corrective pullback into a premium zone.
The confluence of Fibonacci retracement, EMA resistance, and structure break supports a bearish continuation toward 198.820, making this a clean retracement sell setup aligned with SMC methodology.
---
please support boost 🚀 this analysis

GBP/JPY) Bearish trend analysis Read The captionSMC Trading point update
Technical analysis of GBP/JPY, anticipating a retracement into a premium Fibonacci zone (0.62–0.79) before a continuation to the downside — targeting 198.79.
Here’s the detailed breakdown
---
Overall Idea
The market is currently in a bearish structure, and this analysis expects a pullback toward resistance (Fibonacci + EMA confluence) before the next impulsive bearish leg.
The plan is to sell from the premium zone with confirmation, aiming for 198.79 as the target point.
---
Key Components
1. Market Structure
GBP/JPY recently made a strong impulsive drop, confirming a bearish trend.
The current upward movement is viewed as a corrective retracement, not a reversal.
The analysis expects the pullback to form a lower high around the resistance zone before dropping again.
2. Fibonacci Retracement Zone
The highlighted blue zone (0.62–0.79 Fibonacci levels) marks the premium sell area.
The red arrow indicates the anticipated reaction point — likely near the 0.705 level.
This zone coincides with previous support-turned-resistance, adding confluence.
3. EMA Confluence
50 EMA (200.905) and 200 EMA (201.665) are both above price, sloping downward — confirming bearish momentum.
Price is projected to retest these EMAs, which will likely act as dynamic resistance before rejection.
4. Projected Path
The drawn path shows price retracing upward, hitting the 0.705 Fibonacci level, then reversing strongly downward.
The target zone at 198.79 aligns with a previous demand zone and measured move projection from the earlier impulse.
Mr SMC Trading point
---
Summary
Market bias: Bearish
Setup type: Retracement sell / Trend continuation
Sell zone: 0.62–0.79 Fibonacci retracement (≈ 200.90–201.70 area)
Target point: 198.79
Confirmation: Bearish rejection from the blue zone (candlestick pattern or structure break)
Invalidation: Break and close above 201.80
---
please support boost 🚀 this analysis

GBPJPY Potentially BearishLooking at the charts, it can be said that OANDA:GBPJPY was in a wide gap consolidation for some time and with this recent breakout, price is attempting a retest of the lower side indicating a potential bearish move. I will however want to see the new found resistance hold and also give a confirmation on the sell before jumping on the train with targets at 197.782 as TP 1 and 193.920 as TP 2
NB: Results are not typical, past results does not guarantee future results, do your due diligence

GBP/JPY) Bearish trend analysis Read The captionSMC Trading point update
technical analysis of updated GBP/JPY (1H) chart 👇
---
Market Bias: Bearish Continuation
Price is still respecting the descending channel and is currently in a corrective phase toward a key supply and confluence zone. The setup suggests another potential lower high forming before continuation to the downside.
---
Technical Breakdown:
1. Descending Channel Structure
Price remains within a clear bearish channel, creating consistent lower highs and lower lows.
The recent bullish push appears to be a corrective leg rather than a reversal.
2. EMA Dynamic Resistance
The 50 EMA (200.81) and 200 EMA (201.86) are both acting as dynamic resistance.
The zone between these EMAs aligns perfectly with the Fibonacci retracement (0.62–0.79) — a strong area for potential reversal.
3. Fibonacci Retracement
Current retracement is testing between the 0.62 (201.0) and 0.79 (201.8) levels.
This Fibonacci zone overlaps with previous structure and EMAs — forming a confluence zone for possible bearish rejection.
4. Liquidity Sweep Potential
A minor push above the 0.705–0.79 zone may grab liquidity before reversing.
This setup hints at a fakeout spike followed by a bearish impulse continuation.
5. Target Zone
The next projected move aims for the 198.820 target area, matching the previous swing low and channel support.
---
Trade Plan Idea:
Entry Zone: 201.0 – 201.8 (0.62–0.79 retracement & EMA confluence)
Confirmation: Bearish candle formation or lower timeframe BOS (Break of Structure)
Stop-Loss: Above 202.0 (beyond liquidity sweep area)
Take-Profit:
TP1: 200.0 (psychological level)
TP2: 198.8 (target zone)
---
Notes:
Maintain patience for clear rejection signs at the 201.0–201.8 zone before entering.
The overall bearish channel remains intact — bias stays bearish until a clean break and close above 202.0 occurs.
Avoid chasing the move early; wait for a liquidity grab confirmation.
Mr SMC Trading point
Summary:
GBP/JPY remains bearish within the descending channel. Price is currently in a pullback toward the 0.62–0.79 retracement zone near 201.8, where strong resistance is expected. A rejection from this area could trigger the next bearish leg toward 198.8.
Please support boost 🚀 this analysis

GBPJPY I Short-term scalp and intraday set up from resistanceWelcome back! Let me know your thoughts in the comments!
** GBPJPY Analysis - Listen to video!
We recommend that you keep this on your watch list and enter when the entry criteria of your strategy is met.
Please support this idea with a LIKE and COMMENT if you find it useful and Click "Follow" on our profile if you'd like these trade ideas delivered straight to your email in the future.
Thanks for your continued support!

GBP/JPY | Bearish Bias Below Pivot ZoneThe market currently maintains a Bearish Bias (a tendency for the price to fall) as the pair has stabilized below the Pivot at 201.22. Stability below this level signifies seller dominance.
The analysis suggests a corrective move (a temporary bounce) might occur back towards the $201.22$ Pivot to test it as strong Resistance (an upper barrier), before any further decline resumes.
Primary Scenario: Bearish Continuation (While Below 201.22)
As long as the price remains below the $201.22$ Pivot level:Bearish momentum is expected to extend.
The downside potential is maintained, and traders will target the following Support (Lower Support Line) levels:
- Initial Target: $199.29
- Intermediate Target: $198.01
- Main Target: $196.15$
In essence, if $201.22$ holds as Resistance, selling pressure is likely to push the price towards these lower support levels.
Alternative Scenario: Bullish Reversal (Above 201.22)
If a convincing breakout and stabilization occurs above the $201.22$ Pivot level:This condition could signal a Bullish reversal (a tendency for the price to rise).
Market momentum would shift to the upside, opening the path towards the next Resistance (Upper Barrier Line) levels:
- Initial Upside Target: $203.43
- Further Upside Target: $204.88
