GBP/JPY Traders, Don’t Miss This 200 SMA Bullish Setup!🎯 GBP/JPY "Guppy" Bullish Momentum Play | SMA-200 Pullback Setup 🚀
📊 Market Overview
Asset: GBP/JPY (Cable vs Yen Cross)
Nickname: "The Guppy" 🐟
Trade Type: Swing/Day Trade Hybrid
Bias: BULLISH 📈
🧠 Technical Analysis
The Setup 🎯
We're eyeing a textbook pullback to the 200 SMA — the institutional magnet that's been holding the bullish structure intact. Price is showing respect at this dynamic support level, and we're positioning for the next leg up.
Key Technical Confirmations:
✅ 200 Simple Moving Average acting as dynamic support
✅ Bullish market structure intact on higher timeframes
✅ Momentum favoring upside continuation
✅ Risk-to-reward setup looking juicy
💰 The "Thief Strategy" Entry Method 🎭
Entry Philosophy: Multiple limit orders (layering style) to scale into position like a pro. Think of it as "catching the falling knife" but with style and risk management!
🎯 Entry Zones (Pick Your Poison):
Layer 1: 201.000
Layer 2: 201.500
Layer 3: 202.000
Layer 4: 202.500
You can add more layers based on your risk appetite and account size. The goal? Average in as price tests support!
🛡️ Stop Loss:
Thief's SL: 200.500
⚠️ Risk Disclaimer: This is MY stop level based on my strategy. You're the captain of your ship — set your own stops based on YOUR risk tolerance. Don't blindly follow; adapt to your own trading plan!
🎯 Take Profit Target:
TP Zone: 206.500
Why this level?
Strong resistance confluence ⛔
Potential overbought conditions 📊
Bull trap zone identified
💡 Smart Exit Strategy: Lock in profits progressively! Consider taking partials along the way. Remember, "you can make money, then TAKE money" — don't get greedy!
🔗 Correlated Pairs to Watch
Keep an eye on these for confirmation:
Direct Correlations:
OANDA:EURJPY 💶💴 — Sister pair, similar yen exposure
OANDA:AUDJPY 🦘💴 — Risk-on sentiment gauge
FX:GBPUSD 💷💵 — Cable strength indicator
Inverse Correlations:
FX:USDJPY 💵💴 — Yen strength/weakness
TVC:DXY (US Dollar Index) 💵 — Overall dollar sentiment
Pro Tip: If EUR/JPY and AUD/JPY are also bouncing from support, it confirms broad yen weakness = stronger Guppy setup! 🐟📈
🎓 Key Points to Remember
SMA-200 Respect: This ain't just any moving average — institutions watch this level religiously
Layering = Risk Management: Don't YOLO your entire position at one price
Yen Pairs Move Together: Watch the JPY crosses for confirmation
Patience Pays: Let price come to YOUR levels, don't chase
Profit Taking is a Skill: Nobody went broke taking profits! 💰
⚖️ Risk Management Reminder
Position size according to your account (1-2% risk max recommended)
Each layer should be smaller portions of your total planned position
Adjust stops to breakeven after Layer 1 fills and price moves in your favor
Trail your stop as price approaches target
🎬 Final Thoughts
The Guppy is setting up nicely for a bounce play off the SMA-200. This is a patience game — let the market come to you, execute the plan, and manage risk like a professional thief (the good kind 😉).
Remember: This is swing/day trade hybrid, so don't expect instant gratification. Give the setup room to breathe!
✨ If you find value in my analysis, a 👍 and 🚀 boost is much appreciated — it helps me share more setups with the community!
#GBPJPY #Guppy #ForexTrading #SwingTrading #DayTrading #TechnicalAnalysis #SMA200 #PullbackStrategy #ThiefStyle #ForexSignals #TradingSetup #PriceAction #RiskManagement #ForexCommunity #TradingIdeas #JPYCross #BullishSetup #ForexStrategy #TradingView #ChartAnalysis
Gbpjpysignal

GBPJPY: Bullish Impulse May Take Price To 205! 700+ Pips MoveGBPJPY is in steady bullish move in other words it is in impulse move; price has not yet exhausted and there is still extended bullish move to completed before bears takes control over. Please use accurate risk management while trading and do your own analysis.
LIKE
COMMENT
SHARE
Good luck.
Team Setupsfx_

GBPJPY Analysis todayHello traders, this is a complete multiple timeframe analysis of this pair. We see could find significant trading opportunities as per analysis upon price action confirmation we may take this trade. Smash the like button if you find value in this analysis and drop a comment if you have any questions or let me know which pair to cover in my next analysis.

#GBPJPY: Upto 1000+ Pips Buying Setup! Two Areas Dear Traders,
We have two areas from which the price could significantly reverse. The first entry is at the current price with proper risk management, while the second entry can be made when the price undergoes a major correction. Please ensure accurate risk management while trading.
Thank you for your support throughout!
Team Setupsfx_

GBPJPY Bearish Breakout !
HI,Traders !
#GBPJPY made a bearish
Breakout of the key horizontal
Level of 198.182 and the
Breakout is confirmed so
We are bearish biased and
We will be expecting a
Further bearish move down !
Comment and subscribe to help us grow !

GBPJPY – Calm Before the Storm: 200-Pip Range About to Break1. Market Context
For the past 6 weeks, GBPJPY has been trapped in a narrow 200-pip range between 200.50 and 198.50. This is unusual for such a volatile pair, and historically, when GBPJPY compresses like this, the eventual breakout tends to be explosive.
________________________________________
2. Distribution or Accumulation?
In my view, this is not healthy consolidation but rather distribution. The market looks heavy, and every test of support adds pressure on the downside.
________________________________________
3. Technical Perspective
• The pair is pressing against support.
• A clean break below here opens the door for an immediate 300-pip drop.
• For a larger swing move, the downside target extends much deeper – towards the 188.00 zone, which is the next major support level.
________________________________________
4. Trading Bias
As long as 200.00 holds as resistance, my bias remains bearish.
The longer the range persists, the bigger the breakout that will follow — and in this case, I believe it will be to the downside.
________________________________________
5. Conclusion
GBPJPY has been unusually quiet, but pressure is building. Once support breaks, the move could be fast and violent, in classic GBPJPY style.

GBP/JPY – Bullish Channel Bounce Setup with High R:R1. Chart Pattern
Price is moving inside a descending channel (highlighted in pink).
Currently, price is near the lower boundary of the channel, suggesting possible support.
2. Entry, Stop Loss & Target
Entry Point: Around 199.390
This is placed slightly above the lower support of the channel, anticipating a bounce.
Stop Loss: Around 199.180
This is just below the support zone, keeping risk tight.
If price drops below this, it means the bullish idea is invalidated.
Target Point: Around 200.977
This is close to the upper range of the recent price action, giving a good risk-to-reward ratio.
3. Trade Idea
This setup is a buy (long) position plan:
Reasoning: Buying near support of the descending channel, expecting price to break out upwards.
Risk-to-Reward: Looks favorable (roughly 1:6), which is a strong risk management setup.
4. Key Levels to Watch
199.390 (Entry) → If price sustains above this, bulls are in control.
199.180 (Stop) → If price breaks below, expect further downside.
200.977 (Target) → This is the take-profit area, near prior resistance.
---
5. Confirmation Needed
Wait for a bullish candle confirmation at the entry zone (e.g., pin bar, engulfing candle) to reduce risk of false breakout.
Keep an eye on overall trend — if higher timeframes show strong downtrend, be cautious of reversals.
✅ Summary:
This chart suggests a buy setup from support zone with tight stop-loss and a large upside target. It’s a high risk-to-reward trade but requires confirmation before entering to avoid getting caught in a further drop.

GBPJPY - Can Bulls Overpower BoJ Hawkishness?🔶 GBP/JPY Price Outlook – Trade Setup
📊 Technical Structure
GBP/JPY rebounded from the 199.32–199.27 support zone, reclaiming ground above 199.45. Price is now approaching the 199.71–199.78 resistance area, which aligns with prior rejection levels and trendline pressure. Momentum remains constructive, but upside may face headwinds given BoJ’s hawkish stance.
📈 Trade Setup
Entry (Buy): 199.27–199.32
Stop Loss: 199.25
Take Profit: 199.71–199.78
Risk/Reward (R:R): ~1 : 5.88
🔑 Key Technical Levels
Resistance: 199.71 / 199.78
Support: 199.32 / 199.27
🌍 Macro Background
The BoE’s cautious stance on rate cuts continues to lend support to Sterling, while expectations for a BoJ rate hike later this year underpin the Yen. Political uncertainty in Japan may delay policy normalization, keeping the pair supported near-term, though hawkish BoJ risks could cap the upside.
📌 Trade Summary
GBP/JPY intraday bias is mildly bullish while above 199.27 support, targeting 199.71–199.78. However, bulls should be cautious of resistance pressure from the BoJ side, which could trigger a sharp rejection if tested.
⚠️ Disclaimer:
This analysis is for reference only and does not constitute trading advice. Trading involves significant risk, and proper risk management is essential.

GBPJPY BUYS LOADING quick scalp buys on gj ... trend is still bearish but heres a quick entry area to catch a potential reversal ...

GBPJPY 4H Analysis – Bears Gaining Control Below 199.00GBPJPY has been showing signs of weakness after failing to sustain above the 200.200 resistance zone. On the 4H chart, price has been making lower highs while struggling to stay above the 199.000 psychological level, indicating that the bears are slowly taking over momentum.
Currently, price is trading around 198.350, right at a crucial support area. A clean break and close below 198.000 could open the doors for further downside towards 196.500 – 195.800 zone.
🔹 Zig Zag Indicator confirms the recent shift in structure with a visible descending trendline.
🔹 RSI (14) is hovering around the 40–45 zone, suggesting weakening bullish momentum and room for more bearish pressure.
🔹 Key support sits at 198.000, while immediate resistance remains at 199.500 – 200.200.
📊 Trading Plan
Bearish Bias: Below 198.000, targets at 196.500 / 195.800.
🔻 Break below 198.000 → Targets 196.500 – 195.800
🔼 Only above 200.200 → Bulls may regain strength toward 202.000
Risk management is key! ⚠️
Bullish Scenario: Only a strong breakout above 200.200 with volume can re-ignite bullish momentum towards 202.000+.
⚠️ Always manage risk and watch out for volatility around GBP and JPY economic events.

GBPJPY H4 SELL I choose Gbjpy for sell Trade
Entry Point : 199.500
SL : 200.300
TP : 198:500 , 196.00
Trendline Breakout , Resistance H4 Strong 💪
Stay Here Follow Us For More Trades And Education

GBPJPY – Critical Zone Between 199 and 200Last week, I mentioned that I was watching both GBPJPY and EURJPY closely, as a strong drop could be just around the corner.
Given its higher volatility, I chose to open a short on GBPJPY, which I closed Friday with a negligible profit after the pair reversed once more from just under 199.
Despite that, my overall outlook hasn’t changed – in fact, it has been reinforced by yet another failed attempt to conquer the 200 zone.
📌 Trading Plan:
- I’m looking to re-enter short on GBPJPY.
- My initial target remains the 195 zone.
- Confirmation: A daily close under 199 would signal that a top is likely in place.
- Negation: If the market stabilizes above 200, this bearish scenario is off the table.
In other words, GBPJPY is at a critical juncture – either it confirms the top and accelerates lower, or the 200 level finally gives way.
That being said, I’m prepared for the short side. 🚀
Disclosure: I am part of TradeNation's Influencer program and receive a monthly fee for using their TradingView charts in my analyses and educational articles.

GBPJPY - ShortGBPJPY Analysis - SELL 👆
In this Chart GBPJPY H4 Timeframe: By Nii_Billions.
❤️This Chart is for GBPJPY market analysis.
❤️Entry, SL, and Target is based off our Strategy.
This chart analysis uses multiple timeframes to analyze the market and to help see the bigger picture on the charts.
The strategy uses technical and fundamental factors, and market sentiment to predict a BEARISH trend in GBPJPY, with well-defined entry, stop loss, and take profit levels for risk management.
🟢This idea is purely for educational purposes.🟢
❤️Please, support our work with like & comment!❤️

GBP/JPY Long Attack After MA Breakout – Loot the Beast!🔓 GBP/JPY Bullish Break-In Heist! 💷💣 Price Cracked the MA Vault 🎯
🏴☠️ Welcome to the GBP/JPY Treasure Run!
Thief Trader’s back in the FX vault—this time we’re after the Beast Pair. A clean moving average breakout just unlocked the vault at 196.900, and we’re going in heavy with layered long entries!
📈 Heist Blueprint:
Asset: GBP/JPY
🧭 Plan: Bullish (Price has broken key MA level)
🎯 Entry: ANY price above 196.900 (after MA breakout confirmation)
📉 Stop Loss: 195.000 (secure the backdoor)
💰 Target: 199.500 (clean getaway zone)
🔫 Entry Method: Limit orders stacked like trapdoors — Thief’s layering strategy in motion!
💼 Strategy Breakdown:
⚔️ Scalp Raiders: Snipe quick profits on the M15-M30 pullbacks.
🛡 Swing Bandits: Ride this bullish wagon up to 199.500. Use trailing SL to stay alive.
📡 Chart Radar: Eyes on volume spikes + MA alignment = green signal for aggressive buys.
🧠 Market Logic Behind the Heist:
🔥 MA breakout confirms buyer strength
🔍 Intermarket flow supports GBP dominance
📊 Sentiment & positioning flip to bullish
💼 Risk events priced in – no traps detected (yet)
🚨 Caution for Rookie Thieves:
News bombs ahead? Lock down with tighter SLs or pause the raid until the dust settles.
💎 Join the Crew of Chart Bandits!
👍 Like this plan? 🔁 Share it.
💬 Drop your view. 💣 Boost it with a 🚀
We're not just trading—we’re robbing the market with style.
🔐 Stay dangerous, stay profitable…
THIEF TRADER OUT. 🏴☠️📉📈

GBP/JPY – Possible False Break Above 200After confirming 195 support at the beginning of August, GBP/JPY posted 7 consecutive daily gains, bringing the pair back to resistance and even spiking above it — briefly crossing the important psychological level of 200.
Today started with a sharp drop, suggesting that the 200+ zone is a significant milestone and hinting at a potential false breakout.
Trading Plan:
I will work with the assumption that GBP/JPY bears will hold firm around 200. The ideal sell zone is near 199.50, with a swing target back to the 195 support area, offering a risk–reward ratio of 1:5.
A sustained move above 200 would invalidate this scenario. 🚀
Disclosure: I am part of TradeNation's Influencer program and receive a monthly fee for using their TradingView charts in my analyses and educational articles.

GBP/JPY 1D Chart - OANDAdaily performance of the British Pound (GBP) against the Japanese Yen (JPY) as of August 12, 2025, with a current value of 199.248 (+0.264 or +0.13%). The chart includes a bullish trendline, a highlighted resistance zone around 203.575, and key support levels at 199.079 and 196.683. Buy and sell signals are marked at 199.259 and 199.236 respectively, with a projected upward movement indicated.

GBPJPY and USDJPY Analysis todayHello traders, this is a complete multiple timeframe analysis of this pair. We see could find significant trading opportunities as per analysis upon price action confirmation we may take this trade. Smash the like button if you find value in this analysis and drop a comment if you have any questions or let me know which pair to cover in my next analysis.

GBPJPY: Bearish Market StructureLook to sell after the correction...
(H4)
✅ Confirmed BOS below 197.20
✅ LHs
✅ Supply Zone: 196.10 – 196.60
(H1)
✅ Nice impulse down from 197.30 to 195.50
✅ Short-Term Supply Zone: 195.90 – 196.20 (H1 OB inside H4)
Looking for price to tap this zone and form a new LH
(M15)
✅ Price consolidating after the drop
✅ No bullish BOS
✅ New LH
Expecting liquidity sweep above 195.90, then bearish BOS below 195.70 to confirm entry
❌ Invalidation: Bullish BOS above 196.70 on M15.

GBPJPY Will Fall!
HI,Traders !
#GBPJPY has retested a
Horizontal resistance level
Of 198.903 so we are
Locally bearish biased
And from the resistance we
We will be expecting a
Local bearish correction !
Comment and subscribe to help us grow !

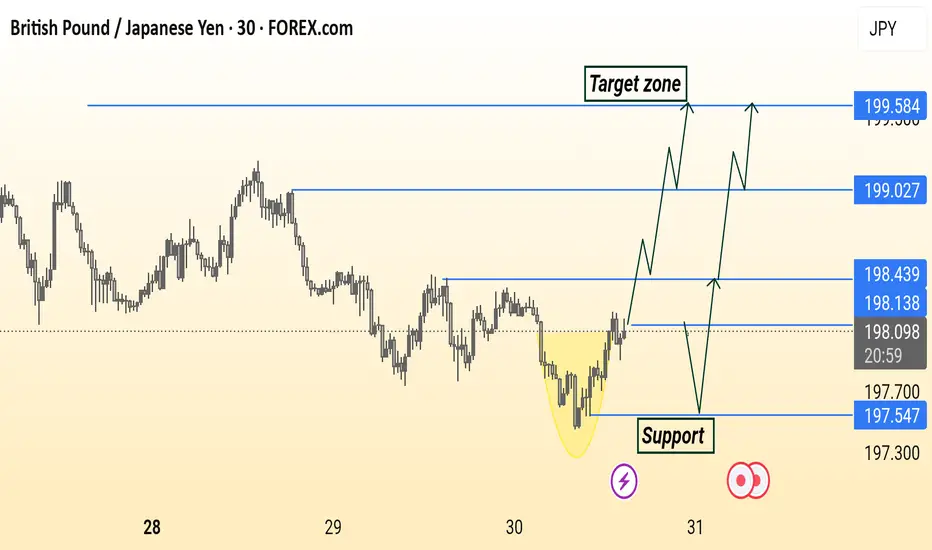
GBP/JPY Analysis is Ready Read The Captions GBP/JPY 30-minute chart shows a potential bullish reversal from a rounded bottom pattern. Price is approaching support around 198.13–197.54, with multiple possible bullish scenarios targeting resistance levels at 198.43, 199.03, and 199.58. The highlighted “Target zone” suggests a continuation if price breaks and holds above key resistance.
British Pound / Japanese Yen - 4h (OANDA)4-hour candlestick chart from OANDA shows the GBP/JPY currency pair's price movement, currently at 199.038 with a decrease of 0.542 (-0.27%). The chart highlights a recent consolidation phase around the 199-200 range, with key levels marked at 201.000, 200.268, 199.038, 198.986, and 198.435. The data reflects trading activity as of 03:08:55.

GBPJPY - 1D SetupThe Japanese yen may get stronger for a while due to the weakening of the British Economy, which may lead to a pullback of the GBPJPY currency, and this seems to be a good trading opportunity in sells with a strict stop-loss. OANDA:GBPJPY
Note- This is my own view and not a financial advice as trading comes with high risk.

British Pound / Japanese Yen (GBP/JPY) 4-Hour Chart Analysis4-hour performance of the British Pound against the Japanese Yen (GBP/JPY) via OANDA data. The current price is 199.352, reflecting a 0.129 (0.06%) increase. The chart highlights a recent upward trend, with key support levels around 198.107 and 198.994, and resistance near 200.415. A breakout above the recent high is indicated, suggesting potential for further gains.
