GBPNZD - Looking To Sell Pullbacks In The Short TermH1 - Strong bearish move.
No opposite signs.
Expecting bearish continuation until the two Fibonacci resistance zones hold.
If you enjoy this idea, don’t forget to LIKE 👍, FOLLOW ✅, SHARE 🙌, and COMMENT ✍! Drop your thoughts and charts below to keep the discussion going. Your support helps keep this content free and reach more people! 🚀
-------------------------------------------------------------------------------------------------------------------
Gbpnzdforecast

GBPNZD: Rebound from Support Hints at Fresh Upside MomentumGBPNZD has defended a major support zone after a sharp pullback, with buyers stepping in to regain control. The structure suggests the recent decline was corrective, and if momentum holds, the pair could climb back toward the mid-October highs. This setup blends technical strength with a macro backdrop still leaning in favor of GBP over NZD.
Current Bias
Bullish – price has rebounded from support, setting up for a recovery phase.
Key Fundamental Drivers
GBP: UK growth remains fragile but inflation pressures keep the BoE cautious on cutting rates too quickly.
NZD: Vulnerable to weak global growth, dairy price softness, and ongoing Chinese trade risks.
Relative Outlook: GBP holds a modest advantage due to stickier inflation compared with NZD’s growth-sensitive profile.
Macro Context
Interest Rates: The BoE is expected to remain cautious with cuts, while the RBNZ is mostly sidelined, limiting NZD’s rate appeal.
Economic Growth: UK growth is slow but steady; NZ’s growth is more exposed to external shocks, especially from China.
Commodity Flows: Dairy weakness caps NZD strength, while GBP is less commodity-dependent.
Geopolitical Themes: Trade tensions and tariffs weigh more heavily on NZD due to its export reliance.
Primary Risk to the Trend
A stronger-than-expected NZ CPI release or a dovish surprise from the BoE could undermine GBP and reverse bullish momentum.
Most Critical Upcoming News/Event
BoE policy updates and UK inflation readings.
RBNZ outlook and NZ CPI data.
Chinese economic releases affecting NZD.
Leader/Lagger Dynamics
GBPNZD is generally a lagger, reflecting moves in GBPUSD and NZDUSD. It tends to follow GBP momentum against the USD, while also being sensitive to risk sentiment through NZD.
Key Levels
Support Levels: 2.3051, 2.2885
Resistance Levels: 2.3328, 2.3519
Stop Loss (SL): 2.2885
Take Profit (TP): 2.3519
Summary: Bias and Watchpoints
GBPNZD is bullish after holding support, with targets set at 2.3328 and 2.3519 while SL protection sits at 2.2885. Fundamentally, sticky UK inflation and weaker NZ growth dynamics support GBP, though surprises in NZ CPI or dovish BoE tones could shift the balance. For now, the bias favors continuation higher, with GBP strength likely to dictate the pair’s direction.

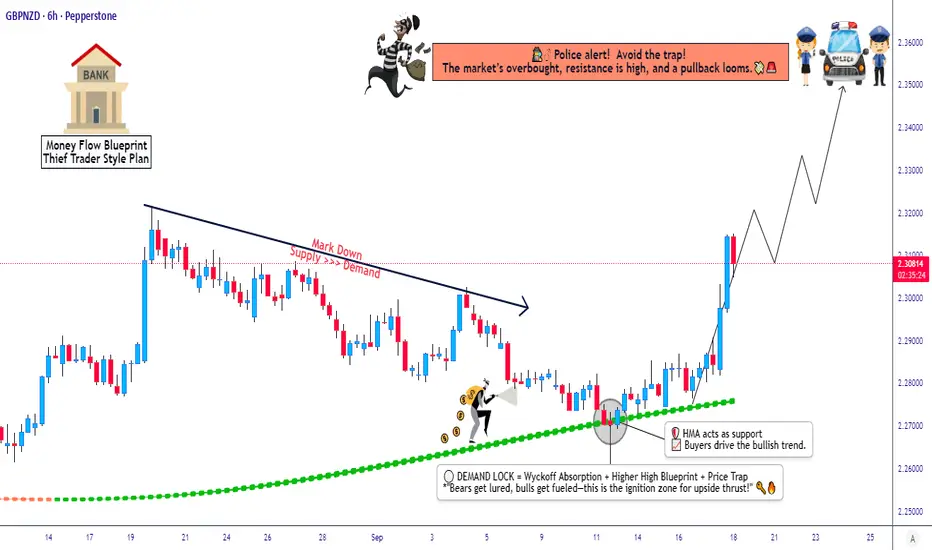
Will Layered Entries on GBP/NZD Pay Off This Week?💷🐑 GBP/NZD – Pound vs Kiwi Dollar Wealth Strategy Map (Swing/Day Trade)
📌 Market Setup
We’re diving into the GBP/NZD forex market, where the Pound squares off against the Kiwi Dollar. The plan is to ride the bullish momentum with a Hull Moving Average retest pullback at the demand zone.
🎯 Trade Plan
Entry Method (Layered Style): Multiple buy limit layers 📥 at
👉 2.29500 | 2.30000 | 2.30500 | 2.31000
(You can increase layers based on your own strategy)
Stop Loss (Risk Management): 2.28500 (recommended thief-style safety net 🛡️)
Target (Take Profit): 2.35500 🎯 — Expect strong resistance + overbought signals = time to escape with profits before the market “police” catch us! 🚨💰
⚠️ Note for Traders:
This is a flexible wealth map, not strict financial advice.
Ladies & Gentlemen (OGs) — your SL/TP is always your choice. Manage your risk like a pro and take money when the market gives it.
🔑 Key Points & Correlations
GBP/NZD tends to move in sync with risk sentiment.
Watch related pairs:
💷 FX:GBPUSD → For overall Pound strength.
🇳🇿 OANDA:NZDUSD → Kiwi momentum & correlation check.
💶 OANDA:EURNZD → Another Kiwi cross for confirmation.
💷 OANDA:GBPAUD → Similar risk-on/off dynamics with commodity currencies.
🧭 Strategy Mindset
This setup is based on layered entries (limit orders), using pullbacks into demand for precision. Combining risk management with patience = potential consistent returns.
✨ “If you find value in my analysis, a 👍 and 🚀 boost is much appreciated — it helps me share more setups with the community!”
#GBPNZD #Forex #TradingStrategy #SwingTrade #DayTrade #ForexCommunity #WealthMap #HullMovingAverage #ForexEducation #GBP #NZD #FX
GBPNZD Long From Rising Support!
HI,Traders !
#GBPNZD is making a
Nice bearish correction
trading but now
The pair is close to the
Rising support line so
After the retest we will
Be expecting a local
Bullish rebound !
Comment and subscribe to help us grow !

What causes a 5% growth in this graph?What appears on the chart is a change in the direction of upward fluctuations!
Now, why should these upward fluctuations or upward prospects appear on the chart, is a question that must be answered over time!
I hope that this time, like the previous analysis, we will reach the desired results with this indicator!
Good luck...

GBPNZD – Second Long Entry from 2.3186 | Targeting 2.4074📈 GBPNZD – Second Long Entry from 2.3186 | Targeting 2.407 4 🏁
Overview:
This is a continuation of the previous bullish idea shared on GBPNZD . After the initial move, price has retraced to a key support zone, offering a second entry opportunity at 2.3186 . The bullish structure remains intact, and this setup offers a strong risk-to-reward potential for swing traders. 📊
🔍 Technical Breakdown:
✅ Trend: Bullish structure remains valid on the Daily and 4H charts
✅ Support Zone: 2.3150–2.3186 acted as demand on the previous leg up
✅ Entry: Long from 2.3186 (second entry as per previous plan)
✅ Target: 2.4074 (same target remains in play)
✅ Stop Loss: Below recent swing low or structural invalidation (~2.3070)
✅ Risk/Reward: 1:8+ depending on SL placement
📌 Confluence Factors:
🔹 Price respecting ascending trendline support
🔹 Clean break and retest of 2.3300 resistance turned support previously
🔹 Momentum indicators show bullish divergence on lower timeframes
🔹 High probability setup on pullback in a trending market
🧠 Trade Management Tips:
Consider scaling in from 2.3186 with partial positions
Monitor price reaction around 2.3400 – a key intraday level
Trail stop or lock in profits as price approaches 2.3700 and 2.3900
Final target at 2.4074 , where strong resistance is expected
📅 Outlook:
As long as price holds above the 2.3100 key support zone, bulls remain in control. A clean break above 2.3400 could confirm momentum resumption. Medium-term traders should watch for continuation patterns like bull flags or breakouts above minor highs.
⚠️ Disclaimer:
This is a technical idea shared for educational purposes only. Always conduct your own analysis and manage risk according to your personal trading strategy. 🛡️

GBPNZD - Looking To Sell Pullbacks In The Short TermH4 - Strong bearish move.
Uptrend line breakout.
No opposite signs.
Currently it looks like a pullback is happening.
Expecting bearish continuation after pullback until the strong resistance zone holds.
If you enjoy this idea, don’t forget to LIKE 👍, FOLLOW ✅, SHARE 🙌, and COMMENT ✍! Drop your thoughts and charts below to keep the discussion going. Your support helps keep this content free and reach more people! 🚀

GBPNZD: 1100+ PIPs Move, Get Ready For Price To Bounce! Hey there everyone
We’re feeling optimistic about GBPNZD and expecting a bullish move that could take it to its previous yearly high. We’ve set three take profit targets, but feel free to adjust them based on your own analysis.
Good luck and trade safely! We really appreciate your unwavering support! ❤️🚀
If you’d like to lend a hand, here are a few ways you can contribute:
- Give our ideas a like
- Share your thoughts in the comments
- Spread the word about our ideas
Cheers,
Team Setupsfx_

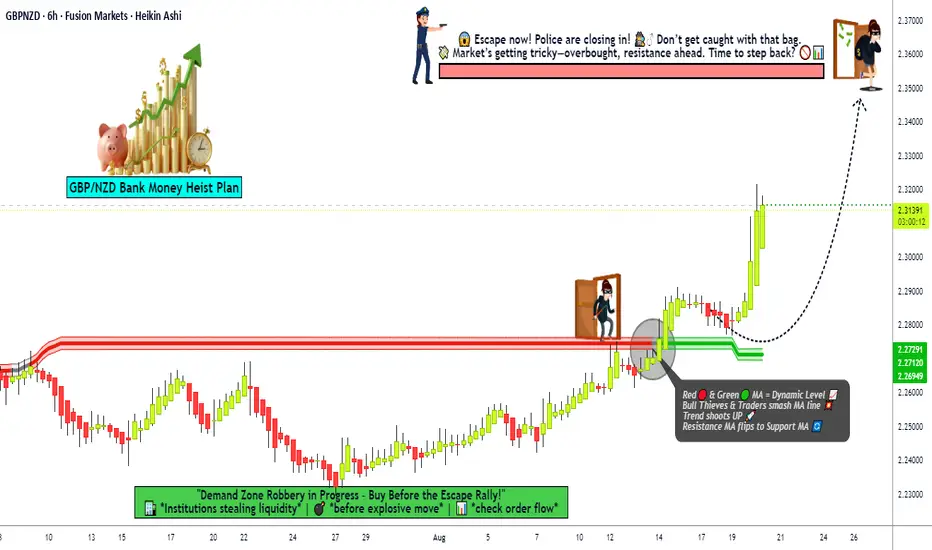
GBP/NZD Heist: Can You Swipe the Bullish Loot?GBP/NZD Sterling vs Kiwi Forex Bank Heist Plan (Swing/Day Trade) 🤑💰💸
🌟 Yo, Thief Traders! 🌟 Ready to pull off the ultimate GBP/NZD heist? Let’s swipe that Sterling vs Kiwi loot with the slickest Thief Trading Style! 🐱👤💪 Based on 🔥technical and fundamental analysis🔥, here’s the master plan to rob this Forex vault blind. Follow the chart, stay sharp, and let’s bag that cash! 💵🚀
Plan: Bullish 📈
🔔 Mission: We’re going LONG, thieves! The market’s ripe for a bullish raid. Get ready to stack those pips! 💰
🔓 ENTRY: SWIPE THE LOOT (LAYERED APPROACH)
The Thief doesn't just kick the door down! We use a precise, layered entry to maximize our haul and minimize risk. Place these BUY LIMIT ORDERS to stack the cash efficiently:
🧨 LAYER 1: 2.31500
🧨 LAYER 2: 2.31000
🧨 LAYER 3: 2.30800
🧨 LAYER 4: 2.30400
🧨 LAYER 5: 2.30000
🛠️ PRO TIP: You can increase your limit layers based on your own capital. More layers = bigger score!
Stop Loss 🛑
🚨 Thief SL: Set at 2.29000. Dear Ladies & Gentlemen (Thief OGs), adjust your SL based on your strategy, lot size, and risk tolerance. Stay sneaky, not sorry! 🕴️
Target 🎯
🏃♂️ Escape Plan: The police barricade’s up at 2.35500! Grab your stolen pips and bolt before the cops close in! 🚔💨
Market Intel 📊
💹 Why Bullish? GBP/NZD is primed for a breakout, driven by key technicals and fundamentals. Check the latest COT Report, Quantitative Analysis, Sentimental Outlook, and Intermarket Analysis for the full scoop! 🔗👀
⚠️ Trading Alert: News releases can shake the market like a getaway car chase! 📰
🚫 Avoid new trades during high-impact news.
🛡️ Use trailing stops to lock in profits and protect your loot!
Risk Management 📝
📌 Stay sharp, thieves! Markets move fast. Adjust your plan with real-time data and keep your risk tight. No reckless heists! 🧠
💡 Pro Tip: Monitor macro trends and sentiment to stay one step ahead of the market cops.
Boost the Heist! 🚀
💥 Hit that Boost Button to power up our robbery squad! 💪 Every boost helps us dominate the market and stack that cash. 🤑
🏆 Join the Thief Trading Style crew, make money daily, and live the heist life! 🤝❤️🎉
Stay tuned for the next Forex heist, you slick money makers! 🐱👤💸 Catch you at the next vault! 😎🚀
GBPNZD Long From Support!
HI,Traders !
#GBPNZD made a retest
Of the horizontal support
Level of 2.27355 and we
Are already seeing a local
Bullish rebound so we will
Be expecting a further
Bullish move up !
Comment and subscribe to help us grow !

GBPNZD - Short Term Buy IdeaH4 - Strong bullish move.
No opposite signs.
Currently it looks like a pullback is happening.
Expecting further continuation higher until the two Fibonacci support zones hold.
If you enjoy this idea, don’t forget to LIKE 👍, FOLLOW ✅, SHARE 🙌, and COMMENT ✍! Drop your thoughts and charts below to keep the discussion going. Your support helps keep this content free and reach more people! 🚀
--------------------------------------------------------------------------------------------------------------------

GBP/NZD Bullish Trap or Treasure? Watch Breakout!🔥 GBP/NZD “POUND vs KIWI” – Bank Money Robbery Plan 🎭 (Swing/Scalping)
📌 Trade Plan (Thief Strategy Style)
Bias: Bullish 🐂 (Pending Order Plan – watching resistance breakout)
Breakout Entry: ⚡ Above 2.30100 → Set alarm to catch breakout in TradingView alerts.
Layered Entries (Thief Style): Multiple buy limits after breakout confirmation
2.29000 | 2.29300 | 2.29600 | 2.30000 (you can adjust/increase layers as per your own plan).
Stop Loss (Thief SL): @ 2.28400 🛑 (adjust based on personal risk).
Target 🎯: 2.32300 → Police barricade resistance / overbought zone / liquidity trap.
⚠️ Note: Dear Ladies & Gentlemen (Thief OG’s) – TP is your own choice 🚪💰. Take the money when YOU want, at your own risk.
📊 GBP/NZD Market Sentiment Report (Updated: 07 Sept 2025)
Day’s Range: 2.2878 – 2.3017
52-Week Range: 2.0996 – 2.3365
Open: 2.2978 | Previous Close: 2.2980
😰 Fear & Greed Index (Market Sentiment)
Score: 53/100 (Neutral 😐)
Extreme Fear: 14% | Fear: 23% | Neutral: 15% | Greed: 46% | Extreme Greed: 2%
Indicators: Volatility, options activity & safe-haven demand suggest balanced sentiment.
🏦 Fundamental & Macro Score
Interest Rates:
🇬🇧 Bank of England: 4.0%
🇳🇿 Reserve Bank of NZ: 3.0%
1-Year Change: +7.86% 🟢 (GBP strength).
Key Drivers:
UK housing slowdown (mortgage approvals ↑ but construction contracted).
NZ building consents +5.4% in July → NZD resilience.
🎯 Retail & Institutional Sentiment
Retail Traders: Mixed positioning (both bullish & bearish flows).
Institutional Outlook: Cautious → GBP volatility + NZD’s China exposure.
🐂📉 Market Outlook (Medium-Term)
Overall Score: 55% Bullish 🟢
Support Factors: GBP rate advantage.
Risks: UK macro weakness + NZD strength in commodities.
💡 Why This Thief Plan?
✔ Breakout entry with layered buy limits = precision scaling 🎯
✔ Macro favors GBP over NZD (interest rate edge).
✔ Sentiment = neutral (room for breakout move).
✔ Liquidity pockets above → perfect robbery escape zone 🚔💨
🔎 Related FX Pairs to Watch
FX:GBPUSD | OANDA:GBPAUD | OANDA:GBPCAD | OANDA:EURNZD | OANDA:AUDNZD
✨ “If you find value in my analysis, a 👍 and 🚀 boost is much appreciated — it helps me share more setups with the community!”
#GBPNZD #Forex #SwingTrading #Scalping #PriceAction #ThiefStrategy #SmartMoney #BreakoutTrading #ForexCommunity #GBP #NZD

GBPNZD Massive Bullish Breakout!
HI,Traders !
#GBPNZD is trading in a strong
Uptrend and the price just
Made a massive bullish
Breakout of the falling
Resistance line and the
Breakout is confirmed
So after a potential pullback
We will be expecting a
Further bullish continuation !
Comment and subscribe to help us grow !

gbpanzd buy signal Don't forget about stop-loss.
Write in the comments all your questions and instruments analysis of which you want to see.
Friends, push the like button, write a comment, and share with your mates - that would be the best THANK YOU.
P.S. I personally will open entry if the price will show it according to my strategy.
Always make your analysis before a trade

GBPNZD Bullish Breakout!
HI,Traders !
#GBPNZD is trading in an
Uptrend an the pair made a
Bullish breakout of the key
Horizontal level of 2.27094
Which is confirmed so after
A a potential pullback we will
Be expecting a further
Bullish continuation !
Comment and subscribe to help us grow !

GBPNZD Breakout from Consolidation Bullish Momentum BuildingGBPNZD has broken out of its recent consolidation pattern and is showing signs of bullish continuation. Strong GBP fundamentals combined with NZD weakness from global risk-off sentiment and tariffs support this technical move.
Technical Analysis (4H Chart)
Pattern: Breakout from a descending channel with bullish follow-through.
Current Level: 2.2418, trading above the breakout level, confirming momentum shift.
Key Support Levels:
2.2294 – recent breakout support and invalidation point for bulls.
2.2222 – secondary support if a deeper pullback occurs.
Resistance Levels:
2.2500 – near-term resistance and potential target for the breakout.
2.2690 – extended bullish target if momentum continues.
Projection: Likely to continue higher toward 2.2500, with room for 2.2690 if GBP strength persists.
Fundamental Analysis
Bias: Bullish.
Key Fundamentals:
GBP: Supported by BOE’s cautious stance on inflation and the relative resilience of the UK economy.
NZD: Pressured by global tariffs, weaker risk sentiment, and limited domestic growth catalysts.
USD Factor: Fed rate cut expectations indirectly support GBP crosses against risk currencies like NZD.
Risks:
Hawkish surprise from RBNZ could strengthen NZD.
BOE dovish signals could stall GBP upside.
Key Events:
BOE meeting and UK CPI.
RBNZ policy decision.
Risk sentiment trends globally.
Leader/Lagger Dynamics
GBP/NZD is a leader among GBP crosses, with GBP strength and NZD weakness driving momentum. It also aligns with EUR/NZD upside moves, reinforcing the bearish NZD outlook.
Summary: Bias and Watchpoints
GBP/NZD is bullish, having broken consolidation with upside targets at 2.2500 and 2.2690. The main drivers are GBP’s policy support, NZD’s risk-off weakness, and global tariff concerns. Watch for BOE and RBNZ updates as potential volatility triggers.
GBPNZD - Expecting Bullish Continuation In The Short TermH1 - Strong bullish momentum.
No opposite signs.
Until the two Fibonacci support zones hold I expect the price to move higher further.
If you enjoy this idea, don’t forget to LIKE 👍, FOLLOW ✅, SHARE 🙌, and COMMENT ✍! Drop your thoughts and charts below to keep the discussion going. Your support helps keep this content free and reach more people! 🚀
--------------------------------------------------------------------------------------------------------------------

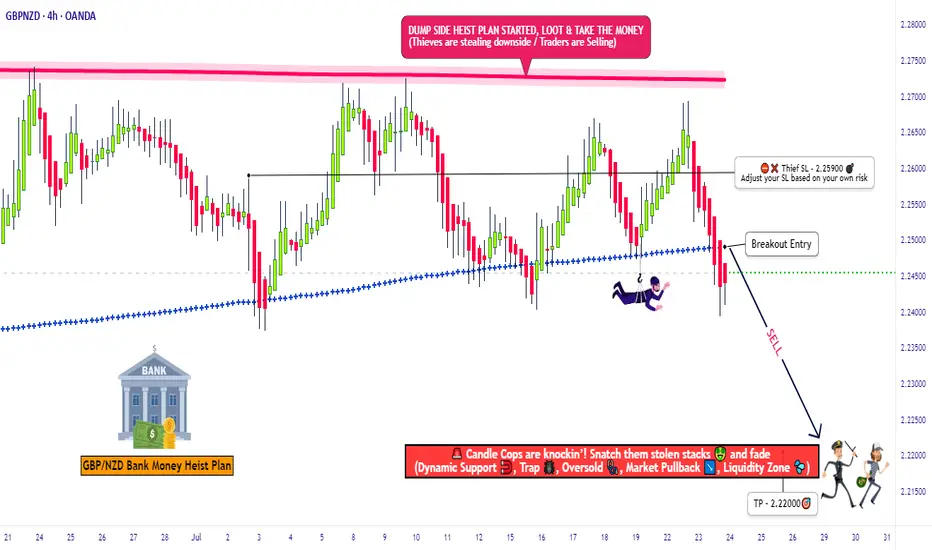
"GBP/NZD: Bearish Storm Brewing – Get Ready!🚨 GBP/NZD HEIST ALERT: "Pound vs Kiwi" Bearish Trap Setup! 🚨 (Scalping/Day Trade)
🌟 Attention, Market Robbers & Profit Pirates! 🌟
🔥 Thief Trading Strategy Activated – Time to short the GBP/NZD like a pro! This pair is setting up for a bearish heist, and we’re locking in entries before the drop. High-risk, high-reward? You bet.
🎯 TRADE PLAN (Bearish Ambush)
Entry Zone (Short) 📉:
Optimal: Sell limit orders on retests (15m/30m timeframe).
Thief’s Trick: Layer entries (DCA-style) near recent highs for max efficiency.
"Enter like a sniper, escape like a ghost." 👻
Stop Loss 🛑:
4H Swing High/Wick (Near 2.25900) – Adjust based on your risk & lot size.
"A smart thief always has an exit route." 🏃💨
Target 🎯: 2.22000 (or escape early if the trap snaps shut!)
💣 WHY THIS HEIST? (Bearish Triggers)
Technical Setup: Oversold bounce? Nah. Consolidation → Reversal trap.
Fundamentals: Weak GBP sentiment? Strong NZD data? Check the news!
Market Psychology: Bulls are getting trapped at resistance—time to fade them.
⚠️ THIEF’S WARNING
News = Volatility Bomb 💣 – Avoid new trades during high-impact events.
Trailing SLs = Your Best Friend – Lock profits & dodge reversals.
💎 BOOST THIS IDEA & JOIN THE HEIST!
🔥 Hit 👍 LIKE, 🚀 BOOST, and FOLLOW for more lucrative robberies!
💸 "Steal the market’s money—before it steals yours." 🏴☠️
🔔 Stay tuned—next heist coming soon! 🔔
GBPNZD Bearish Breakout!
HI,Traders !
#GBPNZD is trading in a strong
Downtrend and the pair
Broke the key horizontal
Level around 2.23918 which
Reinforces our bearish
Bias and we will be
Expecting a further
Bearish move down
On Monday! !
Comment and subscribe to help us grow !

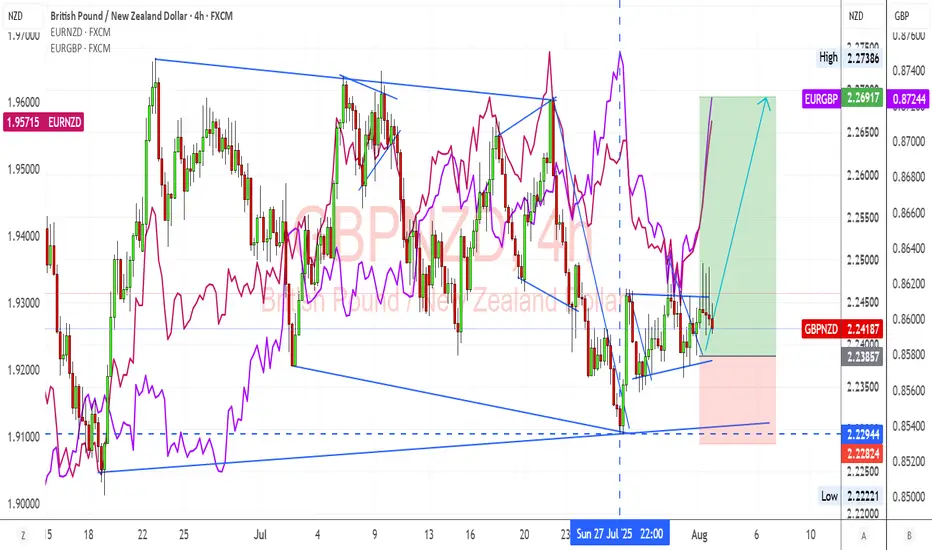
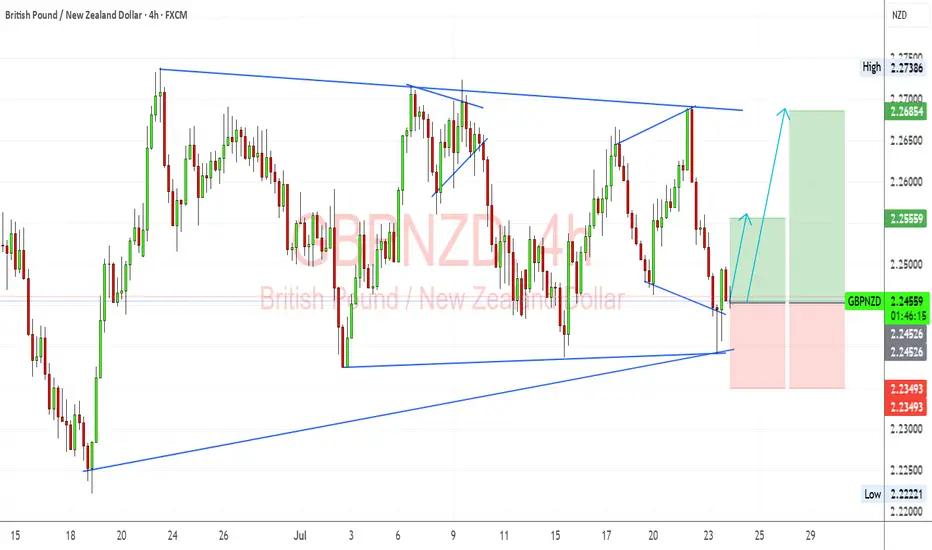
GBPNZD Analysis — 4H Chart ReviewI’m watching GBPNZD for a potential bullish continuation after a successful retest of the long-term ascending trendline. Price rejected near the lower boundary of the symmetrical triangle and showed bullish momentum right off that support. My structure suggests potential upside targets at 2.25559 (minor resistance) and 2.26854 (upper triangle boundary/major resistance zone).
🔍 Fundamental Context:
🇬🇧 GBP Fundamentals:
UK CPI came in softer than expected, and BoE rate cuts are slowly being priced in for late 2025.
However, BoE still sounds relatively hawkish compared to RBNZ due to inflation persistence in services.
Strong UK wage growth and sticky inflation give GBP some near-term yield support.
🇳🇿 NZD Fundamentals:
RBNZ remains on hold, but dovish tilt noted in recent communications.
NZD under pressure from falling dairy prices and weak global growth sentiment (especially China).
Risk-off flows and Fed hawkishness keep NZD vulnerable as a high-beta currency.
⚠️ Risks to the Setup:
A surprise hawkish turn from RBNZ or better-than-expected NZ data could boost NZD.
Renewed UK political instability or weak retail sales data may pressure GBP.
Broader market risk sentiment — NZD may strengthen if risk-on returns and US yields drop.
🗓️ Key News/Events to Monitor:
UK Retail Sales (July 25)
RBNZ Governor Orr Speech (if scheduled)
US PCE (for global risk impact)
Chinese macro data (indirect NZD driver)
🔁 Leader/Lagger Perspective:
GBPNZD often leads EURNZD during GBP-specific catalysts (BoE speeches, UK CPI).
It lags NZDUSD and NZDCAD when risk sentiment or commodity cycles dominate.
📌 Summary: Bias and Watchpoints
I'm bullish on GBPNZD in the short term, especially after a strong trendline retest and recovery off the 2.2450 zone. Fundamentals support GBP resilience over NZD due to relatively hawkish BoE stance and weaker New Zealand data. The main risk to this setup would be a dovish BoE surprise or strong NZ commodity-led rebound. I'll be watching UK Retail Sales and general risk sentiment closely. This pair can act as a leader during UK-specific news but becomes a lagger when risk flows dominate broader NZD direction.
gbpnzd buy signal. Don't forget about stop-loss.
Write in the comments all your questions and instruments analysis of which you want to see.
Friends, push the like button, write a comment, and share with your mates - that would be the best THANK YOU.
P.S. I personally will open entry if the price will show it according to my strategy.
Always make your analysis before a trade
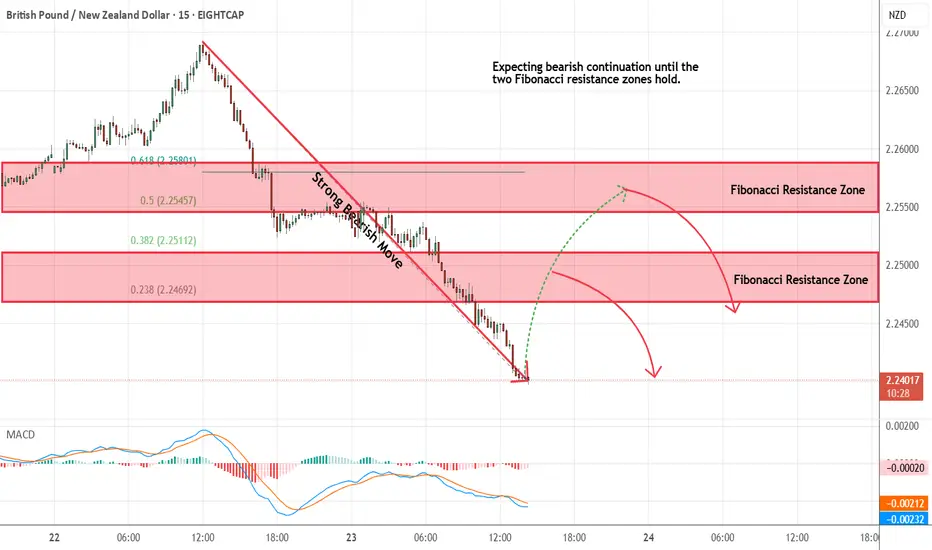
GBPNZD - Looking To Sell Pullbacks In The Short TermM15 - Strong bearish move.
No opposite signs.
Expecting bearish continuation until the two Fibonacci resistance zones hold.
If you enjoy this idea, don’t forget to LIKE 👍, FOLLOW ✅, SHARE 🙌, and COMMENT ✍! Drop your thoughts and charts below to keep the discussion going. Your support helps keep this content free and reach more people! 🚀
-----------------------------------------------------------------------------------------------------
GBPNZD – Waiting for Price to Reach the ZoneWe’re currently waiting for price to reach our key level.
Once it does, and we see a valid buy signal, we’ll enter a long position.
🔄 All scenarios remain active.
Those who follow my analyses regularly already know the flow —
so no need to repeat the full breakdown.
As always, we don’t predict – we react to price.
We’re not here to guess what the market will do,
we’re here to manage our risk and trade what we see.
