GER30 H4 | Bearish Drop OffBased on the H4 chart analysis, we can see that the price has rejected off our sell entry level at 25,497.21, which aligns with the 161.8% FIbonacci extension and the 100% Fibonacci projection.
Our stop loss is set at 25,750, which aligns with the 78.6% Fibonacci projection.
Our take profit is set at 24,883.95, whic is a pullback support that aligns with the 38.2% Fibonacci retracement.
High Risk Investment Warning
Stratos Markets Limited (
GER30 CFD

Germany40 (GER40) – 30-Minute Timeframe Tradertilki AnalysisMy friends, greetings,
I have prepared a Germany40-GER40 analysis for you.
If GER40 reaches the levels of 25374.95-25339.21 on the 30-minute timeframe, I will open a buy position.
My target will be the 25513.48 level.
My friends, I share these analyses thanks to each like I receive from you. Your likes increase my motivation and encourage me to support you in this way.🙏✨
Thank you to all my friends who support me with their likes.❤️

Dax - Short Term Buy IdeaH1 - Strong bullish momentum.
No opposite signs.
Until the two Fibonacci support zones hold I expect the price to move higher further.
If you enjoy this idea, don’t forget to LIKE 👍, FOLLOW ✅, SHARE 🙌, and COMMENT ✍! Drop your thoughts and charts below to keep the discussion going. Your support helps keep this content free and reach more people! 🚀
--------------------------------------------------------------------------------------------------------

DAX - Up for nowCounting waves and assessing technical potential. Here’s what we see:
October 2020 - Completed the correction and started forming the 5th wave of the uptrend.
November 2025 - Making the final push, forming the last sub-wave 5 within the larger wave.
Key reversal level sits near 28,300 .
Note: this level coincides with the Fibonacci levels where the first wave ended in March 2000 .
Key targets:
Trend reversal expected at 28,300
Local correction at 26,900
Additional reversal points at 29,300 / 31,200
---
Please subscribe and leave a comment!
You’ll get new information faster than anyone else.
---

GER30 H4 | Bullish Momentum To Extend FurtherBased on the H4 chart analysis, we could see the price fall to our buy entry at 24,474.21, which is a pullback support that 23.6% Fibonacci retracement.
Our stop loss is set at 24,195.24, which is a pullback support that aligns with the 61.8% Fibonacci retracement.
Our take profit is set at 24,786.98, which is a swing high resistance that is slightly below the 161.8% Fibonacci extension.
High Risk Investment Warning
Stratos Markets Limited (

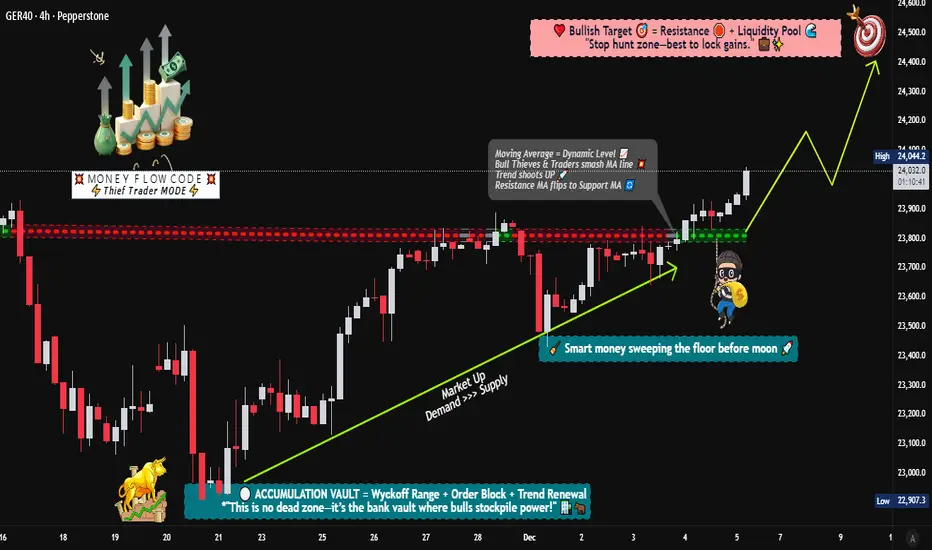
DAX40 Momentum Shift: Layered Buy Setup for Clean Profit Flow🚀 DAX40 (GER40) BULLISH BREAKOUT ALERT! | Layer Strategy for MAX Gains 🚀
📈 DAX40 BULLISH BREAKOUT CONFIRMED! 🏆 (Swing/Day Trade Setup with Layer Entry)
📊 Idea: Strong bullish momentum on the GER40 / DAX 40 following a decisive breakout above key moving averages! Perfect setup for a structured "thief-style" layered entry to capitalize on the trend.
🔑 KEY LEVELS & PLAN:
Trend: Bullish (MA Breakout Confirmation)
Entry Strategy: "Thief" Layer Method 🎯
Use multiple BUY LIMIT orders at key dips: 23,600 | 23,700 | 23,800 | 23,900 (Add more layers based on your capital).
This averages your entry and maximizes opportunity on pullbacks.
Stop Loss (SL): 23,400 (Thief OG's Zone ⚠️).
IMPORTANT NOTE: Adjust your SL based on YOUR risk tolerance & strategy! This is a guide, not financial advice. Protect your capital.
Take Profit (TP): Target Zone: 24,500 🎯
Strong resistance & potential overbought trap area. Secure profits wisely!
REMINDER: Manage your own TP. Take money at your own risk.
💎 PRO TRADER NOTES:
This "thief" layer strategy requires patience & discipline. Let the market come to your orders. Never risk more than 1-2% per layer. Trade with a plan, not emotion!
🌍 RELATED PAIRS TO WATCH (KEY CORRELATIONS):
FX:EURUSD : INVERSE Correlation. A stronger Euro can pressure DAX (export-heavy index). Watch for USD weakness supporting DAX rallies.
CAPITALCOM:US30 (Dow Jones) / SP:SPX (S&P 500): POSITIVE Correlation. US market strength often lifts European indices. Key for overall risk sentiment.
ICMARKETS:STOXX50 (Euro Stoxx 50): HIGH Correlation. Broader European index performance.
BUND Futures (/FGBL): INVERSE Correlation. Rising German bond yields (falling prices) can signal economic optimism, often supporting DAX.
EUR/GBP ( OANDA:EURGBP ): UK/EU economic relative strength flows.
👇 LIKE & FOLLOW if you found this useful!
💬 COMMENT your entry levels or chart insights below!
🔔 Click the BELL on my profile for real-time idea alerts!
#DAX #GER40 #TradingView #Breakout #Bullish #SwingTrading #DayTrading #LayerStrategy #TradingPlan #Forex #Indices #Investing #Stocks #ThiefStrategy #EURUSD
GER30 H4 | Bullish Momentum To ExtendMomentum: Bullish
The price has bounced off the buy entry, which aligns with the 38.2% Fibonacci retracement.
Buy entry: 24,207.41
Pullback support
38.2% Fibonacci retracement
Stop loss: 24,088.31
Pullback support
61.8% Fibonacci retracement
Take profit: 24,476.05
Multi swing high resistance
Stratos Markets Limited (tradu.com ), Stratos Europe Ltd (tradu.com ):
CFDs are complex instruments and come with a high risk of losing money rapidly due to leverage. 70% of retail investor accounts lose money when trading CFDs with this provider. You should consider whether you understand how CFDs work and whether you can afford to take the high risk of losing your money.
Stratos Global LLC (tradu.com ): Losses can exceed deposits.
Please be advised that the information presented on TradingView is provided to Tradu (‘Company’, ‘we’) by a third-party provider (‘TFA Global Pte Ltd’). Please be reminded that you are solely responsible for the trading decisions on your account. Any information and/or content is intended entirely for research, educational and informational purposes only and does not constitute investment or consultation advice or investment strategy. The information is not tailored to the investment needs of any specific person and therefore does not involve a consideration of any of the investment objectives, financial situation or needs of any viewer that may receive it. Past performance is not a reliable indicator of future results. Actual results may differ materially from those anticipated in forward-looking or past performance statements. We assume no liability as to the accuracy or completeness of any of the information and/or content provided herein and the Company cannot be held responsible for any omission, mistake nor for any loss or damage including without limitation to any loss of profit which may arise from reliance on any information supplied by TFA Global Pte Ltd.

Germany 40 Bullish Bias | Buy the Dip Strategy📌 GER40 / DAX40 — Germany 40 Bullish Swing Trade Playbook
🇩🇪 ASSET OVERVIEW
📊 GER40 / DAX40 (Germany 40 Index)
🕰️ Trade Type: Swing Trade
💼 Market: European Equity Index CFD
🔍 The DAX40 represents Germany’s top 40 blue-chip companies, making it highly sensitive to:
🇪🇺 Eurozone economic sentiment
🏭 Industrial & export demand
🇺🇸 US equity market direction
🧠 MARKET STRUCTURE ANALYSIS
🟢 Overall Bias: BULLISH
📈 Why Bullish?
✅ Higher highs & higher lows intact
✅ Price holding above key dynamic support
✅ Buyers stepping in on every dip
📌 This confirms trend continuation, not reversal.
📉 TECHNICAL CONFIRMATION
📐 Indicator Used: HULL Moving Average (HMA)
🔑 Why HULL MA matters?
⚡ Faster than EMA & SMA
📊 Reduces lag during strong trends
🔁 Excellent for pullback entries
🟢 Current Condition:
✔️ Price has pulled back into the HULL MA
✔️ No structure break
✔️ Indicates healthy correction, not weakness
🎯 ENTRY STRATEGY (DETAILED)
📌 Entry Method: Any Price Level (Layering Allowed)
🧩 Thief Strategy – Layered Buy Orders
This strategy spreads risk and improves average entry.
🟢 Buy Limit Layers
🟩 23900
🟩 24000
🟩 24100
🟩 24200
📌 Why Layering Works?
🧠 Reduces emotional entries
📉 Handles volatility smoothly
📊 Improves risk-to-reward ratio
⚠️ You may add or reduce layers depending on capital size and risk rules.
🛑 STOP LOSS LOGIC
🔴 Reference Stop Loss: 23700
🧠 Why this level?
📉 Below recent swing structure
❌ Break below = bullish structure invalid
🛡️ Protects capital if trend fails
⚠️ Important Reminder
❗ This SL is not mandatory
❗ Adjust SL based on:
Account size
Risk percentage
Personal strategy
🏁 TARGET & EXIT ZONE
🎯 Primary Target: 24700
🚨 Why Take Profits Here?
🚓 “Police Force Zone” → Strong historical resistance
📊 Overbought conditions expected
High probability of bull trap / profit booking
📌 Smart traders exit into strength, not greed.
🔗 RELATED MARKETS & CORRELATION ($ WATCHLIST)
🇺🇸 US30 / Dow Jones
🔗 Strong Positive Correlation
Both driven by industrial & manufacturing sectors
Dow strength = confidence for DAX upside
🇺🇸 NAS100
⚡ Risk-On Indicator
Tech rallies improve global risk sentiment
Supports European indices indirectly
🇫🇷 FRA40
🌍 Regional Confirmation
Confirms broader Eurozone equity strength
Weak FRA40 = caution for DAX longs
💶 EUR/USD
💱 Inverse Sensitivity
📈 Strong EUR → pressure on German exporters
📉 Weak EUR → boosts DAX upside
📌 Always monitor EUR moves before major DAX pushes.
⚠️ RISK DISCLOSURE
❗ This idea is educational, not financial advice
❗ SL & TP are reference levels only
❗ You control your own risk & execution
👍 ENGAGEMENT CALL
💙 Like if this helps
💬 Comment your bias
⭐ Save for later
🔔 Follow for structured index setups

GER30 H4 | Bearish Drop Off Pullback ResistanceMomentum: Bullish
Price has reacted off the sell entry, which is now acting as pullback support.
Sell entry: 24,015.77
Pullback support
Stop loss: 24,479.29
Multi swing high resistance
Take profit: 23,595.36
Pullback support
Slightly above the 61.8% Fibonacci retracement
High Risk Investment Warning
Stratos Markets Limited (tradu.com ), Stratos Europe Ltd (tradu.com ):
CFDs are complex instruments and come with a high risk of losing money rapidly due to leverage. 70% of retail investor accounts lose money when trading CFDs with this provider. You should consider whether you understand how CFDs work and whether you can afford to take the high risk of losing your money.
Stratos Global LLC (tradu.com ): Losses can exceed deposits.
Please be advised that the information presented on TradingView is provided to Tradu (‘Company’, ‘we’) by a third-party provider (‘TFA Global Pte Ltd’). Please be reminded that you are solely responsible for the trading decisions on your account. Any information and/or content is intended entirely for research, educational and informational purposes only and does not constitute investment or consultation advice or investment strategy. The information is not tailored to the investment needs of any specific person and therefore does not involve a consideration of any of the investment objectives, financial situation or needs of any viewer that may receive it. Past performance is not a reliable indicator of future results. Actual results may differ materially from those anticipated in forward-looking or past performance statements. We assume no liability as to the accuracy or completeness of any of the information and/or content provided herein and the Company cannot be held responsible for any omission, mistake nor for any loss or damage including without limitation to any loss of profit which may arise from reliance on any information supplied by TFA Global Pte Ltd.

Bearish Momentum Building on GER40 – Continuation or Trap?🦹♂️ GERMANY 40 (GER40) — Smart Money Flow Blueprint 💰 | Bearish Swing Setup
🧭 Market Context
Hey Thief OGs & market heroes 🧙♂️,
Welcome to another precision strike setup on the 🇩🇪 GERMANY 40 Index (GER40).
The price action has triggered a Triangular Moving Average (382) breakdown —
confirming a bearish money-flow shift below dynamic support.
Let’s decode the play 👇
📉 Trade Blueprint (Swing Trade Plan)
🧩 Structure: Bearish bias confirmed ✅
⚡ Trigger: TMA-382 breakout below dynamic support
🎯 Strategy: Layered Sell Limit Entries (Thief-style entry stacking)
💸 Entry Layers:
🧱 24 100 • 💀 24 050 • 🎯 24 000
(You can add more layers based on your own risk appetite)
🛑 Stop-Loss: 🔐 Thief’s SL @ 24 250
🎯 Take-Profit Target: 💰 23 700 → dynamic support + oversold trap zone
💡 Thief Strategy Notes
“Layer it like a pro, exit like a ghost 👻”
• Multiple sell-limit layers help you catch volatility with precision ⚙️
• TMA serves as a dynamic moving structure – not a static line.
• Breakdown of support = momentum shift confirmed 🔻
• Clear risk/reward logic – structured SL & TP = disciplined flow 🎯
• Bearish bias remains intact while price holds under 24 100
🔍 Correlation Radar & Related Pairs to Watch
Stay alert to cross-market clues 🧠
🔗 Correlation Asset Key Observation
🇺🇸 US30 (Dow Jones) Often mirrors GER40 momentum — if Dow dips, GER40 tends to follow.
🇬🇧 FTSE100 European equity sentiment confirmation — weakness = bearish confidence boost.
💶 EUR/USD Strong Euro = export pressure → GER40 downside bias continuation.
🧠 Why This Setup Makes Sense
• TMA 382 breakout = momentum confirmation 📉
• Dynamic support break = structure shift 🔄
• Layered entries = better average fill 🔂
• SL = clear risk • TP = logical oversold zone 🎯
• Cross-asset watchlist keeps you aligned with global money flow 🌍
⚠️ Risk & Personal Choice
Dear Ladies & Gentlemen (Thief OGs) —
I’m not recommending you copy my stop-loss or take-profit.
They’re purely my levels for analysis reference only.
Trade responsibly. You make the call, you take the bag or the gold 💼✨
🧾 Quick Recap
🦹♂️ Strategy: Multi-Sell-Limit Layering
📉 Bias: Bearish below 24 100
💣 Entries: 24 100 • 24 050 • 24 000
🛑 Stop: 24 250
🎯 Target: 23 700
🧭 Setup Type: TMA Breakout + Dynamic Support Breakdown
🌍 Correlation Focus: US30 • FTSE100 • EUR/USD
✨ “If you find value in my analysis, a 👍 and 🚀 boost is much appreciated — it helps me share more setups with the community!”
#GER40 #Germany40 #DAX #Indices #BearishSetup #SwingTrade #SmartMoney #LayeringStrategy #ThiefTrader #MarketFlow #TMA #PriceAction #TechnicalAnalysis #TradingView #ChartSetup #RiskManagement

GER30 H4 | Potential Bullish RiseMomentum: Bullish
Price has bounced from the buy entry, which is acting as pullback support, and is currently trading above the 50% Fibonacci retracement level.
Buy Entry: 23,688.33
Pullback support
Stop Loss: 23,457.40
Strong overlap support
Take Profit: 24,112.40
Pullback resistance
145% Fibonacci extension
High Risk Investment Warning
Stratos Markets Limited (tradu.com ), Stratos Europe Ltd (tradu.com ):
CFDs are complex instruments and come with a high risk of losing money rapidly due to leverage. 70% of retail investor accounts lose money when trading CFDs with this provider. You should consider whether you understand how CFDs work and whether you can afford to take the high risk of losing your money.
Stratos Global LLC (tradu.com ): Losses can exceed deposits.
Please be advised that the information presented on TradingView is provided to Tradu (‘Company’, ‘we’) by a third-party provider (‘TFA Global Pte Ltd’). Please be reminded that you are solely responsible for the trading decisions on your account. Any information and/or content is intended entirely for research, educational and informational purposes only and does not constitute investment or consultation advice or investment strategy. The information is not tailored to the investment needs of any specific person and therefore does not involve a consideration of any of the investment objectives, financial situation or needs of any viewer that may receive it. Past performance is not a reliable indicator of future results. Actual results may differ materially from those anticipated in forward-looking or past performance statements. We assume no liability as to the accuracy or completeness of any of the information and/or content provided herein and the Company cannot be held responsible for any omission, mistake nor for any loss or damage including without limitation to any loss of profit which may arise from reliance on any information supplied by TFA Global Pte Ltd.

GER30 H4 | Bearish Reversal?Momentum: Bullish
The price is reacting off the sell entry which aligns with the 145% Fibonacci extension, which adds significant strength to this level.
Sell entry: 24,125.22
Pullback resistance
145% Fibonacci extension
Stop loss: 24,479.29
Swing high resistance
Take profit: 23,684.50
Pullback support.
38.2% Fibonacci retracement.
High Risk Investment Warning
Stratos Markets Limited (tradu.com ), Stratos Europe Ltd (tradu.com ):
CFDs are complex instruments and come with a high risk of losing money rapidly due to leverage. 70% of retail investor accounts lose money when trading CFDs with this provider. You should consider whether you understand how CFDs work and whether you can afford to take the high risk of losing your money.
Stratos Global LLC (tradu.com ): Losses can exceed deposits.
Please be advised that the information presented on TradingView is provided to Tradu (‘Company’, ‘we’) by a third-party provider (‘TFA Global Pte Ltd’). Please be reminded that you are solely responsible for the trading decisions on your account. Any information and/or content is intended entirely for research, educational and informational purposes only and does not constitute investment or consultation advice or investment strategy. The information is not tailored to the investment needs of any specific person and therefore does not involve a consideration of any of the investment objectives, financial situation or needs of any viewer that may receive it. Past performance is not a reliable indicator of future results. Actual results may differ materially from those anticipated in forward-looking or past performance statements. We assume no liability as to the accuracy or completeness of any of the information and/or content provided herein and the Company cannot be held responsible for any omission, mistake nor for any loss or damage including without limitation to any loss of profit which may arise from reliance on any information supplied by TFA Global Pte Ltd.

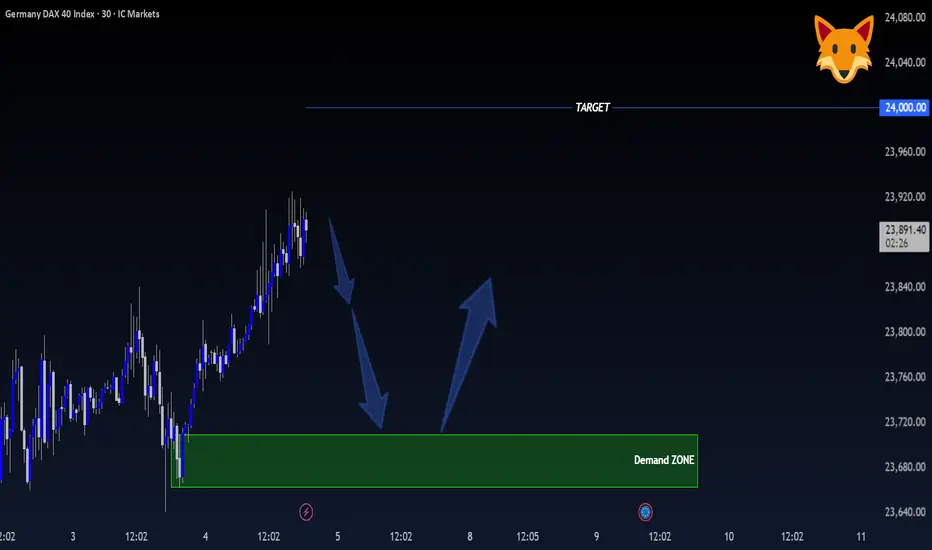
GER40 – 30-Minute Timeframe Tradertilki AnalysisGuys,
I have prepared a GER40 analysis for you.
On the 30-minute timeframe, if GER40 makes a pullback, I will open a buy position between 23,709 - 23,668.
My target will be the 24,000 level.
My friends, I share these analyses thanks to each like I receive from you.
Your likes increase my motivation and encourage me to support you in this way.🙏✨
Thank you to all my friends who support me with their likes.❤️
GER30 H4 | Bullish Bounce Off key SupportMomentum: Bearish
Price is currently falling toward the buy entry, which acts as an overlap support level.
Buy Entry: 89,034.03
Overlap support
Stop Loss: 81,966.16
Pullback support
Take Profit: 104,866.08
Overlap resistance
Slightly above the 61.8% Fibonacci retracement
High Risk Investment Warning
Stratos Markets Limited (tradu.com ), Stratos Europe Ltd (tradu.com ):
CFDs are complex instruments and come with a high risk of losing money rapidly due to leverage. 70% of retail investor accounts lose money when trading CFDs with this provider. You should consider whether you understand how CFDs work and whether you can afford to take the high risk of losing your money.
Stratos Global LLC (tradu.com ): Losses can exceed deposits.
Please be advised that the information presented on TradingView is provided to Tradu (‘Company’, ‘we’) by a third-party provider (‘TFA Global Pte Ltd’). Please be reminded that you are solely responsible for the trading decisions on your account. Any information and/or content is intended entirely for research, educational and informational purposes only and does not constitute investment or consultation advice or investment strategy. The information is not tailored to the investment needs of any specific person and therefore does not involve a consideration of any of the investment objectives, financial situation or needs of any viewer that may receive it. Past performance is not a reliable indicator of future results. Actual results may differ materially from those anticipated in forward-looking or past performance statements. We assume no liability as to the accuracy or completeness of any of the information and/or content provided herein and the Company cannot be held responsible for any omission, mistake nor for any loss or damage including without limitation to any loss of profit which may arise from reliance on any information supplied by TFA Global Pte Ltd.

Bullish rise?GER30 is falling towards the support level, which is a pullback support that aligns with the 23.6% Fibonacci retracement and could bounce from this level to our take profit.
Entry: 23,644.94
Why we like it:
There is pullback support at the 23.6% Fibonacci retracement.
Stop loss: 23,351
Why we like it:
There is a pullback support that aligns with the 50% Fibonacci retracement.
Take profit: 24,369.29
Why we like it:
There is a pullback resistance level.
Enjoying your TradingView experience? Review us!
Please be advised that the information presented on TradingView is provided to Vantage (‘Vantage Global Limited’, ‘we’) by a third-party provider (‘Everest Fortune Group’). Please be reminded that you are solely responsible for the trading decisions on your account. There is a very high degree of risk involved in trading. Any information and/or content is intended entirely for research, educational and informational purposes only and does not constitute investment or consultation advice or investment strategy. The information is not tailored to the investment needs of any specific person and therefore does not involve a consideration of any of the investment objectives, financial situation or needs of any viewer that may receive it. Kindly also note that past performance is not a reliable indicator of future results. Actual results may differ materially from those anticipated in forward-looking or past performance statements. We assume no liability as to the accuracy or completeness of any of the information and/or content provided herein and the Company cannot be held responsible for any omission, mistake nor for any loss or damage including without limitation to any loss of profit which may arise from reliance on any information supplied by Everest Fortune Group.

GER30 H1 | Bullish Bounce OffMomentum: Bullish
The price has respected the buy entry level, which aligns with the 50% Fibonacci retracement, indicating strong bullish momentum.
Buy Entry: 23,989.16
Pullback support
50% Fibonacci retracement
Stop Loss: 23,850.33
Pullback support
61.8% Fibonacci retracement
Take Profit: 24,250.47
Pullback resistance
50% Fibonacci retracement
High Risk Investment Warning
Stratos Markets Limited (tradu.com ), Stratos Europe Ltd (tradu.com ):
CFDs are complex instruments and come with a high risk of losing money rapidly due to leverage. 70% of retail investor accounts lose money when trading CFDs with this provider. You should consider whether you understand how CFDs work and whether you can afford to take the high risk of losing your money.
Stratos Global LLC (tradu.com ): Losses can exceed deposits.
Please be advised that the information presented on TradingView is provided to Tradu (‘Company’, ‘we’) by a third-party provider (‘TFA Global Pte Ltd’). Please be reminded that you are solely responsible for the trading decisions on your account. Any information and/or content is intended entirely for research, educational and informational purposes only and does not constitute investment or consultation advice or investment strategy. The information is not tailored to the investment needs of any specific person and therefore does not involve a consideration of any of the investment objectives, financial situation or needs of any viewer that may receive it. Past performance is not a reliable indicator of future results. Actual results may differ materially from those anticipated in forward-looking or past performance statements. We assume no liability as to the accuracy or completeness of any of the information and/or content provided herein and the Company cannot be held responsible for any omission, mistake nor for any loss or damage including without limitation to any loss of profit which may arise from reliance on any information supplied by TFA Global Pte Ltd.

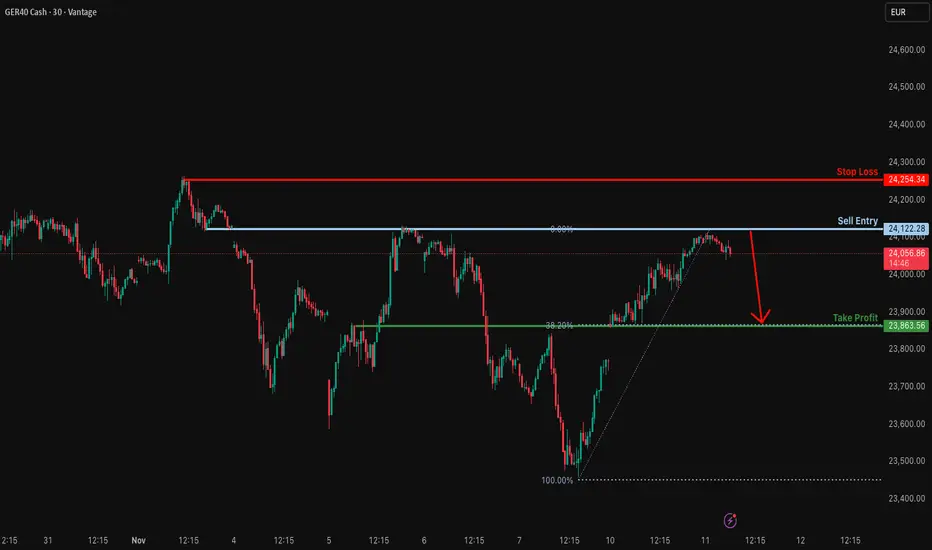
Could we see a reversal from here?GER40 has rejected off the resistance level, which is a pullback resistance, and could drop from this level to our take profit.
Entry: 24,22.28
Why we like it:
There is a pullback resistance level.
Stop loss: 24,54.34
Why we like it:
There is a swing high resistance level.
Take profit: 23,863.56
Why we like it:
There is an overlap support level that aligns with the 38.2% Fibonacci retracement.
Enjoying your TradingView experience? Review us!
Please be advised that the information presented on TradingView is provided to Vantage (‘Vantage Global Limited’, ‘we’) by a third-party provider (‘Everest Fortune Group’). Please be reminded that you are solely responsible for the trading decisions on your account. There is a very high degree of risk involved in trading. Any information and/or content is intended entirely for research, educational and informational purposes only and does not constitute investment or consultation advice or investment strategy. The information is not tailored to the investment needs of any specific person and therefore does not involve a consideration of any of the investment objectives, financial situation or needs of any viewer that may receive it. Kindly also note that past performance is not a reliable indicator of future results. Actual results may differ materially from those anticipated in forward-looking or past performance statements. We assume no liability as to the accuracy or completeness of any of the information and/or content provided herein and the Company cannot be held responsible for any omission, mistake nor for any loss or damage including without limitation to any loss of profit which may arise from reliance on any information supplied by Everest Fortune Group.
GER30 H4 | Bullish Reversal from Overlap Support LevelBased on the H4 chart analysis, we could see the price fall to the buy entry which is an overlap support and could bounce from this level to the upside.
Buy entry is at 23,885.59, which is an overlap support.
Stop loss is at 23,661.20, whic is a pullback support that is slightly above the 100% Fibonacci projection.
Take profit is at 24,383.02, which is an overlap resistance.
Stratos Markets Limited (tradu.com ):
CFDs are complex instruments and come with a high risk of losing money rapidly due to leverage. 68% of retail investor accounts lose money when trading CFDs with this provider. You should consider whether you understand how CFDs work and whether you can afford to take the high risk of losing your money.
Stratos Europe Ltd (tradu.com ):
CFDs are complex instruments and come with a high risk of losing money rapidly due to leverage. 70% of retail investor accounts lose money when trading CFDs with this provider. You should consider whether you understand how CFDs work and whether you can afford to take the high risk of losing your money.

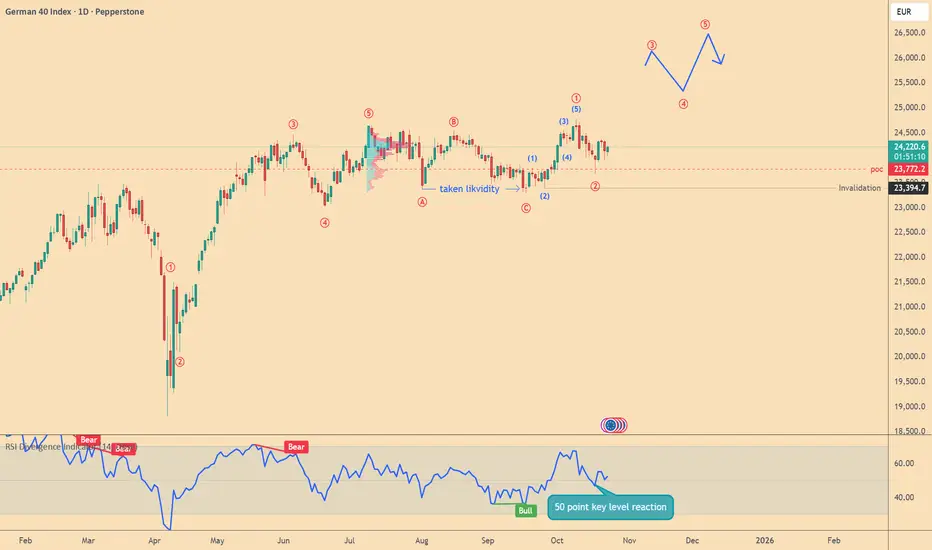
DAX/GER40, technical analysis 1DHello traders,
We bring you another important technical analysis on the DAX index.
We can see that according to Elliott Wave theory we have completed corrective ABC structure, also taken liquidity and started the bullish 12345 structure in smaller timeframe as u can see on the chart.
So the next outlook is that the value of the DAX index will increase.
But be careful!
It is necessary to respect the invalidation level in this case.
We also have to take into account the war in Ukraine, all of President Trump's statements, interest rates, and other stimuli that can change the market instantly!
WavePulse
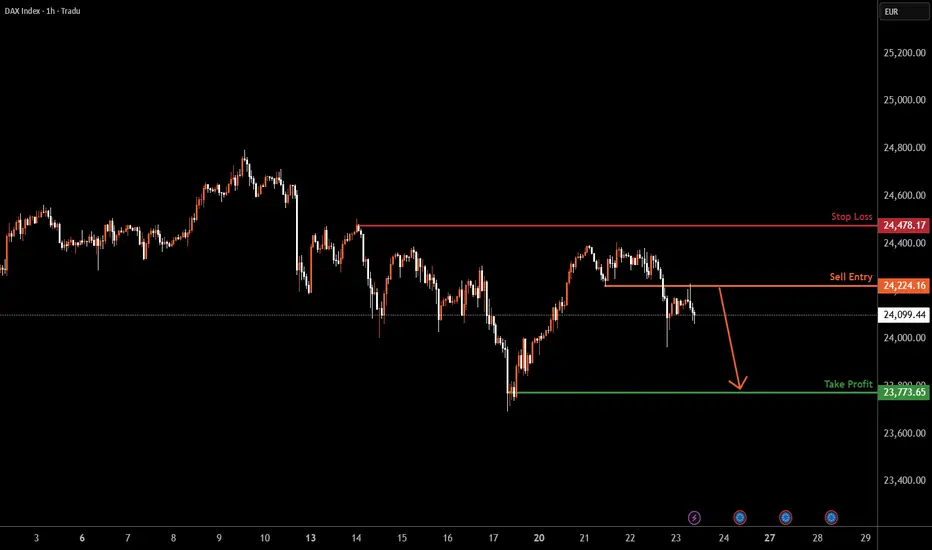
GER30 H1 | Bearish Drop-Off FormationGER30 has rejected the sell entry of 24,224.16, which is a pullback resistance and could potentially drop from this level to the downside.
Stop loss is at 24,478.17, which is a pullback resistance.
Take profit is at 23,773.65, which is a swing low support.
Stratos Markets Limited (tradu.com):
CFDs are complex instruments and come with a high risk of losing money rapidly due to leverage. 68% of retail investor accounts lose money when trading CFDs with this provider. You should consider whether you understand how CFDs work and whether you can afford to take the high risk of losing your money.
Stratos Europe Ltd (tradu.com ):
CFDs are complex instruments and come with a high risk of losing money rapidly due to leverage. 70% of retail investor accounts lose money when trading CFDs with this provider. You should consider whether you understand how CFDs work and whether you can afford to take the high risk of losing your money.
GER30 H4 | Potential Bearish Reversal FormingGER30 is reacting off the sell entry at 24,390.79, which is a pullback resistance that aligns with the 61.8% Fibonacci retracement and could drop from this level to the downside.
Stop loss is at 24,760.34, which is a swing high resistance.
Take profit is at 23,846.69, which is an overlap support.
High Risk Investment Warning
Trading Forex/CFDs on margin carries a high level of risk and may not be suitable for all investors. Leverage can work against you.
Stratos Markets Limited (tradu.com ):
CFDs are complex instruments and come with a high risk of losing money rapidly due to leverage. 65% of retail investor accounts lose money when trading CFDs with this provider. You should consider whether you understand how CFDs work and whether you can afford to take the high risk of losing your money.
Stratos Europe Ltd (tradu.com ):
CFDs are complex instruments and come with a high risk of losing money rapidly due to leverage. 66% of retail investor accounts lose money when trading CFDs with this provider. You should consider whether you understand how CFDs work and whether you can afford to take the high risk of losing your money.
Stratos Global LLC (tradu.com ):
Losses can exceed deposits.
Please be advised that the information presented on TradingView is provided to Tradu (‘Company’, ‘we’) by a third-party provider (‘TFA Global Pte Ltd’). Please be reminded that you are solely responsible for the trading decisions on your account. There is a very high degree of risk involved in trading. Any information and/or content is intended entirely for research, educational and informational purposes only and does not constitute investment or consultation advice or investment strategy. The information is not tailored to the investment needs of any specific person and therefore does not involve a consideration of any of the investment objectives, financial situation or needs of any viewer that may receive it. Kindly also note that past performance is not a reliable indicator of future results. Actual results may differ materially from those anticipated in forward-looking or past performance statements. We assume no liability as to the accuracy or completeness of any of the information and/or content provided herein and the Company cannot be held responsible for any omission, mistake nor for any loss or damage including without limitation to any loss of profit which may arise from reliance on any information supplied by TFA Global Pte Ltd.
The speaker(s) is neither an employee, agent nor representative of Tradu and is therefore acting independently. The opinions given are their own, constitute general market commentary, and do not constitute the opinion or advice of Tradu or any form of personal or investment advice. Tradu neither endorses nor guarantees offerings of third-party speakers, nor is Tradu responsible for the content, veracity or opinions of third-party speakers, presenters or participants.

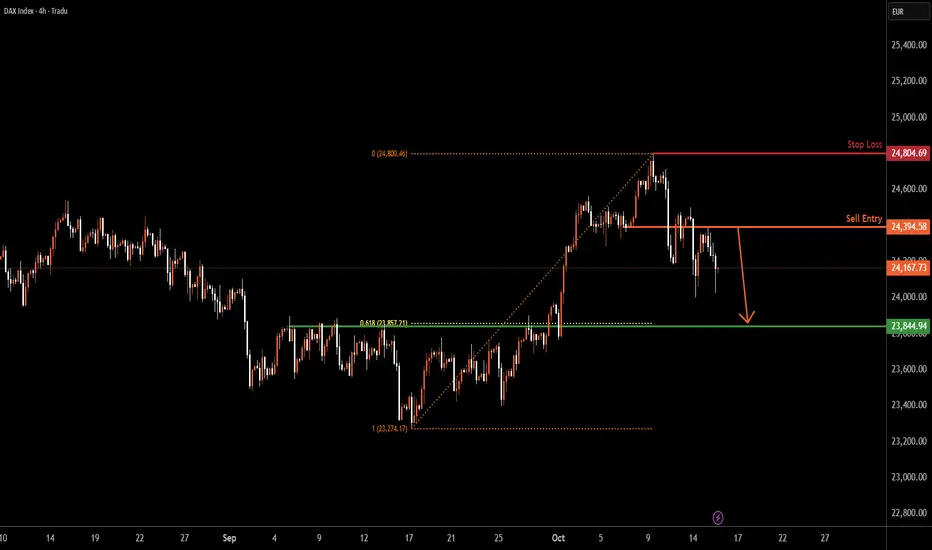
GER30 H4 | Sharp Bearish Decline ExpectedGER30 has rejected the sell entry, which is an overlap resistance, and could drop from this level to the downside
Sell entry is at 24,394.58, which is an overlap resistance.
Stop loss is at 24,656.71, which is a swing high resistance.
Take profit is at 23,844.94, whichis a pullback support that aligns with he 61.8% Fibonacci retracement.
High Risk Investment Warning
Trading Forex/CFDs on margin carries a high level of risk and may not be suitable for all investors. Leverage can work against you.
Stratos Markets Limited (tradu.com ):
CFDs are complex instruments and come with a high risk of losing money rapidly due to leverage. 65% of retail investor accounts lose money when trading CFDs with this provider. You should consider whether you understand how CFDs work and whether you can afford to take the high risk of losing your money.
Stratos Europe Ltd (tradu.com ):
CFDs are complex instruments and come with a high risk of losing money rapidly due to leverage. 66% of retail investor accounts lose money when trading CFDs with this provider. You should consider whether you understand how CFDs work and whether you can afford to take the high risk of losing your money.
Stratos Global LLC (tradu.com ):
Losses can exceed deposits.
Please be advised that the information presented on TradingView is provided to Tradu (‘Company’, ‘we’) by a third-party provider (‘TFA Global Pte Ltd’). Please be reminded that you are solely responsible for the trading decisions on your account. There is a very high degree of risk involved in trading. Any information and/or content is intended entirely for research, educational and informational purposes only and does not constitute investment or consultation advice or investment strategy. The information is not tailored to the investment needs of any specific person and therefore does not involve a consideration of any of the investment objectives, financial situation or needs of any viewer that may receive it. Kindly also note that past performance is not a reliable indicator of future results. Actual results may differ materially from those anticipated in forward-looking or past performance statements. We assume no liability as to the accuracy or completeness of any of the information and/or content provided herein and the Company cannot be held responsible for any omission, mistake nor for any loss or damage including without limitation to any loss of profit which may arise from reliance on any information supplied by TFA Global Pte Ltd.
The speaker(s) is neither an employee, agent nor representative of Tradu and is therefore acting independently. The opinions given are their own, constitute general market commentary, and do not constitute the opinion or advice of Tradu or any form of personal or investment advice. Tradu neither endorses nor guarantees offerings of third-party speakers, nor is Tradu responsible for the content, veracity or opinions of third-party speakers, presenters or participants.
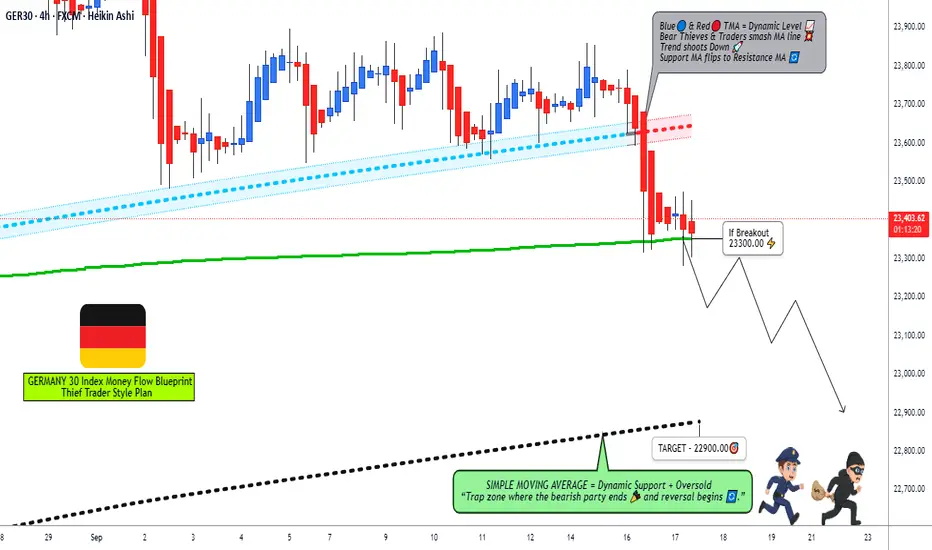
GER30 Trading Plan: Pending Orders, Breakout Levels, and Targets📉 GER30 (Germany Index) – Market Cash Flow Management Strategy 🏦
Hey Traders 👋,
Here’s a swing/day trade plan I’m watching on the GER30 (Germany Index). This setup is designed with a layered pending order strategy once confirmation hits.
🔑 Trading Plan
Bias: Bearish (waiting for sellers to breach the 4H Moving Average ✅ confirmation needed)
Entry Trigger: Breakout of MA @ 23300 ➝ after breakout confirmation, entries can be considered at different price levels.
Layered Entries (Sell Limits):
23500
23450
23400
23350
23300
(You can expand layering based on your own strategy)
⚠️ Important Note: Only activate sell limit layers after breakout confirmation. No confirmation = no entry.
🛑 Stop Loss
Suggested SL: 23650
But remember: risk management is personal! 🎯 Set your SL at your own comfort level.
🎯 Target
Exit Zone: 22900
Why? SMA acting as strong dynamic support, plus oversold conditions & potential liquidity traps.
Again ➝ this TP is optional. You’re in control of your profits. 💰
📌 Core Notes (Read Carefully!)
This plan uses multiple layered sell-limit entries (cash flow layering style).
Don’t jump in blindly! Wait for the moving average breach on 4H to confirm bearish momentum.
SL & TP are not recommendations, just references. Trade at your own risk.
🔗 Correlation / Related Pairs to Watch
FX:GER30 – Core instrument
XETR:DAX – Same Germany Index benchmark (futures)
FX:EURUSD – Often inversely correlated with DAX strength when EUR reacts to macro events
SP:SPX / CAPITALCOM:US30 – Global equity indices; U.S. flows can impact German equities
OANDA:XAUUSD – Gold as a hedge; risk-off flows sometimes push capital out of equities and into gold
Watching these pairs can give better context to the strength/weakness of GER30 📊.
✨ “If you find value in my analysis, a 👍 and 🚀 boost is much appreciated — it helps me share more setups with the community!”
#GER30 #DAX #Germany30 #IndexTrading #SwingTrading #DayTrading #TechnicalAnalysis #TradingStrategy #StockIndices #MarketFlow