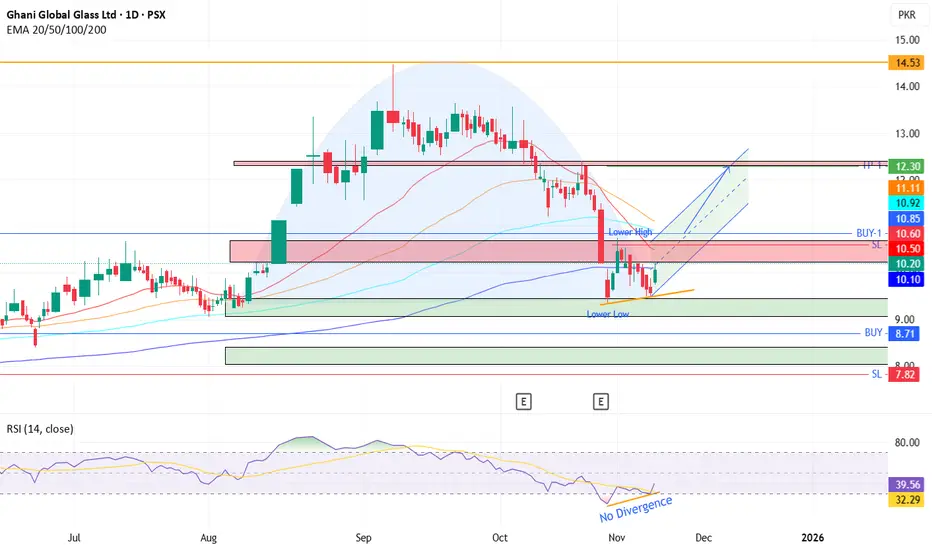
GGGL- PSX - Technical AnalysisOn daily time frame, GGGL has made an inverted Cup and now Handle is likely in the making as drawn.
On RSI there is NO bullish divergence. Hence price going up from the support level which can even continue down wards after a few days. Moreover, there is a resistance channel just above whereby price can be pushed down.
Technically, very correct entry is at BUY-1, after crossing the previous Lower High with TP around 12.30 and SL 10.60.
GGGL
Monthly Breakout but still...Monthly Breakout; However, still at Important Resistance zone.
Once 10.70 is Crossed & Sustained, 12 - 12.50 can be easy Targets.
It has given a Breakout from Rectangular Channel around 8.70 - 9.
& also re-tested it.
Hidden Bullish Divergence has also appeared.
as of Now, it should not break 6.60.

GGGL: Potential Weekly Breakout TradeGGGL presents an interesting weekly trading opportunity. The stock recently broke out from an approximately 100-week consolidation period, signaling a potential long-term upside. Following the breakout, the price successfully retested the weekly support zone around 8. The weekly candle closed at the 0.5 Fibonacci retracement level, a key area for potential reversals. A bullish divergence initially signaled potential upside, and although the price subsequently entered a consolidation phase, the RSI has now synced with the price action, suggesting renewed upward momentum.
Trading Recommendations:
Buy 1 (CMP): 8.5
Buy 2: 7
Stop-Loss: Closing below 5.5
Take Profit 1: 10.5
Other Potential Targets: 16, 20, and 30 (near all-time highs)
Happy trading!
