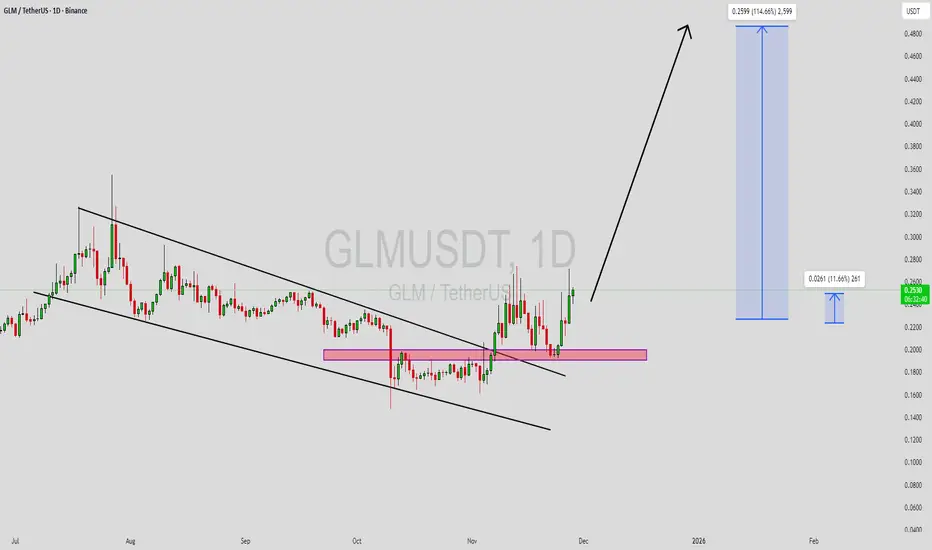
GLMUSDT Forming Falling WedgeGLMUSDT is forming a clear falling wedge pattern, a classic bullish reversal signal that often indicates an upcoming breakout. The price has been consolidating within a narrowing range, suggesting that selling pressure is weakening while buyers are beginning to regain control. With consistent volume confirming accumulation at lower levels, the setup hints at a potential bullish breakout soon. The projected move could lead to an impressive gain of around 90% to 100% once the price breaks above the wedge resistance.
This falling wedge pattern is typically seen at the end of downtrends or corrective phases, and it represents a potential shift in market sentiment from bearish to bullish. Traders closely watching GLMUSDT are noting the strengthening momentum as it nears a breakout zone. The good trading volume adds confidence to this pattern, showing that market participants are positioning early in anticipation of a reversal.
Investors’ growing interest in GLMUSDT reflects rising confidence in the project’s long-term fundamentals and current technical strength. If the breakout confirms with sustained volume, this could mark the start of a fresh bullish leg. Traders might find this a valuable setup for medium-term gains, especially as the wedge pattern completes and buying momentum accelerates.
✅ Show your support by hitting the like button and
✅ Leaving a comment below! (What is your opinion about this Coin?)
Your feedback and engagement keep me inspired to share more insightful market analysis with you!
GLM
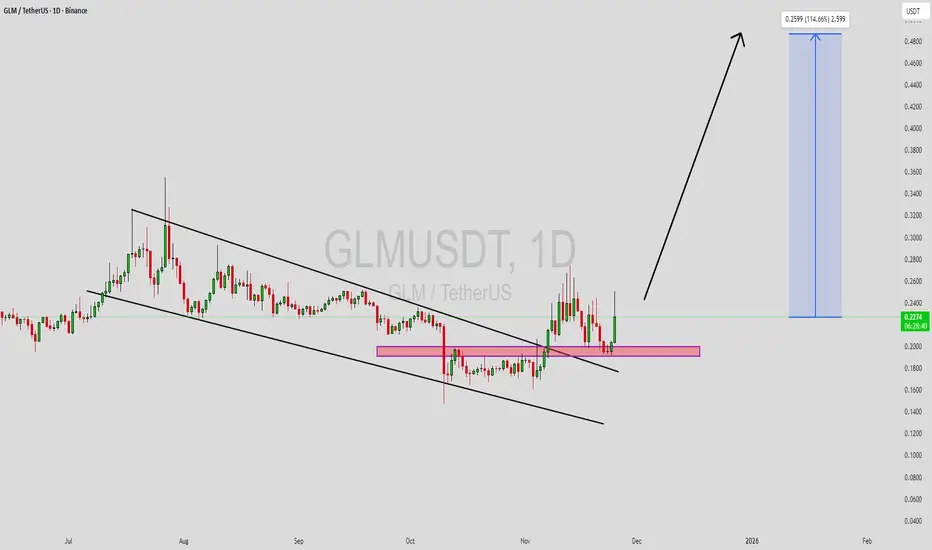
GLMUSDT Forming Falling WedgeGLMUSDT is forming a clear falling wedge pattern, a classic bullish reversal signal that often indicates an upcoming breakout. The price has been consolidating within a narrowing range, suggesting that selling pressure is weakening while buyers are beginning to regain control. With consistent volume confirming accumulation at lower levels, the setup hints at a potential bullish breakout soon. The projected move could lead to an impressive gain of around 90% to 100% once the price breaks above the wedge resistance.
This falling wedge pattern is typically seen at the end of downtrends or corrective phases, and it represents a potential shift in market sentiment from bearish to bullish. Traders closely watching GLMUSDT are noting the strengthening momentum as it nears a breakout zone. The good trading volume adds confidence to this pattern, showing that market participants are positioning early in anticipation of a reversal.
Investors’ growing interest in GLMUSDT reflects rising confidence in the project’s long-term fundamentals and current technical strength. If the breakout confirms with sustained volume, this could mark the start of a fresh bullish leg. Traders might find this a valuable setup for medium-term gains, especially as the wedge pattern completes and buying momentum accelerates.
✅ Show your support by hitting the like button and
✅ Leaving a comment below! (What is your opinion about this Coin?)
Your feedback and engagement keep me inspired to share more insightful market analysis with you!
GLMUSDT UPDAT#GLM
UPDATE
GLM Technical Setup
Pattern: Falling Wedge Pattern
Current Price: $0.235
Target Price: $0.400
Target % Gain: 100.02%
Technical Analysis: GLM has broken out of a falling wedge pattern on the 1D chart, signaling a potential bullish reversal. The breakout is confirmed by strong upward momentum and volume increase, indicating renewed buyer interest. If the momentum sustains, price could move toward the $0.400 level, which aligns with the projected target zone.
Time Frame: 1D
Risk Management Tip: Always use proper risk management.

GLM/USDT INCREASE BY VOLUMWGLM/USDT INCREASE BY VOLUME
Interesting follow to see if its able to break

$GLM ANALYSIS! CSE:GLM is testing the red resistance zone 🟥. If it breaks out, the target is the green line level 🟩.

GLMUSDT(Golem) Updated till 16-02-25GLMUSDT(Golem) Daily timeframe range. finally we can see some move here. almost reached close to 0.4504. now if it can get a valid close above 0.3355 it can revisit there again. local low and support still at 0.2323.

GLM Buy setup (1D)It appears that GLM has entered a triangle formation at the point marked by the red arrow on the chart. Currently, it seems to be at the end of wave D.
A buy position can be considered at the green zone during wave E.
Closing a daily candle below the invalidation level will invalidate this analysis.
For risk management, please don't forget stop loss and capital management
Comment if you have any questions
Thank You

#GLM/USDT#GLM
The price has broken the descending channel on the 1-day frame upwards and is expected to continue.
We have a trend to stabilize above the 100 moving average again.
We have an upward trend on the RSI indicator that supports the rise by breaking it upwards.
We have a support area at the lower limit of the channel at a price of 0.2400.
Entry price 0.3000.
First target 0.3746.
Second target 0.4413.
Third target 0.5090.

BAT and ANCHR and maybe GLM good for a run?GLM is about to breaks some long term resistance if it can break free, just a little higher as you see top of channel on the chart. Also Bat has broken out of s hort term trend and looks interesting for a potential run.
i like GLM anyway, its always easy to trade a conviction because you dont mind holding it if you need to. GLM is distributed compute, they have added GPU and they now provide hosting for language models on decentralized compute, fundamentally speaking they are in a fantastic place to me and with a <$500M market cap. I also work in AI a bit so I may be biased there as well, but keep an eye, it breaks that line, it should be a pretty good run.
Order books look great on these, lots of traders expecting the price to go up with far out of the money asks.
Also ANKR just broke out and set old resistance as support, it should be due for a good run any time now.
ANKR break out:
Bat double break out:
BTC has staged a larger scale break out:
BTC zoomed in:
This is why you need to watch for right now and how we could pull back to $95k but no big deal its still way bullish where we are right now.
Watch BTC though, it could pull back any time its at some resistance too and could pull back to $95k before moving back up. If it pulls back hard, it will take everything with it for the most part.

(GLM) golem network "most active in russia"data provided by crunchbase.com per semrush shows Golem is most active in Russia.

GLMUSD - Large W PatternThis is the non-log chart for GLMUSD which shows a possible W pattern forming with the right bullish side yet to be experienced.
This is similar to what I have seen on XRPUSD.
If we do see a bull move it will be one to complete this larger W structure.

Prime Opportunity: Golem (#GLMUSDT) Major Bullish Move!I’m excited to share a trade setup for my favorite coin at the moment: Golem (#GLMUSDT).
Both the GLMUSDT and GLMBTC pairs are showing extremely bullish potential, and the price action is aligning perfectly with our trading strategy.
Key Points:
*Elliott Wave Pattern: The current chart reveals a compelling Elliott Wave pattern. Notably, wave 5 hasn't commenced yet, presenting an excellent buying opportunity, especially with the recent completion of the ABC correction.
*Perfect Pullback: This recent pullback is exactly what I've been waiting for. It marks the end of the correction phase and the beginning of a potential new upward movement.
Trade Setup:
*Entry Triggered: Today, my trade setup was triggered, offering a solid 1:3 risk/reward ratio. The current setup is highly favorable for entering a long position, capitalizing on the anticipated wave 5.
Conclusion:
Bullish Outlook: The bullish sentiment for Golem is strong, and this setup provides a promising opportunity for substantial gains. If you follow this trade, you might be thanking me later.
Happy trading!

GLM best buying opportunity...You can buy GLM on spot, as much as you can. It has formed a higher low that will remain unbroken in the future. I am expecting a 3-4x return from it in the mid-term.

#GLM/USDT#GLM
The price is moving in a 12-hour bearish channel, is very committed to it, and has just broken through it
We have a green support area at .5000 that is expected to be bounced from due to its strength
We have a trend to hold above the Moving Average 100, which is strong support for the rise
We have very strong oversold resistance on the RSI indicator to support the rise with a strong downtrend
Entry price: 5600
First target 6248
The second target is 0.6690
The third goal 0.7283

GLMUSDT(Golem) Daily tf Range Updated till 06-05-24GLMUSDT(Golem) Daily timeframe range. not far away from its old high and its retraced very well byfar. trying to break through 0.6308 if it can 0.7657 will be a place that can lead. another alt close to price discovery.

Golum Soars Over 100% This WeekendGolum has been under the radar for some time in my list, exploded in price this weekend, surging over 100%. The price climbed from $0.30 to $0.64, as per weekend chart data above.
However, it is now facing a hurdle at the $0.59 resistance level . This level represents a point on the chart where sellers have previously been able to halt price increases. A decisive close above $0.65 could be a bullish signal, potentially propelling GLM towards the $0.80 region.

GLM LOOKS BEARISHIt seems to be at the end of the F wave. It is now in the B wave diametric.
A long shadow resistance range has been created, which we marked with LSH.
By maintaining the red range, it can drop towards the targets.
The targets are marked on the chart
Closing a daily candle above the invalidation level will violate the analysis.
For risk management, please don't forget stop loss and capital management
When we reach the first target, save some profit and then change the stop to entry
Comment if you have any questions
Thank You

Golem GLM price is in an interesting and promising pattern#Golem CSE:GLM is a project with a history dating back to 2017
However, it attracted our attention not because of its history, but because of its high volatility in recent weeks and fairly good overall trading volume.
It seems that in 2024, they began to realize the growth for which they accumulated coins during 2022-23.
"The shadows" on top of the daily candlesticks over the past 3 days hint that someone is selling aggressively, locally, but selling. That is, a local correction is possible.
But it seems like a good idea to take a closer look at the #GLMUSDT long in the range of $0.40-0.43 with a target of +150% growth.
What do you think of this?

GLMUSDT(Golem) Daily tf Range Updated till 29-04-24GLMUSDT(Golem) Daily timeframe range. close to 0.5901 breaking it clean can led it to its old high. even on bigger mcap fluctuation its holding well for now. it got chances depend on holders, above 0.7319 is pretty much price discovery.

Glm/usdt ideaGlm/USDT price is currently rebounding from a key support level, indicating increased interest from buyers. As a result, I anticipate a potential breakout in the near future. If a breakout does occur, I foresee a bullish move ranging between 50% to 80%.
Please note that the above information is not intended as financial advice. It is crucial to conduct your own research (DYOR) and consider various factors before making any investment decisions.

GLM, the DOGE of 2024?GLM / 3D
Shared this chart right before it bounced back from the 1.618 Fibonacci extension
IF it goes as the fractal suggests, we should be expecting a re-test of the 1.618 level.
Otherwise, next target is $1+

GLMUSDT - Continued MoonRecently GLM has acted very bullishly
I see this continuing, plotting the bars pattern showing my thoughts of the rise to come.
Very hard to foresee price action when it is like this so I am just assuming continuation until a top is reached.
Abstract Idea
AI COIN

GLMTHB : Ready to 20 THBBITKUB:GLMTHB
Hello My Follower
My Technical Analysis Confirm Target Price of GLM/THB Ready to 20 THB Soon...
Resistance of this chart refer to Bitkub Exchange
First Resistance: 17.85 THB
Second Resistance: 20 THB
-----------------------------------------------------------------------------------------------
*Simple but powerful
Time to DCA this coin, Not Financial Advice!!!
