GMAB at a Critical Confluence Zone – Potential UP or down?GMAB at a Critical Confluence Zone – Potential Breakout or Reversal?
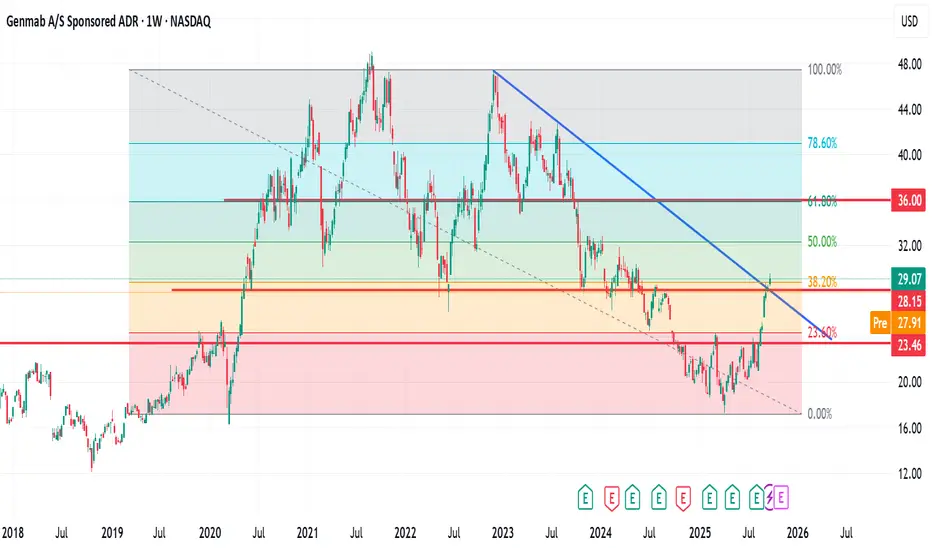
GMAB has shown strong recovery momentum since its April 7th, 2025, low. The price is currently testing a significant confluence area formed by a descending trendline and the Fib 38.2% support level.
If price action holds above this zone, there is potential for a continuation move toward the Fib 61.8% level, which would represent an estimated upside of around 28%.
My Trade Plan:
Initial entry at the current market cap.
Second entry after a confirmed breakout above this confluence zone.
As always, apply proper risk management—trade cautiously and according to your strategy.
🔹 Like, comment, and follow for more trade ideas.
🔹 Let’s connect here on TradingView.
GMAB
GMAB - Potential Long Term Growth ProspectSome basic chart analysis on Genmab.
This is more to bring your attention to the stocks long term growth prospects.
With a TTM P/E ratio of 29 and a FWD of 3, combined with solid revenue growth TTM and FWD leads me to suggest that Genmab will thrive in the coming months and climb to all time highs.

Will it follow the trend channel.Trend channel started in Nov 2018 and have been holding the channel for over 1 year
Will it keep going?
Still a up trend
holding the channel
50 ma holding more then nicely
support/resistens at 1453 ish
just hit the low of the channel
my signals say buy, so here is my idea.
Open trade at :1475
Set my TP at :1715
Set my SL at :1445 (if there should come a down spike at the resistens at the last caddelstick)
( this is just my point of view and should not be taken as a buy or sell indicator for you - remember always to do your own analyse )
