GME Market Strategy: Risk-Managed Swing to Resistance🚨 GME: GameStop's Great Heist! 🎮💰 Bullish Swing/Day Trade Plan
Asset: GameStop Corporation (GME)Market: NYSE (Stock)Strategy: Swing/Day Trade with a "Thief's Layered Limit Order" Approach 😎
Get ready, traders! We're about to pull off a bullish heist on GameStop (GME) with a slick, calculated plan to outsmart the market! 📈 This setup is packed with technical firepower and a cheeky vibe to keep it fun yet professional. Let’s dive into the Thief’s Wealth Strategy Map and steal some profits! 🕵️♂️
📊 Technical Breakdown: Why GME is Ripe for the Taking
Our bullish setup is backed by a rock-solid technical foundation. Here’s the intel:
🔥 382 EMA Breakout: GME has smashed through the 382-period Exponential Moving Average, signaling strong bullish momentum. This breakout is our green light for action! 🚦
💥 Accumulation Zone Pressure: Buyers are stacking up in the accumulation zone, pushing prices upward like a crew of bullish bandits ready to raid the market.
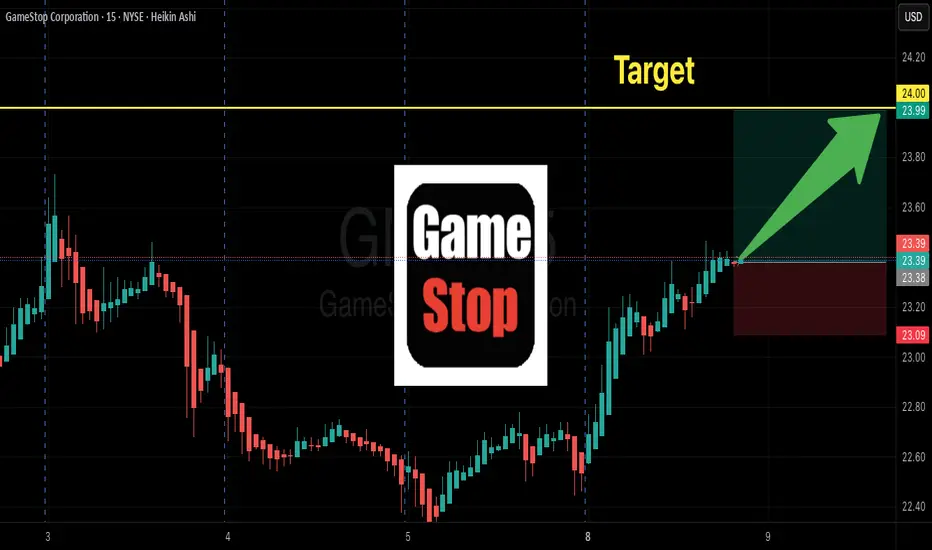
🕯️ Heikin Ashi Reversal Candle: A gorgeous bullish Heikin Ashi candle has emerged, screaming BUYING POWER and confirming the trend reversal. The bulls are in control! 🐂
🗝️ Thief’s Edge: We’re using a layered limit order strategy to sneak into the market at multiple price points, maximizing our entry precision.
🕵️♂️ The Thief’s Entry Plan: Layered Limit Orders
This isn’t your average “buy and pray” strategy. We’re using a layered limit order approach to enter like sneaky market thieves. Set your buy orders at these levels:
🪙 $24.00
🪙 $24.50
🪙 $25.00
🪙 $25.50
🪙 $26.00
Pro Tip: Feel free to add more layers based on your risk appetite and account size. The more layers, the merrier the heist! 😜 You can also enter at any price level within this range if you prefer a single strike. Just keep it sharp and calculated!
🛑 Stop Loss: Protect Your Loot
🛡️ Set your stop loss at $23.00 to guard against unexpected market traps. ⚠️
Note: Dear Ladies & Gentlemen (Thief OGs), this is my suggested stop loss, but it’s your heist! Adjust it to suit your risk tolerance. Trade smart, and don’t get caught by the market cops! 👮♂️
🎯 Target: Cash Out Before the Barricade!
🎰 Our profit target is $31.00, where a police barricade zone (aka strong resistance) awaits. This level is flagged as overbought with a potential trap for greedy thieves. 🪤 Escape with your profits before the market clamps down!
Note: Thief OGs, this is my target, but you’re the boss of your trades. Take profits at your own discretion and secure the bag! 💸
🔗 Related Pairs to Watch (Correlated Assets)
To maximize your market intel, keep an eye on these correlated assets (all in USD):
🎥 NYSE:AMC Entertainment (AMC): Another meme stock darling, often moving in tandem with GME. Watch for similar bullish setups or divergences.
📊 AMEX:SPY (S&P 500 ETF): GME’s wild swings can be influenced by broader market sentiment. If SPY is bullish, GME’s momentum could get an extra boost!
📱 NYSE:BB (BlackBerry): Another retail-favorite stock with potential for correlated volatility. Check for breakout patterns here too.
Key Correlation Points:
🚀 NYSE:GME and NYSE:AMC : Often ride the same retail-driven waves, especially during short squeezes or social media hype.
⚖️ AMEX:SPY Influence: If SPY shows weakness, GME’s bullish momentum might face resistance. Stay alert!
🔍 NYSE:BB as a Signal: If BlackBerry is pumping, GME might follow suit.
📝 Final Notes for the Heist
This is a high-octane, bullish setup designed for swing or day traders with a taste for calculated risk. The Thief’s Layered Limit Order Strategy gives you flexibility to enter the market like a pro, while the technicals (382 EMA breakout, Heikin Ashi, and accumulation pressure) provide a solid foundation. 🏦
Stay sharp, manage your risk, and don’t get greedy—escape with your profits before the market throws up a barricade! 🚓
✨ “If you find value in my analysis, a 👍 and 🚀 boost is much appreciated — it helps me share more setups with the community!”
#Hashtags: #GME #StockMarket #SwingTrading #DayTrading #Bullish #TechnicalAnalysis #TradingStrategy #MemeStocks
Gmestock

GME on SOL: The Wyckoff Accumulation Range Continues to UnfoldGME on SOL continues to unfold in its Wyckoff accumulation range, now spanning 185 days.
It’s currently in phase C of the accumulation range development, and I’m looking for confirmation of price reclaiming the range low, taking support off the support lines and daily demand, and starting to form bullish orderflow.
That, to me, would signal my thesis is correct and that price is in the process of a HTF deviation and reversal from these lows.
Looking at the monthly, price has respected this accumulation range structure and has always rejected from the lows — just as it’s doing now. This could form a bullish pinbar close on the monthly from this low and reverse from here, aligning with the LTF if we get confirmations.
Note this: the HTF is aligning to the LTF here imo, giving strong confluence. The same applies to the 1W, 2W, and 3W charts — all show the range well defined, rejecting the range low and deviating over many months. There’s only so long this will go on before the cause has developed enough and the effect takes place as price reverses and moves higher.
And remember this: the longer the cause (development of the range), the greater the effect (the price movement that follows the cause). Reflect on price and think about where we could head if everything aligns as I’m forecasting and the narrative plays out as a whole.
For me, the targets are clear and always have been with this coin (and AMC, WSB, and KITTY on SOL). I truly believe GME will smash a new ATH when the GME stock movement takes off (and it doesn’t seem too far away now!) and Roaring Kitty comes back on X. I think we’ll see an absolute melt-up in them all, with capital rotating between them all and the GME stock.
The way I see it, price is in this local accumulation range as marked. Once we break out of this, the target is the ATH at $230 million MC — and let’s be honest, price moved from $2.83 million to $150 million in 3 days after breaking out of its prior accumulation range spanning only 36 days. Think what could happen after ranging here for 185 days within this local accumulation range, sat inside a larger range from the low of August 2024 where price has ranged for over 400 days!
I think we see $500 million (a modest 2x) or maybe even $1 billion MC. I don’t think that’s out of the question if everything unfolds as I’ve discussed before — so imagine what AMC and WSB on SOL could also run to...
It’s funny, because GME on SOL has been the weakest pair of them all despite being the centre of it all. Is it a telling sign of manipulation during the accumulation phase? Who knows.
1D:
2D:
3D:
1W:
2W:
3W:
1M:

GME Options Flow Screams Upside To $24C – Tactical Call Buy!
# 🎮🔥 GME Earnings Lottery Ticket: \$90 Risk for 200%+ Upside!
📊 **Earnings Analysis Summary (2025-09-08)**
💡 **Trade Idea:**
👉 Buy **1x GME \$24.00 CALL** (exp. 2025-09-12) at **\$0.90** (pre-earnings close entry).
This is a **single-leg naked call**, pure tactical play.
---
### 🧩 Why This Trade?
* 📉 **Fundamentals Weak**: Revenue –16.9% YoY, thin margins.
* 💵 **Massive Cash Cushion**: \$6.39B → no bankruptcy risk.
* 📈 **Options Flow HOT**: Heavy call OI at \$24/\$25 → gamma squeeze risk.
* 🎯 **History of Surprises**: 75% beat rate, often outsized moves.
* ⚡ **IV Elevated but Fair**: Calls priced \$0.50–\$1.10 → reasonable lottery ticket.
---
### 📊 Scores (1-10)
🔻 Fundamentals: 3
📈 Options Flow: 8
📊 Technicals: 5
🌎 Macro: 5
✅ Overall Conviction: **72% MODERATE BULLISH**
---
### 📌 Trade Plan
🎯 Entry: \$0.90 limit (pre-earnings close)
🛑 Stop Loss: \$0.45 (–50%)
💰 Profit Targets:
* +150% = \$2.25 (scale out 50%)
* +200% = \$2.70 (full take profit)
📆 Exit: within 2 hrs post-earnings to avoid IV crush
---
### ⚖️ Risk/Reward
* Max Loss: **\$90**
* Breakeven: \$24.90 (needs +10.1% move)
* Upside: +200% to +300% possible if GME squeezes
---
📊 **TRADE DETAILS**
* 🟢 Instrument: GME
* 🟢 Direction: CALL
* 🎯 Strike: 24.00
* 💵 Entry: 0.90
* 🛑 Stop: 0.45
* 📅 Expiry: 2025-09-12
* 📈 Confidence: 72%
* ⏰ Earnings: 2025-09-09 (AMC)
---
🚀💎🙌 This is a **lottery-style upside bet**: risk a small ticket, catch a big move if earnings surprise + gamma squeeze align.
GME LONG IDEA GME has been in a downtrend for a while. The first signal for long was in April 2024 when price was in an oversold region and there was a divergence on the awesome oscillator. This was followed by a breakout of downtrend. From around 16, price went up to 64.
The current price action shows that price is about to rally up again. A weekly bullish candle closing above 30 is a good signal for a long. Price has broken out of a downtrend and support level, closing above these key levels is a good signal to target the high. An aggressive trader or investor may buy at a current price. While a conservative trader may wait for price to close and buy the following week or wait for price to retrace to the support level before placing the buy. To spread risk, one can buy at the current price, add more positions when price retraces to the key level. This will save from missing out and also balance the risk.
Entry could be at current price or 30 while the target can be 48 or 65.
The confluences for the buy are as follows:
1. Downtrend breakout with a weekly bullish candle closing above it.
2. Price respecting uptrend
3. Awesome oscillator resuming bullish momentum
4. Price breaking out of support level.
Disclaimer: this is not a financial advice. The outcome maybe different from the projection. If you can't accept the risk, don't take the signal.

GameStop-Themed Memecoin Spikes 167% Amidst Latest Bitcoin PlayA memecoin named after GameStop Corp. NYSE:GME skyrocketed about 167% Tuesday breaking out of a falling wedge pattern after the video game retailer adopted Bitcoin as a treasury reserve asset.
Build on the Ethereum blockchain, GameStop Coin (GME) soared 167% in the last 24 hours, dwarfing returns by blue-chip cryptocurrencies like Bitcoin and Dogecoin
The latest uptick widened the coin's monthly returns to an astounding +3778.06%. However, a cursory glance at its trajectory revealed periods of short-term rise followed by sharp collapse, indicating its speculative nature.
Note that the cryptocurrency isn't tied to GameStop in any way but seeks to capitalize on the hype surrounding the meme stock.
Technical Outlook
As of the time of writing, NYSE:GME coin is up 9.92% currently retraced as hinted by the Relative Strength Index (RSI) at 60. With the growing hype surrounding meme coins Gamestop coin is looking poised for a comeback as indicated by the daily chart - the wedge is still in play with a speculated surge to the January high, 2025.
GameStop (gamestop-coin.vip) Price Live Data
The live GameStop (gamestop-coin.vip) price today is $0.000101 USD with a 24-hour trading volume of $1,595,457 USD. GameStop (gamestop-coin.vip) is up 4.09% in the last 24 hours, with a live market cap of $41,512,628 USD. It has a circulating supply of 411,297,484,026 GME coins and a max. supply of 420,690,000,000 GME coins.

Breaking: $GME Coin Set For a 80% Breakout Amidst Rising Wedge Gamestop coin ( NYSE:GME ) a token created on the Ethereum blockchain ( NYSE:GME ) is set for a breakout after breaking out of a rising wedge pattern envisioning a move to the 1-month high pivot.
While currently up 3%, with the RSI at 53.95 NYSE:GME is poised to capitalized on this level to pick liquidity up.
What is GameStop?
GameStop, a well-known video game retailer, has recently captured significant attention beyond its traditional business model. The company, symbolized by GME, became a focal point in the financial world due to a dramatic surge in its stock prices. This surge was sparked by a Reddit user's compelling argument for investing in the company, leading to widespread controversy and heightened interest in GME.
GameStop (gamestop-coin.vip) Price Live Data
The live GameStop (gamestop-coin.vip) price today is $0.000097 USD with a 24-hour trading volume of $980,350 USD. GameStop (gamestop-coin.vip) is up 2.69% in the last 24 hours, with a live market cap of $40,009,034 USD, It has a circulating supply of 411,297,484,026 GME coins and a max. supply of 420,690,000,000 GME coins.

GameStop (GME) Can We Jump Over $33 to Reach New Heights?Hey there, trading family! Get ready for an exciting journey with GameStop (GME) stock! Right now, GME is like a video game character trying to jump over a big obstacle at $33. If it makes this jump, wow, we might see it zoom up to play between $36.50 and $37.50! It's like reaching a new level in your favorite game.
But here's the catch: if GME doesn't make it over $33, it's like falling back to the start of the level, or in this case, dropping back down to hang out between $25 and $27. We'll look at cool charts and listen to what other gamers (I mean, traders!) are saying about GME to help us guess what might happen next. Will GME soar like a high score, or will we have to retry the level?
If you found this post useful share, like or tell me your thoughts would love to hear them.
Kris/ Mindbloome Exchange
Trade What You See

The $GME Comeback: Weekly Active and $85 on the Horizon!NYSE:GME seems to be gearing up for a strong move. The weekly chart is confirmed, and for the monthly to trigger a valid signal, it needs to hit $27.
I’d much rather have jumped in at $11, but this is still a valid trade after the deviation and reclaim.
This is purely a meme play, but if it plays out, I’m targeting $85 and $140.

GME MOTHER OF ALL SHORT SQUEEZES $85 4-HOUR CHART AND ELLIOT 4-5The target is all there on the chart.
Please like comment subscribe! I love answering peoples questions!
I am the stock wrangler.

GameStop ($GME) Earnings PreviewGameStop ( NYSE:GME ) is set to report its quarterly earnings on Tuesday, September 10th, after the market closes. Analysts are bracing for a challenging report, expecting lower revenue, a slightly larger net loss, and a significant decline in comparable store sales year-over-year. However, the stock's recent technical setup and less volatile trading pattern suggest potential opportunities for traders and investors alike. Here's an in-depth look at both the fundamental and technical aspects of GameStop as we approach the earnings release.
Key Financial Metrics and Projections
GameStop ( NYSE:GME ) has been grappling with declining sales, increased competition, and shifting consumer behavior in the video game retail space. Analysts project revenue of $900 million for Q2 2024, down from $1.16 billion in the same quarter last year, reflecting a year-over-year decline of approximately 22.4%. The company's net loss is expected to widen slightly to $5.3 million, up from a $2.8 million loss in Q2 2023.
Key Financial Estimates:
- Revenue: Expected to decline to $900 million from $1.16 billion YoY.
- Net Loss: Projected at $5.3 million, larger than last year's loss of $2.8 million but significantly improved from Q1 2024's $32.3 million loss.
- Comparable Store Sales: Expected to drop nearly 23% year-over-year, a key metric highlighting reduced consumer spending on discretionary items, including video games.
Factors Influencing Fundamentals:
- Lower Consumer Spending: Amid inflationary pressures, discretionary spending has taken a hit as consumers prioritize essentials. This shift has particularly impacted GameStop’s sales.
- Shift to Digital Sales: The ongoing transition from physical game sales to digital downloads continues to challenge GameStop’s traditional business model.
- New Strategic Moves: GameStop recently announced plans to convert some of its stores to "retro" locations, focusing on nostalgic gaming experiences. This could attract a niche audience but remains an unproven revenue driver.
Technical Analysis: A Bullish Setup in the Making?
Despite the grim outlook on the fundamental side, GameStop’s technical setup tells a different story. As of the latest market session, NYSE:GME is up 3.17%, with the stock showing promising technical signals.
Key Technical Insights:
- RSI at 55: The Relative Strength Index (RSI) is sitting at 55, indicating a balanced momentum that is neither overbought nor oversold. This suggests that NYSE:GME is maintaining a healthy momentum without being at extreme levels, which could indicate further price movement.
- Symmetrical Triangle Pattern: The daily price chart depicts a symmetrical triangle pattern—a bullish continuation or reversal setup that often precedes a significant breakout. With converging trendlines, this pattern typically signals a buildup in buying pressure, leading to a potential upside move.
Trading Volume and Volatility:
- Volume Trends: Trading volume has been steady, reflecting less of the extreme volatility seen earlier in 2024. This calmer trading behavior may provide a more predictable environment for swing traders looking for a breakout opportunity.
- Support and Resistance Levels: Key support is around the $16 mark, while resistance sits near the $20 level. A breakout above this resistance could catalyze further gains, especially if positive earnings surprises or forward guidance are announced.
Market Sentiment and Influences:
- Meme Stock Legacy: While GameStop remains a heavily watched stock due to its meme status, recent activity has been relatively muted compared to past years. Influential trader Keith Gill, also known as “Roaring Kitty,” recently made a social media comeback, posting a cryptic message that could reignite interest among retail investors.
- Analyst Ratings and Revisions: Analysts have been cautious, with recent revisions reflecting skepticism about GameStop’s ability to return to profitability. However, any positive guidance or surprise in earnings could quickly alter this sentiment, given the stock’s history of sharp moves.
Outlook and Trading Strategy
Near-Term Outlook: GameStop’s upcoming earnings report will be crucial in setting the tone for its stock trajectory. While the fundamentals suggest ongoing challenges, the technical setup and market sentiment hint at the possibility of a bullish breakout, particularly if earnings beat expectations or management outlines a compelling strategic direction.
Potential Strategy: Traders may consider positioning for a potential breakout, closely watching key levels around the symmetrical triangle pattern. Caution is advised due to the inherent volatility around earnings announcements.
Conclusion: GameStop’s stock sits at a crossroads, with fundamental challenges being counterbalanced by a potentially bullish technical formation. Investors should keep an eye on Tuesday’s earnings release for critical insights into GameStop’s future direction.
As NYSE:GME continues to evolve from its meme stock origins, the upcoming financial results could provide pivotal data points for both short-term traders and long-term investors seeking to understand its market dynamics.

GME Bull Trend AnalysisBullish trend based on the second gold cross-- along with the occurrence of a possible second (short squeeze) repeated pattern almost 4 years later.

Where I think $GME is headingThis is not financial advice. I've been following the stock for a while now. After Roaring Kitty posted the American flag emojis following the dog emoji (which I believe hints at the July 4th weekend), he then posted the microphone and eyes emojis. It seems like he might reveal something soon. Regardless of Roaring Kitty's actions, GME is looking strong on its own.

GME Gamestop Technical Analysis and Trade IdeaIn a recent video, I covered a trade idea prior to the Gamestop (GME) bull rally. Since then, we’ve observed a significant bearish movement. I’m closely monitoring the current price level for another potential buying opportunity, provided that price action aligns with my analysis from the video. The market is currently moving sideways, and if we wait for increased volatility above and below the range, we might be able to capitalize on a bullish trend by entering a break re-test and fail of the range on the 15-minute chart if we see higher highs/lows forming.
The video covers critical elements, including trend analysis, price action insights, market structure, and a potential trade setup. Always exercise prudent risk management when trading, and keep in mind that this information is purely educational and not financial advice. 🚀📊

GMS Gamestop Trade Idea and Update (previous video)We can see that GME Gamestop has rallied. If you haven't already it's time to move your stop loss to break even from my last video trade idea. In this video we look at price action and discuss a new trade idea. But ways this is for educational purposes only and not to be construed as financial advice.

GME Gamestop Technical Analysis and Trade IdeaIn our recent video, we conducted a concise technical analysis of GameStop (GME). After a bullish rally, GME became overextended, hitting resistance levels and subsequently retracing significantly. Currently, we’re closely monitoring key support levels. Our primary objective is to pinpoint an optimal buy entry point within this critical support zone, provided that price action aligns with our analysis from the video.
As always, our video provides valuable insights into trade entry points, trend analysis, market structure, and price action. Remember that this content is for educational purposes only and should not be considered financial advice. 📈🚀📊

GME Gamestop Technical Analysis and Trade Idea👉 In this video, we closely examine GameStop (GME). The stock has been range-bound for some time, showing lower highs and lower lows, indicating a slight bearish trend. Despite this, my focus is on a potential long position rather than shorting the stock. We explore a possible buying opportunity if the price action aligns with the scenario discussed. If the price continues to decline, we will abandon the idea.
In the accompanying video, we delve into the trend, market structure, price action, and other crucial elements of technical analysis. Remember, this video is purely educational and not financial advice. 📊✅

GME - Week of June 17, 2024NYSE:GME - Thesis
- Management is Ryan Cohen; the buffet approach
- With over $4 billion in cash, Game Stop has a better Price-to-Cash valuation than plenty of companies inside NQ.
- RK comes back after a three year hiatus, with transparency of his portfolio.
- Market structure is forming a moon landing to $120+ per share.
- And with a cultist group of degenerates (like myself); Hedgies Getting Wedgies - Dumb Money 2 will be made.
Despite all of this.... I can be totally wrong & management could rug pull everyone and it goes straight down to zero.
Nothing I post is financial advice nor investment advice....
I simply like this stock!

GME Bullish Setup Jun 6-7th Update#GME had a very strong close today, hitting my Main Target box to the penny!
#TTR was long #GME (again) from $24.54, we are 50% out today, near the highs, holding the rest for Friday.
#TTR was also long GME from $13.01 and we exited the most at 64.54, 57 and 51 on the main gap up day!
#TTR is also long #AMC, all the targets were posted

WBUY 2+ million shorts need to cover in the next 24 hours!This is both a short covering play and a retracement play.
Not really a short squeeze just to take some off the table.
Not financial advice!!

GAMESTOP SOARING from $25 to $111 - $168 range.GME just got $1 BILLION dollars in funding. Price expected to rise past all short squeezes in the $120 - $168 price range. This stock just went from a simple meme to opposing sides on institutional traders that even Kramer is beginning to call it a good investment (not that his opinion matters at this point with the amount he flip-flops with retail investors money)
Invest smart, invest hard. This one's to the moon.
Boost my post if you like this idea 💡
Also follow and subscribe for more uproars. Let's spread the word together.
Roaring Puppy 🐶 out.

GME Short Sale Volume Analysis: Short Selling Dynamics & Keltner
Overview:
GME is exhibiting compelling signals that warrant attention from traders and investors. We have observed significant activity in short sale volume alongside a notable expansion in the Keltner Channel. These indicators suggest potential market volatility and trend shifts in the near term.
Key Technical Indicators:
Short Sale Volume & Market Dynamics:
Short Selling Explained: Short selling involves borrowing shares of a stock and selling them on the open market with the intention of buying them back later at a lower price. Traders profit from the difference if the stock price declines. This practice is often utilized by investors who believe a stock's price will fall.
Role of Market Makers: Market makers facilitate the trading of stocks by providing liquidity. They are essential in ensuring that there are enough shares available for buying and selling, including those needed for short selling. Market makers often hedge their positions to manage risk.
Short Squeeze Potential: When the short sale volume is high, and the stock price begins to rise, short sellers may rush to buy back shares to cover their positions, fearing further losses. This buying frenzy can drive the stock price even higher, creating a short squeeze.
Keltner Channel Expansion:
The Keltner Channel, which utilizes the Average True Range (ATR) to set its boundaries, is currently expanding at the fastest rate since December 2020.
An expanding Keltner Channel indicates increasing volatility. The last time we observed such rapid expansion, it was followed by significant price action in GME, making this an essential indicator for traders.
Implications:
Bullish Sentiment: The high short sale volume suggests significant bearish bets, which could lead to a short squeeze if the price starts to rise, forcing short sellers to cover their positions.
Increased Volatility: The expanding Keltner Channel signals that GME could experience substantial price swings. This heightened volatility necessitates careful risk management, with wider stop losses to avoid premature exits during volatile price movements.
Hi! this was generated by AI because it's 02:16
version 2.0 if this picks up
cheers

GME THEY WILL BUY LOWERAs i said before, i think it's not over for GME. In my opinion, big hands will buy GameStop lower, around 14-17 and here the price will start to pump up. Actually the chart it's absorbing the flash pump we have seen some days ago, and this is good.

GME SOME HOPE AGAIN?GME Crypto has performed a nice 50x since my call around 3 months ago. That's a pretty crazy result. Are there some hope to pump again? In my hopinion, the fight has just begun. I think we will see a pump on GME Stock and GME Crypto could likely follow. Actually the price reached an interesting buy zone, and i think we can see an upside move that could lead the price near 0.18
