GMT/USDT — Descending Triangle: Breakout or Breakdown?📝 Market Overview:
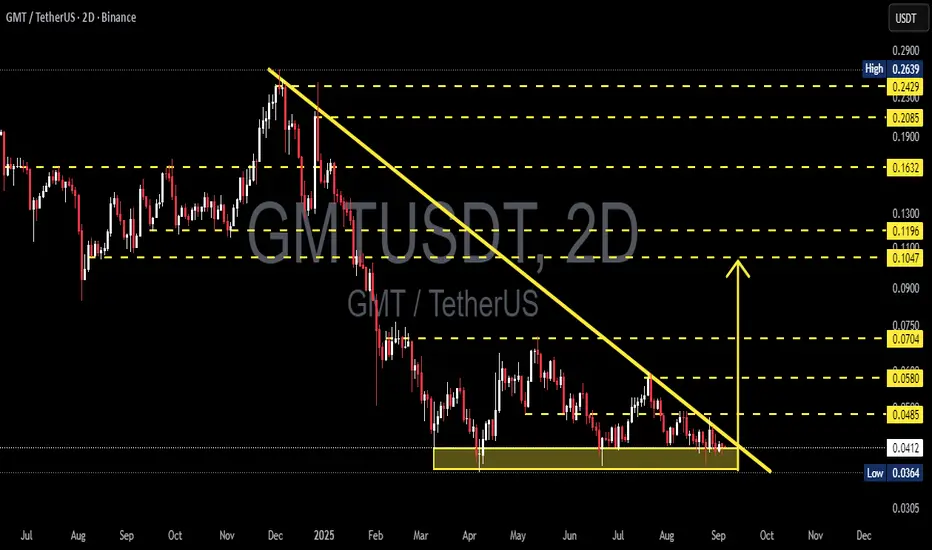
Since the early 2025 peak, GMT has been in a clear downtrend, consistently forming lower highs along the descending trendline (yellow).
Price is now consolidating within a major support zone at 0.0364 – 0.0413, which has been tested multiple times.
The structure forms a Descending Triangle: flat support + lower highs. Statistically, this pattern carries a bearish continuation bias, but a reversal scenario is not ruled out if bulls manage to reclaim key levels.
---
🔎 Pattern Significance
A Descending Triangle occurs when sellers keep pressing with lower highs, while buyers are forced to defend the same horizontal level.
➡️ Default bias: bearish (higher probability of breakdown, ~60–65%).
➡️ However, a strong breakout above the trendline often triggers a short squeeze, flipping sentiment and leading to a bullish reversal.
---
📊 Bearish Scenario (Dominant Bias)
Trigger: 2D candle close below 0.0364 with strong volume.
Target: Measured move (0.0485 – 0.0364 = 0.0121).
Breakdown projection → 0.0243.
Extra confirmation: Failed retest of broken support turning into resistance.
Risk: A weak-volume breakdown could lead to a fake-out and quick rebound.
---
📈 Bullish Scenario (Needs Strong Confirmation)
Trigger: 2D close above descending trendline and above first resistance 0.0485.
Initial targets: 0.0580 → 0.0704.
Extended target: 0.1047 if momentum builds.
Best confirmation: Successful retest of 0.0485 as new support with increased buying volume.
---
⚖️ Conclusion
The 0.036–0.041 zone is a “make-or-break” level for GMT.
As long as this support holds, bulls still have a fighting chance.
But the descending triangle pattern leans bearish → breakdown towards 0.024 remains a strong risk.
Traders should wait for a 2D candle confirmation with volume before committing to either direction.
---
📌 Trading Checklist
1. Focus on 2D candle closes (not intraday wicks).
2. Watch for volume confirmation on breakouts/breakdowns.
3. Prefer setups with retest + rejection for higher reliability.
4. Place stop-loss around invalidation levels (above resistance or below support).
5. Maintain strict risk management (R:R at least 1:2).
---
🔑 Key Technical Levels
Main Support: 0.0364 – 0.0413
Resistances: 0.0485 → 0.0580 → 0.0704 → 0.1047
Bearish target (breakdown): ~0.0243
Bullish targets (if breakout): 0.0580 → 0.0704
---
#GMT #GMTUSDT #Crypto #Altcoins #TechnicalAnalysis #DescendingTriangle #Breakout #Breakdown #SupportResistance #ChartPattern
Gmtlong
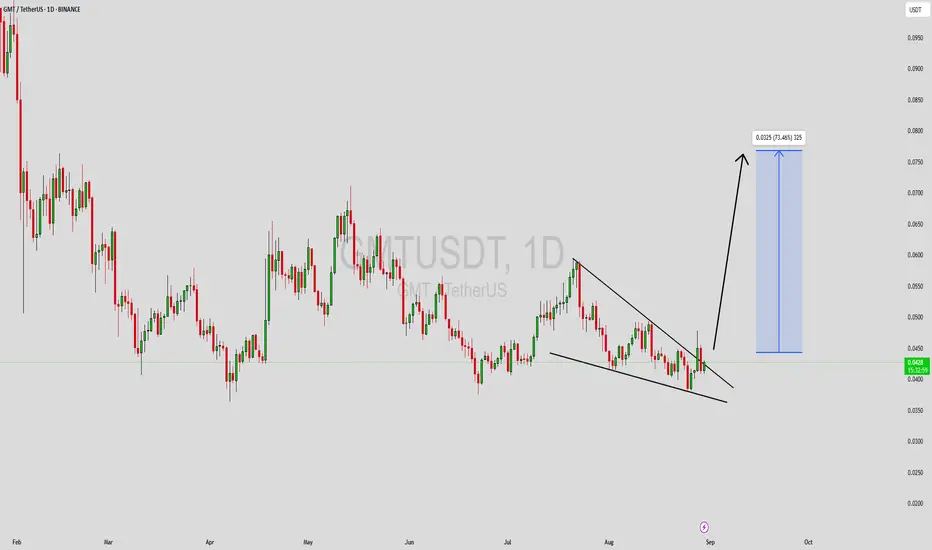
GMTUSDT Forming Bullish WaveGMTUSDT is showing signs of strength as the price structure forms a bullish breakout setup. The chart indicates that after a prolonged period of consolidation, the pair is attempting to push higher, supported by good trading volume. This increase in buying activity highlights that market participants are positioning themselves ahead of a potential trend reversal. If momentum sustains, GMTUSDT could enter a new bullish wave in the coming sessions.
With an expected gain of 60% to 70%+, this setup is drawing significant attention from traders and investors who are closely watching key breakout levels. The technical structure suggests that once price clears overhead resistance, strong upside potential could unfold rapidly. Such moves are often accompanied by increased liquidity and heightened trading interest, which further validates the bullish outlook.
Investor confidence in this project is gradually building, which can act as a catalyst for price expansion. The favorable combination of volume confirmation, technical breakout formation, and renewed interest from the community sets the stage for potential strong gains. Traders should remain attentive to continuation signals as the breakout unfolds.
✅ Show your support by hitting the like button and
✅ Leaving a comment below! (What is You opinion about this Coin)
Your feedback and engagement keep me inspired to share more insightful market analysis with you!
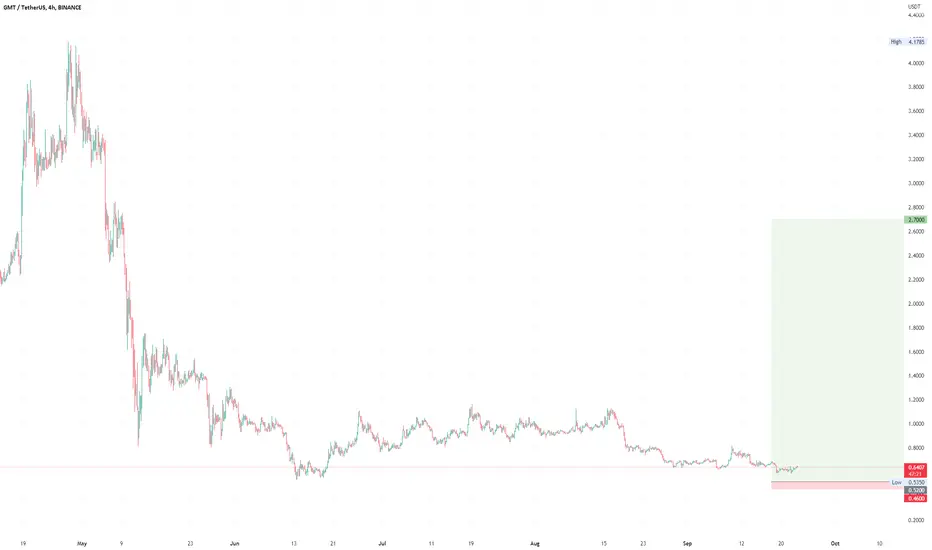
GMTUSDT Analysis: Resistance and StrategyIn GMTUSDT, the red boxes represent key resistance zones . However, caution is essential as the price is currently in a strong bullish trend .
Key Highlights:
Red Boxes as Resistance: These zones are significant but require lower time frame confirmations for short entries.
Bullish Momentum: The price shows strength, aligning with my general long position target of 102k$ .
Hedge Strategy: I will consider these levels for hedge shorts while maintaining a broader long bias.
Confirmation Indicators:
Before trading these zones, I recommend using tools such as CDV, liquidity heatmaps, volume profiles, and volume footprints for confirmation.
Learn My Techniques: Interested in mastering these advanced tools to refine your trading? DM me, and I'll teach you step by step!
Support and Motivate: If this analysis helps, please boost and comment. Your engagement drives me to share more!
If you think this analysis helps you, please don't forget to boost and comment on this. These motivate me to share more insights with you!
I keep my charts clean and simple because I believe clarity leads to better decisions.
My approach is built on years of experience and a solid track record. I don’t claim to know it all, but I’m confident in my ability to spot high-probability setups.
If you would like to learn how to use the heatmap, cumulative volume delta and volume footprint techniques that I use below to determine very accurate demand regions, you can send me a private message. I help anyone who wants it completely free of charge.
My Previous Analysis (the list is long but I think it's kinda good : )
🎯 ZENUSDT.P: Patience & Profitability | %230 Reaction from the Sniper Entry
🐶 DOGEUSDT.P: Next Move
🎨 RENDERUSDT.P: Opportunity of the Month
💎 ETHUSDT.P: Where to Retrace
🟢 BNBUSDT.P: Potential Surge
📊 BTC Dominance: Reaction Zone
🌊 WAVESUSDT.P: Demand Zone Potential
🟣 UNIUSDT.P: Long-Term Trade
🔵 XRPUSDT.P: Entry Zones
🔗 LINKUSDT.P: Follow The River
📈 BTCUSDT.P: Two Key Demand Zones
🟩 POLUSDT: Bullish Momentum
🌟 PENDLEUSDT.P: Where Opportunity Meets Precision
🔥 BTCUSDT.P: Liquidation of Highly Leveraged Longs
🌊 SOLUSDT.P: SOL's Dip - Your Opportunity
🐸 1000PEPEUSDT.P: Prime Bounce Zone Unlocked
🚀 ETHUSDT.P: Set to Explode - Don't Miss This Game Changer
🤖 IQUSDT: Smart Plan
⚡️ PONDUSDT: A Trade Not Taken Is Better Than a Losing One
💼 STMXUSDT: 2 Buying Areas
🐢 TURBOUSDT: Buy Zones and Buyer Presence
🌍 ICPUSDT.P: Massive Upside Potential | Check the Trade Update For Seeing Results
🟠 IDEXUSDT: Spot Buy Area | %26 Profit if You Trade with MSB
📌 USUALUSDT: Buyers Are Active + %70 Profit in Total
🌟 FORTHUSDT: Sniper Entry +%26 Reaction
🐳 QKCUSDT: Sniper Entry +%57 Reaction
📊 BTC.D: Retest of Key Area Highly Likely
I stopped adding to the list because it's kinda tiring to add 5-10 charts in every move but you can check my profile and see that it goes on..

GMT accumulation and distribution zonesWhere to buy and where to sell GMT for middle term? BINANCE:GMTUSDT
Possible Targets and explanation idea
➡️W timeframe finally came in to 27 zone (accumulation zone)
➡️Most negative scenario test 27 level or sweep listing low
➡️Based on market mood now absolutely 0 interest from retail investors
➡️Distribution level will be at 0.23 lvl correction + same time its a M imb
➡️ Crucial level from sellers marked horizontal line
Hope you enjoyed the content I created, You can support with your likes and comments this idea so more people can watch!
✅Disclaimer: Please be aware of the risks involved in trading. This idea was made for educational purposes only not for financial Investment Purposes.
---
• Look at my ideas about interesting altcoins in the related section down below ↓
• For more ideas please hit "Like" and "Follow"!

#GMT/USDT#GMT
The price has been moving in a downward spiral since the beginning of the year
Finally, the price appeared to break the downtrend strongly
It is expected that the price will break out from the current price of 0.1960
To upward waves, 5 consecutive upward waves are expected, with an expected target of 0.50
With significant upward momentum
and as usual follow your trading plan and manage your risk.
Be patient and good luck!
If you like this kind of analysis don't forget to like and follow

GMT target $112h time frame
-
GMT is creating a symmetrical structure that might follow the trend we predict in future. Also, this structure is similar to a rounding bottom, which will provide lots momentum for pump. Red zones are the critical resistance to build bottom structure, GMT can increase rapidly once going through these resistance without hesitation.
-
TP: 1
SL: 0.215 (spot)

#GMT/USDT#GMT
The price is moving in a descending triangle, which we penetrated once, and we are about to penetrate it again to the upside
On 3 levels of goals
Entry price is 0.3106
The first target is 0.3346
The second target is 0.3526
The third goal is 0.3725

GMTUSDTGMT lost its daily support level and returned to the 2022 support level where we saw a good price reaction to this support level. Now the daily support has become resistance and I predict that the price will react to the resistance level and again to The support will return and the upward movement will start from this point. In the end, everything depends on the trend of Bitcoin and the news of the coming days about America's attempt to destroy this industry.
⚠️ "Daily crypto market analyses I provide are personal opinions & not financial advice. Trading carries risks, so do your own research & seek advisor's help."


STEPN ($GMT): "Classic" or "Irregular" wave B ?Hi everyone!
As clearly shown on daily chart, the main trend is bearish, but at the same time, in mid term, some technical (bullish) rebound is possible which we can use as Trade.
From a technical point of view, $GMT is showing a corrective structure (ABC) which could develop with two scenarios: Wave B above the previous bottom , or irregular wave B, with a new low before triggering a new rally (bullish leg).
PREVIOUS ANALYSIS
(Click and Play on Chart below)
...trade with care! 👍
Cheers!
If you think that my analysis is useful, please...
"Like, Share and Comment" ...thank you! 💖
N.B.: Updates will follow below

GMT/USDT. BitVero Crypto Academy.
Disclamer:
We are not financial advisors. The content that we share on this website are for educational purposes and are our own personal opinions.

GMT USDT LONG & to the Moon GMT long idea - TP 0.5 - 0.54 - 0.58 and to the Moon ! In case the Bitcoin bull run continues. I have the position already open.
And don't forget to book your profits on the way!
We do not give financial advice. We just publish our ideas. :) Your profit is your responsibility!
When you like what we do give us Boost and comment!
And follow us in different socials: womenincrypto48
Join the Revolution!
Women in Crypto - WiC48
May you have more profit than you could ever wish for

GMTI don't know much about the project but think it is kinda useless but I could be wrong since I didn't do my research but hey! charts can be charted..and it has been.

GMTUSDTSTOPLOSS IS MUST
HOPE YOU LIKE MY SIGNALS SHARE WITH FRIENDS WITH STOPLOSS
PAIR GMT
Sorry for the late uploading I forget to upload
Control your emotion if you are trader

GMTUSDT Long IdeaGMTUSDT is a hidden gem waiting for a nice move and explode to all time highers. I expect it to reach its target withing the given timeframe. It wont be longer until we reach that timeframe.
My setup for this is :
: 0.51 - 0.60
TARGETS
Short Term: 0.64 , 0.70 , 0.73 , 0.76
Long Term: 1.05 - 1.30 - 1.60 - 1.95 - 2.30 - 2.66
STOP LOSS: 0.46
Please be aware with your money, its not a financial advise but rather a signal.
GMT/USDfirst of all sorry for this traffic on the chart
think GMT had acumulation and need to break out resistance level which is 0.63 then retest and go the last TP - 1,1$
it's 85% pump from this point
wish u luck

GMTbtc daytrading LONG 3590Futures Last Change Change %
Crude Oil 92.71 +0.19 +0.21%
Natural Gas 9.39 +0.05 +0.49%
Gold 1749.80 -21.60 -1.22%
Dow 32742.00 -531.00 -1.60%
S&P 500 4119.25 -81.75 -1.95%
Nasdaq 100 12823.75 -332.25 -2.53%
The indices fell by 1-4 percent.
The cue ball fell on
Market Cap: yesterday the volume of the cue ball was 50bln btc (August 25)
today the market volume has decreased by 2 billion to 38 billion cue balls.
This means that the market is short, and many have simply transferred their positions to dollar-equivalent tokens.
That's just or in the channel.
I always look at horizontal volumes. and the Daily level. If we are sitting at the daily level. Then you can enter positions from him.
My strategy is to trade only from the Cue Ball. with one single purpose. Increase the amount of cue ball on your account.
Any coins are only a means to increase the Cue Ball ...
Because the markets have all fallen, including the Cue Ball itself, then I enter into a long deal, in order to win back the fall, as a rule, after a sharp spill, there is always a rollback.
Plus, there is a daily level, the volumes are horizontal. I enter from the lower boundary of the local level. I will go out in the verney border..
at the moment. on all crypto exchanges, the cue ball was sold for 325 (#sell), and bought for 162 (#buy) bits.
Most likely, they will continue to short the market..
Open0.00003590
Stop 0.00003543
Profit 0.00003803
R>>>> 3.0

GMTUSDT Buy Setup! GMTUSDT Technical analysis update
Buy level: $1.07- $1.105
Stop loss : $1.02
TP 1 : $1.160
TP 2 : $1.230
TP 3 : $1.320
Always keep stop
Thanks
Hexa

GmtVolume like trend and confirm it. If price break resistance with big candle and high volume it can be fake but if it break and in the end of day it don't have rsi divergence we can open position but don't forgot not full risk.
Thanks for follow,boost and comment

GMT ANALYSIS GMT GOING TO HIT 1.05 TO 1.19GMT IS ON THE WAY TOWARDS 1.19 WITH STRONG RESISTANCE AT 0.943 , 1H CANDLE CLOSE ABOVE THAT AND GMT WILL HIT 1.05 , on rejection from 0.943 gmt will test its support around 0.888 and then will bounce back from this zone towards 1.05 open a long scalp either from 0.888 or on breakout from 0.943

GMTUSDT Potential PositionAs observed on the chart, GMTUSDT on the hourly timeframe has a bullish RSI divergence and it is simultaneously showing weakness in its bearish trend. Its price is highly likely to move up until its CHOCH zone.
Once price taps this zone it would probably continue its bearish trend and give us an entry for a short position. However if the CHOCH zone is broken, price could reverse its trend and continue the bullish movement.

back to long Trades Hello
I think we start back to long trades we are in good area to reversal
BE STRONG AND DON'T FORGET SL
hope everyone can make profits

Stop buying GMTAn unfinished ABC correction, a huge hype, a bunch of non-professional traders buying off every strait.
What other reasons are needed to definitely go even lower? We know what faith in a project is, but it's more like a financial pyramid from which it's not too late to get out. Ready to sit out another -55%?
We closed all the takes back in April and have been short since May 4, the choice is yours.
Attached a link to a similar situation with SHIB.
