GMTUSDT UPDATE#GMT
UPDATE
GMT Technical Setup
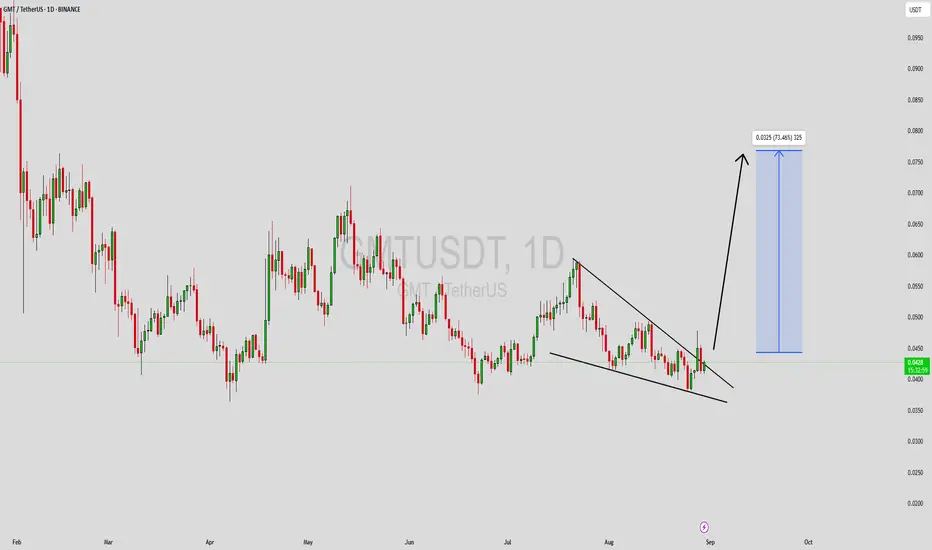
Pattern: Falling Wedge Pattern
Current Price: 0.02143$
Target Price: 0.03060$
Target % Gain: 112.84%
Technical Analysis: GMT is breaking out of a falling wedge pattern on the 1D timeframe, signaling a bullish reversal after an extended downtrend. Price has pushed above the descending resistance trendline and is showing follow-through strength, suggesting buyers are gaining control. The projected upside target is derived from the height of the wedge, pointing toward the 0.030–0.031$ region, which also aligns with a previous resistance zone. A sustained hold above the breakout area would support continuation toward the target.
Time Frame: 1D
Risk Management Tip: Always use proper risk management.
GMTUSDTPERP

GMT/USDT — Descending Triangle: Breakout or Breakdown?📝 Market Overview:
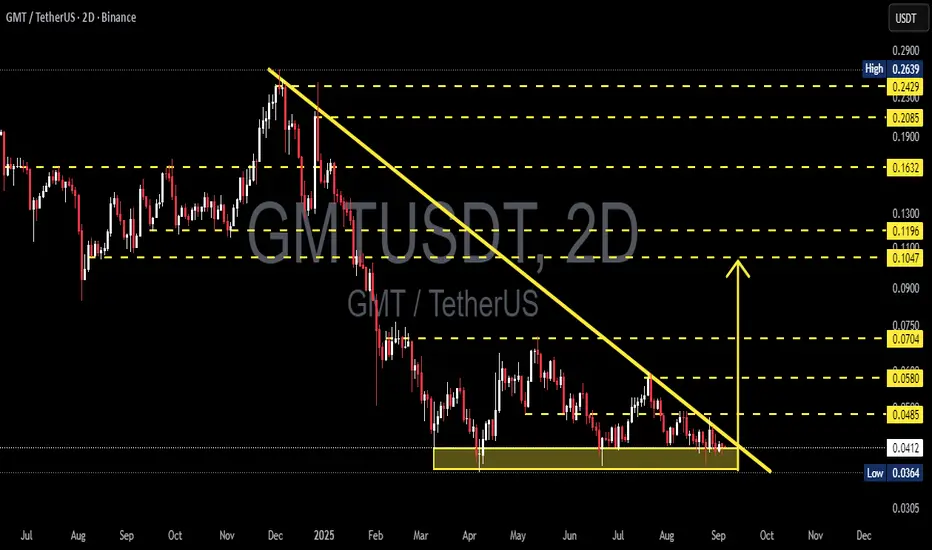
Since the early 2025 peak, GMT has been in a clear downtrend, consistently forming lower highs along the descending trendline (yellow).
Price is now consolidating within a major support zone at 0.0364 – 0.0413, which has been tested multiple times.
The structure forms a Descending Triangle: flat support + lower highs. Statistically, this pattern carries a bearish continuation bias, but a reversal scenario is not ruled out if bulls manage to reclaim key levels.
---
🔎 Pattern Significance
A Descending Triangle occurs when sellers keep pressing with lower highs, while buyers are forced to defend the same horizontal level.
➡️ Default bias: bearish (higher probability of breakdown, ~60–65%).
➡️ However, a strong breakout above the trendline often triggers a short squeeze, flipping sentiment and leading to a bullish reversal.
---
📊 Bearish Scenario (Dominant Bias)
Trigger: 2D candle close below 0.0364 with strong volume.
Target: Measured move (0.0485 – 0.0364 = 0.0121).
Breakdown projection → 0.0243.
Extra confirmation: Failed retest of broken support turning into resistance.
Risk: A weak-volume breakdown could lead to a fake-out and quick rebound.
---
📈 Bullish Scenario (Needs Strong Confirmation)
Trigger: 2D close above descending trendline and above first resistance 0.0485.
Initial targets: 0.0580 → 0.0704.
Extended target: 0.1047 if momentum builds.
Best confirmation: Successful retest of 0.0485 as new support with increased buying volume.
---
⚖️ Conclusion
The 0.036–0.041 zone is a “make-or-break” level for GMT.
As long as this support holds, bulls still have a fighting chance.
But the descending triangle pattern leans bearish → breakdown towards 0.024 remains a strong risk.
Traders should wait for a 2D candle confirmation with volume before committing to either direction.
---
📌 Trading Checklist
1. Focus on 2D candle closes (not intraday wicks).
2. Watch for volume confirmation on breakouts/breakdowns.
3. Prefer setups with retest + rejection for higher reliability.
4. Place stop-loss around invalidation levels (above resistance or below support).
5. Maintain strict risk management (R:R at least 1:2).
---
🔑 Key Technical Levels
Main Support: 0.0364 – 0.0413
Resistances: 0.0485 → 0.0580 → 0.0704 → 0.1047
Bearish target (breakdown): ~0.0243
Bullish targets (if breakout): 0.0580 → 0.0704
---
#GMT #GMTUSDT #Crypto #Altcoins #TechnicalAnalysis #DescendingTriangle #Breakout #Breakdown #SupportResistance #ChartPattern
GMTUSDT Forming Bullish WaveGMTUSDT is showing signs of strength as the price structure forms a bullish breakout setup. The chart indicates that after a prolonged period of consolidation, the pair is attempting to push higher, supported by good trading volume. This increase in buying activity highlights that market participants are positioning themselves ahead of a potential trend reversal. If momentum sustains, GMTUSDT could enter a new bullish wave in the coming sessions.
With an expected gain of 60% to 70%+, this setup is drawing significant attention from traders and investors who are closely watching key breakout levels. The technical structure suggests that once price clears overhead resistance, strong upside potential could unfold rapidly. Such moves are often accompanied by increased liquidity and heightened trading interest, which further validates the bullish outlook.
Investor confidence in this project is gradually building, which can act as a catalyst for price expansion. The favorable combination of volume confirmation, technical breakout formation, and renewed interest from the community sets the stage for potential strong gains. Traders should remain attentive to continuation signals as the breakout unfolds.
✅ Show your support by hitting the like button and
✅ Leaving a comment below! (What is You opinion about this Coin)
Your feedback and engagement keep me inspired to share more insightful market analysis with you!
GMT/USDT Breakout Alert! Major Downtrend Broken🔻 End of a Long-Term Downtrend?
GMT has been in a strong downtrend since late 2024. A clearly defined descending trendline has acted as strong resistance—until now. The price has bounced from the major support zone between $0.0364 and $0.0425, which has held multiple times since March 2025.
🚀 Breakout Confirmation in Progress:
The chart shows a potential breakout from the descending trendline (yellow). A confirmed breakout with volume would indicate the start of a bullish reversal pattern.
🎯 Key Resistance / Profit Targets:
$0.0474 – Initial minor resistance
$0.0555 – First bullish confirmation
$0.0665 to $0.0744 – Medium-term target
$0.0977 to $0.1302 – Strong upside potential
$0.2108 to $0.2471 – Full bullish target zone if momentum continues
📌 Additional Notes:
The highlighted yellow area is a demand zone signaling potential accumulation.
This setup aligns with classic breakout-reversal formations.
Excellent risk/reward due to proximity to strong support.
#GMTUSDT #GMT #CryptoBreakout #AltcoinSeason #CryptoReversal
#TechnicalAnalysis #BreakoutCrypto #TradingSignals #CryptoTA
#BinanceTrading

GMTUSDT 1D AnalysisGMT ~ 1D Analysis
#GMT Buy back gradually from here if you still have confidence in this coin with a short term target of at least 15%+ from here.

GMTUSDT 1D AnalysisGMT ~ 1D Analysis
#GMT Buy gradually from here if you still have confidence in this coin with a short term target of at least 10%++ from here.

GMTUSDT Analysis: Resistance and StrategyIn GMTUSDT, the red boxes represent key resistance zones . However, caution is essential as the price is currently in a strong bullish trend .
Key Highlights:
Red Boxes as Resistance: These zones are significant but require lower time frame confirmations for short entries.
Bullish Momentum: The price shows strength, aligning with my general long position target of 102k$ .
Hedge Strategy: I will consider these levels for hedge shorts while maintaining a broader long bias.
Confirmation Indicators:
Before trading these zones, I recommend using tools such as CDV, liquidity heatmaps, volume profiles, and volume footprints for confirmation.
Learn My Techniques: Interested in mastering these advanced tools to refine your trading? DM me, and I'll teach you step by step!
Support and Motivate: If this analysis helps, please boost and comment. Your engagement drives me to share more!
If you think this analysis helps you, please don't forget to boost and comment on this. These motivate me to share more insights with you!
I keep my charts clean and simple because I believe clarity leads to better decisions.
My approach is built on years of experience and a solid track record. I don’t claim to know it all, but I’m confident in my ability to spot high-probability setups.
If you would like to learn how to use the heatmap, cumulative volume delta and volume footprint techniques that I use below to determine very accurate demand regions, you can send me a private message. I help anyone who wants it completely free of charge.
My Previous Analysis (the list is long but I think it's kinda good : )
🎯 ZENUSDT.P: Patience & Profitability | %230 Reaction from the Sniper Entry
🐶 DOGEUSDT.P: Next Move
🎨 RENDERUSDT.P: Opportunity of the Month
💎 ETHUSDT.P: Where to Retrace
🟢 BNBUSDT.P: Potential Surge
📊 BTC Dominance: Reaction Zone
🌊 WAVESUSDT.P: Demand Zone Potential
🟣 UNIUSDT.P: Long-Term Trade
🔵 XRPUSDT.P: Entry Zones
🔗 LINKUSDT.P: Follow The River
📈 BTCUSDT.P: Two Key Demand Zones
🟩 POLUSDT: Bullish Momentum
🌟 PENDLEUSDT.P: Where Opportunity Meets Precision
🔥 BTCUSDT.P: Liquidation of Highly Leveraged Longs
🌊 SOLUSDT.P: SOL's Dip - Your Opportunity
🐸 1000PEPEUSDT.P: Prime Bounce Zone Unlocked
🚀 ETHUSDT.P: Set to Explode - Don't Miss This Game Changer
🤖 IQUSDT: Smart Plan
⚡️ PONDUSDT: A Trade Not Taken Is Better Than a Losing One
💼 STMXUSDT: 2 Buying Areas
🐢 TURBOUSDT: Buy Zones and Buyer Presence
🌍 ICPUSDT.P: Massive Upside Potential | Check the Trade Update For Seeing Results
🟠 IDEXUSDT: Spot Buy Area | %26 Profit if You Trade with MSB
📌 USUALUSDT: Buyers Are Active + %70 Profit in Total
🌟 FORTHUSDT: Sniper Entry +%26 Reaction
🐳 QKCUSDT: Sniper Entry +%57 Reaction
📊 BTC.D: Retest of Key Area Highly Likely
I stopped adding to the list because it's kinda tiring to add 5-10 charts in every move but you can check my profile and see that it goes on..

GMTUSDT 1WGMT ~ 1W
#GMT This is the final support for this Coin,. If you still have Conviction on this coin,. Buy in stages, Target 20%++

Stepn GMT price analysisWhile the crypto market continues to stagnate, long-forgotten “hype” projects are trying to “shoot”)
🚀 For example, they decided to give a ray of hope to fans of #Stepn OKX:GMTUSDT sneakers
Although there is a prospect of growth of at least x2 to $0.38-0.40, we don't want to buy this asset.
🆗 Because the pump can end at any second and then again many months of sitting in a drawdown.
‼️ Therefore, we would consider this one-time growth as an opportunity to exit the position at $0.40, and if you are lucky, at $0.60 - it's hard to believe higher.
_____________________
Did you like our analysis? Leave a comment, like, and follow to get more

GMTUSDT 1WGMT ~ 1W
#GMT So far this support block continues to keep the price from dropping any lower. If you have Conviction on this coin,. Buy in stages from here with a minimum target of 20%+

GMT Swing Long GMT position-Adding to swing long.
Under 0.1330.
Tp 0.1600
0.1900
Stoping if clean breaks 0.1300.
0.1300 is a good SR flip here.
RR pretty good from here.
Note: Not a Financial Advise.

GMT possible BIG move SoonerHolding at a very nice area.
Longed some here with Little risk(tight stop)
Entry: 0.12112
SL: 0.11900 Flat
Targeting
0.15500
0.19000
Can move strong for next up move targeting the supply area.
Note: Not a Financial advice.

GMT accumulation and distribution zonesWhere to buy and where to sell GMT for middle term? BINANCE:GMTUSDT
Possible Targets and explanation idea
➡️W timeframe finally came in to 27 zone (accumulation zone)
➡️Most negative scenario test 27 level or sweep listing low
➡️Based on market mood now absolutely 0 interest from retail investors
➡️Distribution level will be at 0.23 lvl correction + same time its a M imb
➡️ Crucial level from sellers marked horizontal line
Hope you enjoyed the content I created, You can support with your likes and comments this idea so more people can watch!
✅Disclaimer: Please be aware of the risks involved in trading. This idea was made for educational purposes only not for financial Investment Purposes.
---
• Look at my ideas about interesting altcoins in the related section down below ↓
• For more ideas please hit "Like" and "Follow"!

GMT Holders! FOLLOW ME~!Hello, guys!
This is ESS team.
This Chart is GMTUSDT.
If it is supported by the ORANGE downtrend line, It is expected to break through the RED long-term downtrend line.
After breaking through, It will reach the PURPLE downtrend line as it can.
If it isn't supported by the ORANGE line, It will try to rise again after consolidation at the GREEN downtrend line.

GMT should move Now.Before a much bigger move GMT should move now.
Longed 0.2277.
If it holds here it can move targeting 0.25 and 0.29.
Will add more slightly lower.
Using slightly wide stop for now but will look into the PA and if it Hold under 2250
I'll scale out.
Note:Not a financial Advice.

#GMT/USDT#GMT
The price has been moving in a downward spiral since the beginning of the year
Finally, the price appeared to break the downtrend strongly
It is expected that the price will break out from the current price of 0.1960
To upward waves, 5 consecutive upward waves are expected, with an expected target of 0.50
With significant upward momentum
and as usual follow your trading plan and manage your risk.
Be patient and good luck!
If you like this kind of analysis don't forget to like and follow

GMT target $112h time frame
-
GMT is creating a symmetrical structure that might follow the trend we predict in future. Also, this structure is similar to a rounding bottom, which will provide lots momentum for pump. Red zones are the critical resistance to build bottom structure, GMT can increase rapidly once going through these resistance without hesitation.
-
TP: 1
SL: 0.215 (spot)

GMT/USDT GETTING READYThe GMT/USDT pair is currently testing a significant horizontal resistance level, which indicates a potential breakout. Additionally, there are signs that the price is also attempting to break above a key trendline. If these breakouts are successful, it is likely that we will see a substantial bullish movement in the price of GMT. It is important to note that this information is not financial advice, and individuals should conduct their own research (DYOR) before making any investment decisions.

Trade signal | STEPN (GMT) completed setup for upto 37% pumpHi dear members , hope you are well and welcome to the new trade setup of STEPN (GMT) with US Dollar pair.
Previously we caught almost 21% pump of GMT as below:
Now on a daily time frame, GMT has formed a bullish BAT move for the next price reversal.
Note: Above idea is for educational purpose only. It is advised to diversify and strictly follow the stop loss, and don't get stuck with trade.

#GMT/USDT#GMT
The price is moving in a descending triangle, which we penetrated once, and we are about to penetrate it again to the upside
On 3 levels of goals
Entry price is 0.3106
The first target is 0.3346
The second target is 0.3526
The third goal is 0.3725

GMTUSD 3DGMT ~ 3D 📈
#GMT Just need to break this resistance line for the bulls to dominate again. Make purchases gradually here, with a minimum target of 20%++

GMT /USDT bullish ride from key demand? 👀 🚀 GMT today analysis💎 Paradisers, cast your eyes on #GMTUSDT! A striking trend has emerged as it finds its footing in a demand zone, hinting at an upcoming bullish journey.
💎 #GMT is threading through a descending channel and is on the verge of hitting a significant supply zone at $0.3203. As it approaches this supply level, keeping up the pace could drastically enhance the odds of breaking through. With sustained upward momentum, we're on track for promising bullish prospects.
💎 If the drive behind NZX:GMT starts to diminish, we're poised to seize a potential uplift from the key demand level at $0.2495. However, a descent below this critical juncture could signal a potential turn towards bearish territory.
💎 As always, ensure you're navigating with smart trading strategies and setting appropriate stop-losses! Keep an eye on the evolving market and stay tuned for further updates.

GMT Good for scalpGMT Looks good for a scalp move. Actually i am waiting to enter a bit lower as a retest of the trendline, but it's not bad to start entering now. Stoploss below recent lows and target the next liquidity area, around 0.33.
