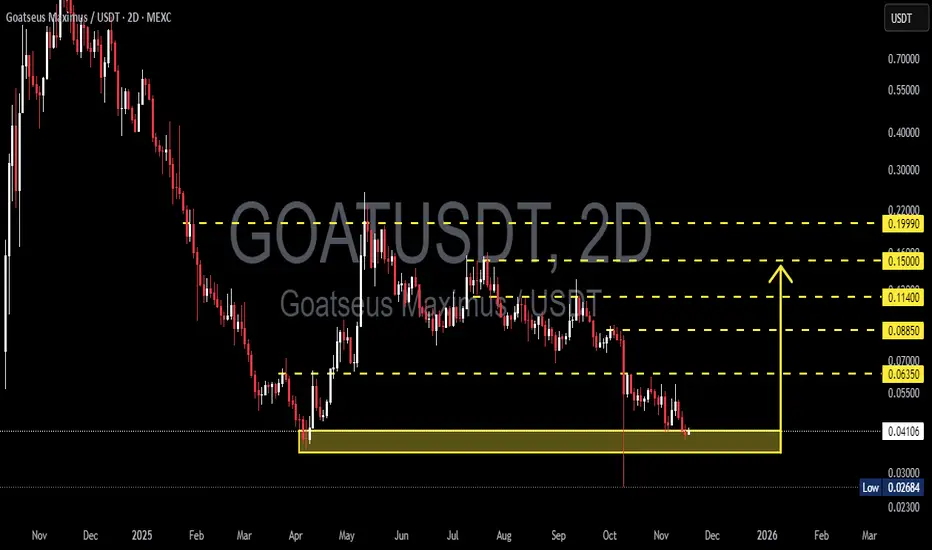
GOAT/USDT — Critical Decision Zone: Major Reversal or Breakdown?GOAT is now sitting at the most critical level since its earlier distribution phase: the price has returned to retest the Primary Structural Base at 0.041–0.035, a zone that previously triggered a major bullish expansion.
This area is not just support — it is the battleground that decides the next macro direction.
The entire downtrend from the peak has formed a consistent descending wave structure, yet each drop into the 0.041–0.035 block has been met with aggressive buy absorption. This indicates that a large liquidity cluster sits within this zone and may act as the pivot for a significant reversal.
---
Pattern & Market Structure Overview
Price action is currently forming a low-compression pattern into the key support.
This typically ends with either:
a strong impulsive reversal, or
a high-momentum breakdown into deeper liquidity zones.
The latest 2D candle closed right above the upper boundary (0.041), showing buyers are still defending — but the momentum remains fragile.
Overhead resistance levels (0.0635 → 0.0885 → 0.114 → 0.150 → 0.1999) form a clean ladder of recovery targets if a bounce is confirmed.
---
Bullish Scenario — “Major Accumulation Rebound”
This scenario activates if:
1. Price holds and rebounds strongly from 0.041–0.035.
2. A clean 2D close above 0.0635 appears — this zone is the Bullish Trigger.
Once confirmed, the market shifts from a downtrend into a recovery structure, with step targets:
0.0635 → Reversal validation
0.0885 → Momentum expansion
0.114–0.150 → Mid-range trend shift
0.1999 → Major structural retest
From the support zone to the upper targets, the upside potential can reach +300%, but only with full bullish confirmation.
---
Bearish Scenario — “Liquidity Flush Breakdown”
A strong breakdown below 0.035 signals buyer exhaustion.
If that occurs:
Price will likely drop quickly into 0.02684 (previous liquidity wick).
If 0.02684 fails, the chart may enter a capitulation phase, opening the path toward the low 0.02 region.
This would confirm the continuation of the primary downtrend.
---
Core Conclusion
GOAT is positioned inside a macro decision zone.
The 0.041–0.035 range determines whether we see:
the end of the prolonged bearish cycle and the beginning of a major reversal, or
the start of a deeper capitulation leg, as the market hunts lower liquidity.
This makes the zone both the highest-reward entry area and the highest-risk failure point.
#GOATUSDT #GOAT #CryptoAnalysis #PriceAction #SupportZone #Breakout #BullishScenario #BearishScenario #CryptoTA #TechnicalAnalysis
Goatanalysis
GOATUSDT Retest at Key Demand Zone – Accumulation or Breakdown?🔍 Comprehensive Technical Analysis
After experiencing a prolonged downtrend since late 2024, GOATUSDT finally broke out of a long-term descending trendline in early May 2025 — a potential early signal of a medium-term trend reversal. However, the price has now pulled back, retesting a major support zone that coincides with the previous breakout structure.
---
🧱 Key Zone: Demand Area + Trendline Retest
Price is currently trading within a crucial demand zone between $0.090 – $0.100, which previously acted as a major resistance and now serves as support. This area is technically significant due to:
Confluence of horizontal support and the retest of the descending trendline.
A previous accumulation zone that led to a breakout.
Clear historical buyer reaction from this region.
---
📐 Price Structure & Pattern
Descending Triangle Breakout: Successfully broken to the upside in May.
Support-turned-Resistance-turned-Support: A classic structure flip.
Horizontal Consolidation: Price is ranging in a narrow zone, indicating either accumulation or distribution.
---
🐂 Bullish Scenario (Potential Rebound):
If the price holds and bounces with increased volume from the $0.090 – $0.100 zone, it could confirm a strong accumulation phase and initiate the next leg up.
🎯 Bullish targets:
1. $0.15745 — Minor resistance
2. $0.21071 — Psychological and technical resistance
3. $0.24889 — Fibonacci extension level
4. $0.41017 — Mid-term breakout target
> Bullish confirmation: Bullish engulfing or hammer candle with high volume from the demand zone.
---
🐻 Bearish Scenario (Breakdown Risk):
If the price breaks below $0.093 and closes with strong bearish volume, this may confirm weakness and trigger a deeper correction.
📉 Downside targets:
$0.06500 — Minor historical support
$0.04900 — Previous base level
$0.03550 — All-time low (critical support)
> Bearish confirmation: Clean breakdown followed by a failed retest back into the range.
---
📊 Strategic Summary:
GOATUSDT is currently at a pivotal decision point. The zone between $0.093–$0.100 acts as a battleground for bulls and bears. A bounce could signal accumulation and a bullish reversal, while a breakdown could lead to continuation of the bearish trend.
🎯 Key focus: Price action and volume reaction at the demand zone.
---
🧲 Bullish Narrative Catalysts:
Renewed interest in low-cap altcoins
Gradual increase in volume since the breakout
Selling pressure weakening near key support
#GOATUSDT #CryptoBreakout #TrendlineRetest #TechnicalAnalysis #AltcoinAnalysis
#DemandZone #SmartMoneyConcepts #BreakoutOrFakeout

GOATUSDT Breakout Retest: Ready for the Next Bullish Leg?The daily chart of GOATUSDT reveals a significant technical development as price breaks out of a long-term descending trendline and is now performing a crucial retest of a key support zone. This movement is attracting attention from swing traders and mid-term investors alike.
---
🔍 Pattern Analysis & Market Structure
Main Pattern: Breakout from a long-standing descending trendline (yellow line) that has capped price action since November 2024.
Key Consolidation Zone: A visible accumulation area (yellow box) between 0.10914 (Fib 0.618) and 0.11864 (Fib 0.5), now being retested as new support.
Fibonacci Retracement: Applied from the peak to the bottom to identify logical target zones and potential resistance.
Breakout Confirmation: Price cleanly broke above the trendline, pulled back to retest support, and is showing signs of holding — a potential bullish continuation signal.
---
🟢 Bullish Scenario
If price holds above the 0.11–0.12 zone:
The breakout is validated and opens room for a continued rally.
Key upside targets based on Fibonacci levels:
🔼 0.15745 – first resistance
🔼 0.21071 to 0.24889 – mid-range resistance cluster
🔼 0.41017 to 0.86054 – longer-term price targets
Bullish confirmation via price action or volume spikes can solidify this outlook.
---
🔴 Bearish Scenario
If price fails to hold the support zone:
A breakdown below 0.10914 invalidates the breakout, indicating a false breakout trap.
Downside targets may include:
0.09000 – local support
0.06500 and 0.03550 – major historical support zones
This scenario would likely reignite bearish momentum.
---
⚠️ Conclusion
GOATUSDT is currently at a critical technical crossroad. The recent breakout and retest could signify a structural trend reversal. If the current support holds, the potential for upside is significant. However, a failure here could lead to deeper correction or consolidation.
---
📌 Key Levels to Watch:
Support: 0.109 – 0.118
Resistance: 0.15745 / 0.21071 / 0.24889 / 0.41017
#GOATUSDT #CryptoBreakout #TechnicalAnalysis #AltcoinSeason #TrendlineBreakout #SupportResistance #FibonacciLevels #SwingTrade #PriceAction #CryptoTA

GOAT descending channelGOAT / USDT
Know nothing about this coin but i see giant descending channel which is bullish pattern
As long as holding above red trend line support its bullish .. primary target is upper trendline and if we got a breakout strong move will occur
Keep an eye on it

GOATUSDT 1DGOAT ~ 1D
#GOAT This is the main support block that has been keeping the price from dropping any lower. buy gradually from here, target 20%++

$GOAT/USDT Poised for 20% Breakout After Consolidation!MIL:GOAT USDT Long Trade Setup
Entry Zone: $0.74 to $0.77
Targets:
$0.82
$0.90
$1.10
$1.48
Stop-Loss (SL): $0.70
Leverage: 3X to 5X
DYOR ,NFA
#Crypto
