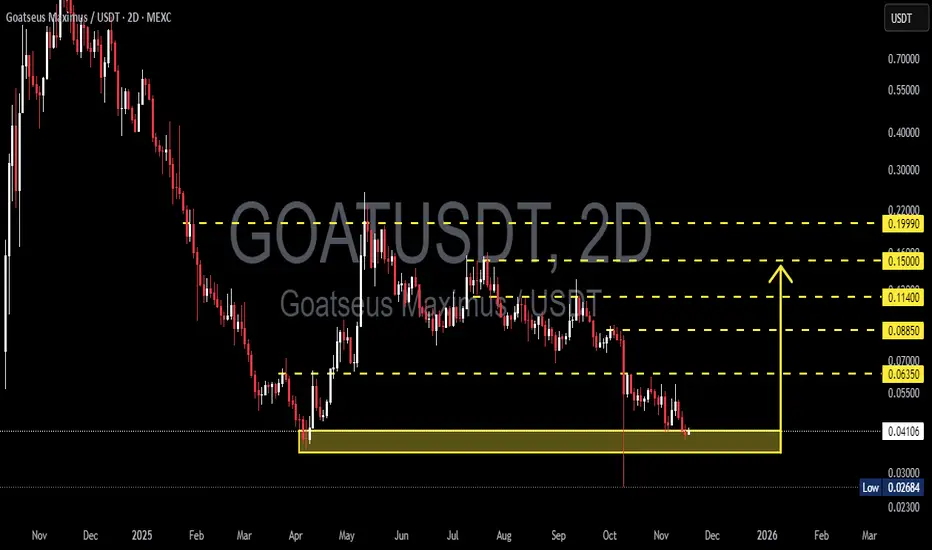
GOAT/USDT — Critical Decision Zone: Major Reversal or Breakdown?GOAT is now sitting at the most critical level since its earlier distribution phase: the price has returned to retest the Primary Structural Base at 0.041–0.035, a zone that previously triggered a major bullish expansion.
This area is not just support — it is the battleground that decides the next macro direction.
The entire downtrend from the peak has formed a consistent descending wave structure, yet each drop into the 0.041–0.035 block has been met with aggressive buy absorption. This indicates that a large liquidity cluster sits within this zone and may act as the pivot for a significant reversal.
---
Pattern & Market Structure Overview
Price action is currently forming a low-compression pattern into the key support.
This typically ends with either:
a strong impulsive reversal, or
a high-momentum breakdown into deeper liquidity zones.
The latest 2D candle closed right above the upper boundary (0.041), showing buyers are still defending — but the momentum remains fragile.
Overhead resistance levels (0.0635 → 0.0885 → 0.114 → 0.150 → 0.1999) form a clean ladder of recovery targets if a bounce is confirmed.
---
Bullish Scenario — “Major Accumulation Rebound”
This scenario activates if:
1. Price holds and rebounds strongly from 0.041–0.035.
2. A clean 2D close above 0.0635 appears — this zone is the Bullish Trigger.
Once confirmed, the market shifts from a downtrend into a recovery structure, with step targets:
0.0635 → Reversal validation
0.0885 → Momentum expansion
0.114–0.150 → Mid-range trend shift
0.1999 → Major structural retest
From the support zone to the upper targets, the upside potential can reach +300%, but only with full bullish confirmation.
---
Bearish Scenario — “Liquidity Flush Breakdown”
A strong breakdown below 0.035 signals buyer exhaustion.
If that occurs:
Price will likely drop quickly into 0.02684 (previous liquidity wick).
If 0.02684 fails, the chart may enter a capitulation phase, opening the path toward the low 0.02 region.
This would confirm the continuation of the primary downtrend.
---
Core Conclusion
GOAT is positioned inside a macro decision zone.
The 0.041–0.035 range determines whether we see:
the end of the prolonged bearish cycle and the beginning of a major reversal, or
the start of a deeper capitulation leg, as the market hunts lower liquidity.
This makes the zone both the highest-reward entry area and the highest-risk failure point.
#GOATUSDT #GOAT #CryptoAnalysis #PriceAction #SupportZone #Breakout #BullishScenario #BearishScenario #CryptoTA #TechnicalAnalysis
GOATUSD
GOATUSDT: 1000%+ Potential!GOAT has seen extreme volatility over the past year. After a massive 97% drop from the peak, the price staged a strong recovery of over 570% from the bottom. Now, the chart is showing a bullish continuation wedge formation, suggesting momentum may be shifting again.
Key Highlights
Structure: Price consolidating inside a bullish wedge pattern.
Volume Profile: Recent move broke through a key resistance zone, showing buyers stepping in.
Moving Averages: Price reclaiming EMAs will act as dynamic support.
Upside Potential: Technical projection points to a strong continuation move if the wedge breakout confirms.
📈 Trading Plan
Entry Zone: Above $0.11.
Target (TP): 300%- 1000%
Stop-Loss (SL): Below $0.074 support
Cheers
Hexa

GOATUSDT Retest at Key Demand Zone – Accumulation or Breakdown?🔍 Comprehensive Technical Analysis
After experiencing a prolonged downtrend since late 2024, GOATUSDT finally broke out of a long-term descending trendline in early May 2025 — a potential early signal of a medium-term trend reversal. However, the price has now pulled back, retesting a major support zone that coincides with the previous breakout structure.
---
🧱 Key Zone: Demand Area + Trendline Retest
Price is currently trading within a crucial demand zone between $0.090 – $0.100, which previously acted as a major resistance and now serves as support. This area is technically significant due to:
Confluence of horizontal support and the retest of the descending trendline.
A previous accumulation zone that led to a breakout.
Clear historical buyer reaction from this region.
---
📐 Price Structure & Pattern
Descending Triangle Breakout: Successfully broken to the upside in May.
Support-turned-Resistance-turned-Support: A classic structure flip.
Horizontal Consolidation: Price is ranging in a narrow zone, indicating either accumulation or distribution.
---
🐂 Bullish Scenario (Potential Rebound):
If the price holds and bounces with increased volume from the $0.090 – $0.100 zone, it could confirm a strong accumulation phase and initiate the next leg up.
🎯 Bullish targets:
1. $0.15745 — Minor resistance
2. $0.21071 — Psychological and technical resistance
3. $0.24889 — Fibonacci extension level
4. $0.41017 — Mid-term breakout target
> Bullish confirmation: Bullish engulfing or hammer candle with high volume from the demand zone.
---
🐻 Bearish Scenario (Breakdown Risk):
If the price breaks below $0.093 and closes with strong bearish volume, this may confirm weakness and trigger a deeper correction.
📉 Downside targets:
$0.06500 — Minor historical support
$0.04900 — Previous base level
$0.03550 — All-time low (critical support)
> Bearish confirmation: Clean breakdown followed by a failed retest back into the range.
---
📊 Strategic Summary:
GOATUSDT is currently at a pivotal decision point. The zone between $0.093–$0.100 acts as a battleground for bulls and bears. A bounce could signal accumulation and a bullish reversal, while a breakdown could lead to continuation of the bearish trend.
🎯 Key focus: Price action and volume reaction at the demand zone.
---
🧲 Bullish Narrative Catalysts:
Renewed interest in low-cap altcoins
Gradual increase in volume since the breakout
Selling pressure weakening near key support
#GOATUSDT #CryptoBreakout #TrendlineRetest #TechnicalAnalysis #AltcoinAnalysis
#DemandZone #SmartMoneyConcepts #BreakoutOrFakeout

GOAT Looks Bullish (12H)It seems that a wave A of a higher-degree structure has completed, and the price is forming a triangle at the bottom, preparing for an upward movement in the form of either a wave B or a new impulse wave. Since this wave belongs to a higher degree, we expect the upcoming bullish wave to take time and show a significant upward retracement.
Try to avoid entering during pumps, and instead focus on entries during price corrections.
As long as the green zone holds, the price has the potential to move upward.
A daily candle closing below the invalidation level will invalidate this outlook.
For risk management, please don't forget stop loss and capital management
When we reach the first target, save some profit and then change the stop to entry
Comment if you have any questions
Thank You

GOATUSDT Breakout Retest: Ready for the Next Bullish Leg?The daily chart of GOATUSDT reveals a significant technical development as price breaks out of a long-term descending trendline and is now performing a crucial retest of a key support zone. This movement is attracting attention from swing traders and mid-term investors alike.
---
🔍 Pattern Analysis & Market Structure
Main Pattern: Breakout from a long-standing descending trendline (yellow line) that has capped price action since November 2024.
Key Consolidation Zone: A visible accumulation area (yellow box) between 0.10914 (Fib 0.618) and 0.11864 (Fib 0.5), now being retested as new support.
Fibonacci Retracement: Applied from the peak to the bottom to identify logical target zones and potential resistance.
Breakout Confirmation: Price cleanly broke above the trendline, pulled back to retest support, and is showing signs of holding — a potential bullish continuation signal.
---
🟢 Bullish Scenario
If price holds above the 0.11–0.12 zone:
The breakout is validated and opens room for a continued rally.
Key upside targets based on Fibonacci levels:
🔼 0.15745 – first resistance
🔼 0.21071 to 0.24889 – mid-range resistance cluster
🔼 0.41017 to 0.86054 – longer-term price targets
Bullish confirmation via price action or volume spikes can solidify this outlook.
---
🔴 Bearish Scenario
If price fails to hold the support zone:
A breakdown below 0.10914 invalidates the breakout, indicating a false breakout trap.
Downside targets may include:
0.09000 – local support
0.06500 and 0.03550 – major historical support zones
This scenario would likely reignite bearish momentum.
---
⚠️ Conclusion
GOATUSDT is currently at a critical technical crossroad. The recent breakout and retest could signify a structural trend reversal. If the current support holds, the potential for upside is significant. However, a failure here could lead to deeper correction or consolidation.
---
📌 Key Levels to Watch:
Support: 0.109 – 0.118
Resistance: 0.15745 / 0.21071 / 0.24889 / 0.41017
#GOATUSDT #CryptoBreakout #TechnicalAnalysis #AltcoinSeason #TrendlineBreakout #SupportResistance #FibonacciLevels #SwingTrade #PriceAction #CryptoTA

GOAT - LONGRisky but high profit entry. Be very careful. If it breaks that support it will go very low.
TP 1: 0.75
TP 2: 0.92

GOAT ANALYSIS (6H)It seems that GOAT is completing its corrective waves. This correction appears to be a double correction.
The second part of this correction looks like either a diametric or a symmetrical pattern.
There is potential for rejection toward the green zone if it reaches the red zone.
A daily candle closing above the invalidation level will invalidate our bearish outlook.
invalidation level: 0.17751
For risk management, please don't forget stop loss and capital management
Comment if you have any questions
Thank You

GOAT descending channelGOAT / USDT
Know nothing about this coin but i see giant descending channel which is bullish pattern
As long as holding above red trend line support its bullish .. primary target is upper trendline and if we got a breakout strong move will occur
Keep an eye on it

GOATUSDT 1DGOAT ~ 1D
#GOAT This is the main support block that has been keeping the price from dropping any lower. buy gradually from here, target 20%++

#GOAT/USDT 174% pump Signal Triggered!!GOAT has broken out of its falling wedge pattern and is poised to reach $2.
Here’s the technical overview:
1. The 21 EMA has crossed above the 50 EMA. The last time this occurred, GOAT gained 44% in a single day and 174% in 12 days.
2. The Hull Suite indicator has turned green, signalling bullish momentum.
3. RSI has broken out, indicating strong buying pressure.
4. Structural breakout after 18 days of accumulation, confirmed by bullish reversal candles.
With BTC dominance dropping sharply, altcoins are primed for stronger moves, and GOAT looks to be one of the leaders.
**DYOR | NFA**
If you want more trade setups like this, don’t forget to follow me.
Thank you.
#Peace 🚀

#GOAT/USDT Trade Setup. 60% Potential Rally ahead.MIL:GOAT : The price has broken out of the descending channel and is now showing strong bullish momentum!
Both the 50 EMA (Red) and 21 EMA (Blue) are signalling upward movement, with the price juggling between both indicators.
The RSI is currently at 61.72, suggesting there’s still potential for further bullish momentum.
Keep an eye on this breakout, it could lead to significant price action.
As always, remember to do your own research.
This is not financial advice.
Hit the like button if you like it and share your views in the comments section.
Thank you
#PEACE

#GOAT/USDT Trade Setup. SPOT and FURTURES!#GOAT has broken out and is currently in a retest phase.
As this is a meme coin, doing your own research is crucial (DYOR).
These coins are highly volatile, so using low leverage is advisable when trading them.
Entry Levels:
- 0.6628
- 0.6433
- 0.6100
-0.5889
Stop Loss (SL): 0.5505
Targets:
- 🎯 0.689
- 🎯 0.723
- 🎯 0.745
- 🎯 0.778
- 🎯 0.812
- 🎯 0.869
⚠️ DYOR (Do Your Own Research), NFA.
Do hit the like button id you want me to post more.
Thank you
#PEACE

GOATUSDT Long IdeaRisk warning, disclaimer: the above is a personal market judgment based on published information and historical chart data on Tradingview, all analysis is only subjective. Hope investors consider am not responsible for your investment decision. Thank you. Good luck!

GOATUSDT Long IdeaRisk warning, disclaimer: the above is a personal market judgment based on published information and historical chart data on Tradingview, all analysis is only subjective. Hope investors consider am not responsible for your investment decision. Thank you. Good luck!

GOAT is a rocketOn the chart we have a continuation pattern for GOT which is an important fractal
When in the middle of a bullish wave, this fractal, which looks like a fake head and shoulders, is created, another wave, after this continuation pattern, appears, which is related to the Fibonacci of the previous wave.
By fixing the candles on the green box, it can remain bullish and move towards the targets.
Closing a daily candle below the invalidation level will violate the analysis
For risk management, please don't forget stop loss and capital management
Comment if you have any questions
Thank You
