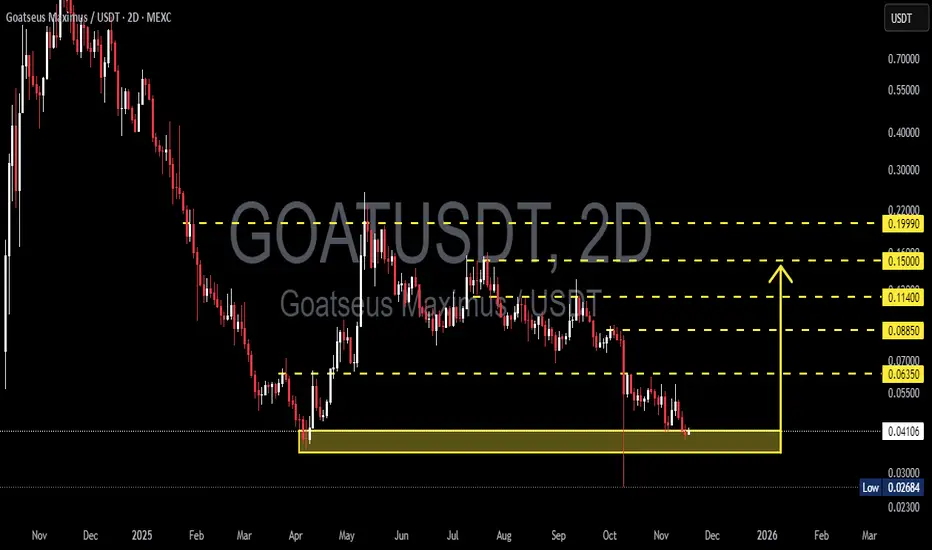
GOAT/USDT — Critical Decision Zone: Major Reversal or Breakdown?GOAT is now sitting at the most critical level since its earlier distribution phase: the price has returned to retest the Primary Structural Base at 0.041–0.035, a zone that previously triggered a major bullish expansion.
This area is not just support — it is the battleground that decides the next macro direction.
The entire downtrend from the peak has formed a consistent descending wave structure, yet each drop into the 0.041–0.035 block has been met with aggressive buy absorption. This indicates that a large liquidity cluster sits within this zone and may act as the pivot for a significant reversal.
---
Pattern & Market Structure Overview
Price action is currently forming a low-compression pattern into the key support.
This typically ends with either:
a strong impulsive reversal, or
a high-momentum breakdown into deeper liquidity zones.
The latest 2D candle closed right above the upper boundary (0.041), showing buyers are still defending — but the momentum remains fragile.
Overhead resistance levels (0.0635 → 0.0885 → 0.114 → 0.150 → 0.1999) form a clean ladder of recovery targets if a bounce is confirmed.
---
Bullish Scenario — “Major Accumulation Rebound”
This scenario activates if:
1. Price holds and rebounds strongly from 0.041–0.035.
2. A clean 2D close above 0.0635 appears — this zone is the Bullish Trigger.
Once confirmed, the market shifts from a downtrend into a recovery structure, with step targets:
0.0635 → Reversal validation
0.0885 → Momentum expansion
0.114–0.150 → Mid-range trend shift
0.1999 → Major structural retest
From the support zone to the upper targets, the upside potential can reach +300%, but only with full bullish confirmation.
---
Bearish Scenario — “Liquidity Flush Breakdown”
A strong breakdown below 0.035 signals buyer exhaustion.
If that occurs:
Price will likely drop quickly into 0.02684 (previous liquidity wick).
If 0.02684 fails, the chart may enter a capitulation phase, opening the path toward the low 0.02 region.
This would confirm the continuation of the primary downtrend.
---
Core Conclusion
GOAT is positioned inside a macro decision zone.
The 0.041–0.035 range determines whether we see:
the end of the prolonged bearish cycle and the beginning of a major reversal, or
the start of a deeper capitulation leg, as the market hunts lower liquidity.
This makes the zone both the highest-reward entry area and the highest-risk failure point.
#GOATUSDT #GOAT #CryptoAnalysis #PriceAction #SupportZone #Breakout #BullishScenario #BearishScenario #CryptoTA #TechnicalAnalysis
Goatusdtperp
GOATUSDT: 1000%+ Potential!GOAT has seen extreme volatility over the past year. After a massive 97% drop from the peak, the price staged a strong recovery of over 570% from the bottom. Now, the chart is showing a bullish continuation wedge formation, suggesting momentum may be shifting again.
Key Highlights
Structure: Price consolidating inside a bullish wedge pattern.
Volume Profile: Recent move broke through a key resistance zone, showing buyers stepping in.
Moving Averages: Price reclaiming EMAs will act as dynamic support.
Upside Potential: Technical projection points to a strong continuation move if the wedge breakout confirms.
📈 Trading Plan
Entry Zone: Above $0.11.
Target (TP): 300%- 1000%
Stop-Loss (SL): Below $0.074 support
Cheers
Hexa
