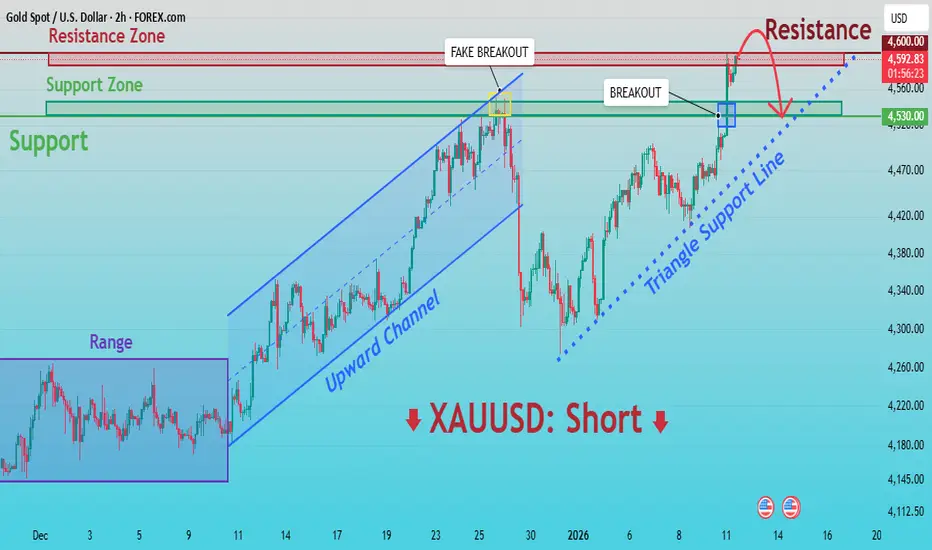
XAUUSD: Critical Supply Zone - Reaction May Define Next MoveHello everyone, here is my breakdown of the current XAUUSD setup.
Market Analysis
Gold is trading within a broader bullish environment, but recent price action shows signs of exhaustion near key resistance. After a period of consolidation inside a clear range, XAUUSD broke to the upside and forme
About Gold Spot / U.S. Dollar
Gold price is widely followed in financial markets around the world. Gold was the basis of economic capitalism for hundreds of years until the repeal of the Gold standard, which led to the expansion of a flat currency system in which paper money doesn't have an implied backing with any physical form of monetization. AU is the code for Gold on the Periodic table of elements, and the price above is Gold quoted in US Dollars, which is the common yardstick for measuring the value of Gold across the world.
Gold Strengthens as Geopolitical Risk IncreasesGold Strengthens as Geopolitical Risk Increases
Gold continues to respect a bullish market structure, with price developing a clear impulsive sequence followed by shallow corrective waves. The recent pullback found support near the 4,400 zone (wave iv), and price is now pushing higher again, confi

Gold (XAUUSD) – H&S Target Reached, Watching the BounceHi!
Gold did exactly what it was supposed to do.
The head & shoulders played out clean, price dropped into the 4400 area, hit the target, and buyers reacted right away.
This zone lines up with:
Previous structure
Rising trendline support
So the bounce here makes sense.
🎯 If 4400 holds:
→ M

Gold Weekly Levels: Break above 4555 → 4625/4635🔱 GOLD WEEKLY SNAPSHOT — EXECUTIVE SUMMARY
✨ Bulls remain in control as price transitions into the Wave-5 extension sequence
🟡 Key unlock level: 4555 — a clean break/acceptance above opens continuation fuel
🚀 Wave-5 extension target: 4625–4635 (primary upside objective / price discovery ceiling)

GOLD - Consolidation ahead of news. Long squeeze?FX:XAUUSD is trading in the $4575-4600 range (consolidation) ahead of US inflation data (CPI) for December...
Inflation remains above the Fed's target (2%), making the data key to assessing the timing of rate cuts. XAU is consolidating below record highs. Profit-taking is observed ahead of the

Nfp news setup Gold is holding above major support and respecting an ascending trendline. A bullish continuation is expected, with a breakout targeting 4590. NFP news may act as the catalyst for upward momentum.

Gold Defends Buyer Zone, Upside Toward 4,550 in FocusHello traders! Here’s my technical outlook on XAUUSD (3H) based on the current chart structure. Gold previously traded inside a well-defined range, where price moved sideways for an extended period, showing balance between buyers and sellers. This consolidation acted as an accumulation phase and mar

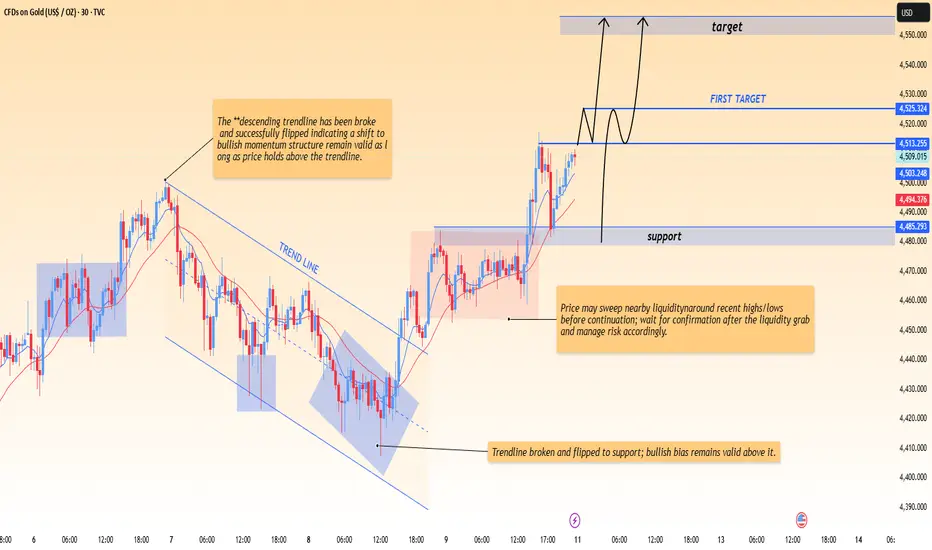
XAUUSD 30M – Trendline Break & Bullish ContinuationPrice has broken above the descending trendline and key resistance, confirming a bullish structure shift.
The former resistance zone around 4,485–4,500 is now acting as strong support.
Holding above support favors continuation toward the first target at 4,524 and the main target near 4,550–4,560,
XAU/USD Bullish Breakout | Trendline & Demand Support
Price is holding above the rising trendline and strong buying area after a clean breakout. Structure remains bullish, with higher highs and higher lows, showing strong buyer control and upside momentum

Gold Uptrend Strengthens, New Expansion Phase BeginsOver the past week, gold has continued to advance in a very “textbook” manner. What stands out is not how far price has moved, but how it has moved: steady, controlled, and consistently supported by both technical structure and the macro backdrop. On the H4 chart, this is the type of bullish behav

See all ideas
Summarizing what the indicators are suggesting.
Oscillators
Neutral
SellBuy
Strong sellStrong buy
Strong sellSellNeutralBuyStrong buy
Oscillators
Neutral
SellBuy
Strong sellStrong buy
Strong sellSellNeutralBuyStrong buy
Summary
Neutral
SellBuy
Strong sellStrong buy
Strong sellSellNeutralBuyStrong buy
Summary
Neutral
SellBuy
Strong sellStrong buy
Strong sellSellNeutralBuyStrong buy
Summary
Neutral
SellBuy
Strong sellStrong buy
Strong sellSellNeutralBuyStrong buy
Moving Averages
Neutral
SellBuy
Strong sellStrong buy
Strong sellSellNeutralBuyStrong buy
Moving Averages
Neutral
SellBuy
Strong sellStrong buy
Strong sellSellNeutralBuyStrong buy
Displays a symbol's price movements over previous years to identify recurring trends.