GOLD 1H Chart Technical AnalysisDear Traders,
Please also consider the important news events on the economic calendar, as they may significantly impact market volatility and price movement.
We are currently observing price consolidating between two key weighted levels, with an upside gap at 4156 and a downside gap at 4040. To identify the next directional range, we need to focus on these 2 scenario marked.
Price may continue to move sideways and retest these zones until one of the weighted levels decisively breaks and locks, which will confirm the direction for the next market leg. Refer to the arrows marked on the 1H timeframe, which highlight the two potential scenarios and assist with accurate entry timing.
Scenario 1 – Bullish Continuation
If price breaks the resistance and locks above 4155, we anticipate a continuation toward higher targets 4193 & 4233, supported by the bullish structure.
Scenario 2 – Support Test & Bounce
If price fails to lock above resistance, we expect a retracement toward the lower support zones at 4100 & 4060 for a potential support test and bounce.
We will keep both scenarios in mind as we continue taking buy entries from dips. Our updated weighted levels and structural zones will help us track any downward movement and position ourselves to capture upward bounces effectively.
As always, we will continue executing our dip-buying strategy, targeting 20–40 pips per entry. Each structural level consistently provides a 30–50 pip bounce, offering clean, high-probability entry and exit opportunities.
The Quantum Trading Mastery
Goldcharts

4 Hour TF - Strong Buying Gold Level - Droid TradingGold Take Support Strongly near BOS , Where FVG or OB Present, Check Chart
Entry (3317-3325)
SL - 3307
Target (3365-3370)
BOOK Profit as your Understanding or Daily Target
Entry with Proper SL, as your Risk, Don't use Complete Fund.

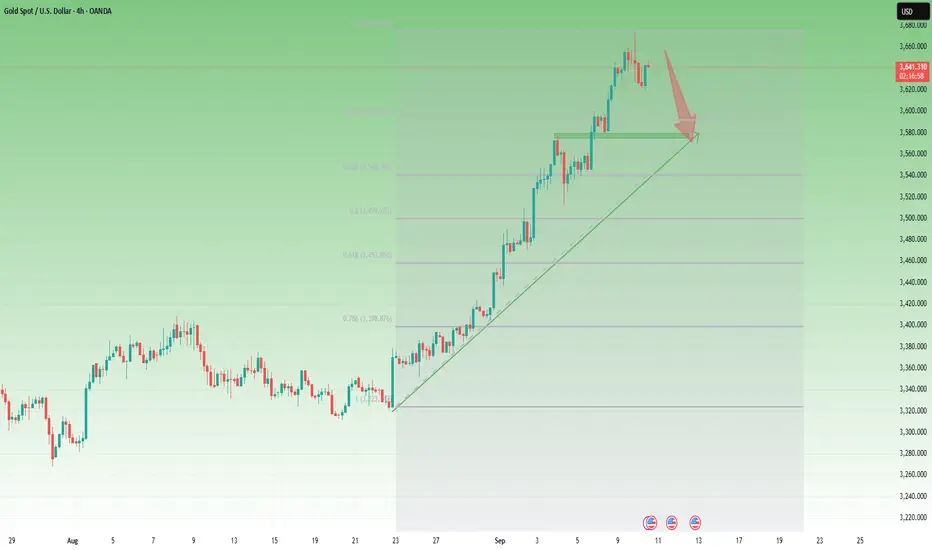
Gold Analysis – Correction Not Yet Over (IMO)Yesterday, after printing a new ATH at 3674, Gold sold off aggressively and overnight reached a low of 3620.
Now the key question: Is Gold done correcting?
👉 My answer: Not yet.
Here’s why:
1. The 550 pip drop from the top is barely scratching the surface compared to the 3500 pip rally in the last two weeks.
2. Yesterday’s daily candle is a bearish pin bar. While this pattern is weaker in strong uptrends, it can still trigger continuation.
3. Structurally, the market looks like it’s forming an ABC correction. The current rebound may be wave B, with wave C expected to target the 3570 zone.
4. Confluence supports act like magnets once corrections begin. The zone I’m watching aligns with the 23% Fibonacci retracement, which fits perfectly with the correction scenario.
📌 Trading Plan:
As long as 3675 holds, I remain bearish in the short term. The best strategy is to sell rallies against the ATH, targeting deeper retracement levels.
H4 GOLD BUY Gold Give A Bullish Fvg After Big Falling So We Are Expecting A Bullish Setup Also Its Filled The Below IFVG And Break The Buy Trendline So Now We Will Buy Now Targeting Previous High Lets Goo For It
FOLLOW US FOR MORE TRADES
TRADE IN DEPTH MARKET

15M bounce recently Gold Silver. Bears moving in. Trend down
I said on Friday I thought a deeper correction in Gold may happen, because, Gold and Silver price both sold-off moderately on Friday but their price closed at the bottom of a tight zone and their price made absolutely zero attempt to return to higher prices. Smart money was not buying and the same theme is happening today.
Crypto, USD$ have been rallying lately together, but Gold is being cutdown, watch out for a huge move down similar to the couple of corrections of around 15% earlier in 2024.
Please take a look at the Daily and Weekly chart.

Xauusd Gold On DemandXauusd now can pump create entry get profit
Target As Your Wish Minimum Targets Can Achieve

Gold Facing Stiff Resistance Near 1879As Predicted in earlier posts about Gold. It is facing a stiff resistance near USD 1879. March towards USD 1900+ will be / is on halt temporarily due to easing of war clouds between Russia and Ukraine. Solid support for Gold on the down side is at USD 1853 and USD 1834. Below USD 1834 Gold can roll down to USD 1816 and USD 1803 levels which are 50 and 200 days EMA respectively. On the upper side if we get a closing above the levels of USD 1880 Gold can travel quickly to USD 1907.87 levels
