XAU/USD 04 December 2025 Intraday AnalysisH4 Analysis:
-> Swing: Bullish.
-> Internal: Bullish.
Analysis and bias remains the same as analysis dated 20 October 2025.
Price has printed as per previous intraday expectation by printing a bearish CHoCH which indicates, but not confirms, bullish pullback phase initiation.
Price is currently trading within an established internal range, however, I will continue to monitor price with regards to depth of pullback.
Intraday expectation:
Price to continue bearish, react at either discount of 50% internal EQ, or H4 supply zone before targeting weak internal high priced at 4,380.990.
Note:
The Federal Reserve’s sustained dovish stance, coupled with ongoing geopolitical uncertainties, is likely to prolong heightened volatility in the gold market. Given this elevated risk environment, traders should exercise caution and recalibrate risk management strategies to navigate potential price fluctuations effectively.
Additionally, gold pricing remains sensitive to broader macroeconomic developments, including policy decisions under President Trump. Shifts in geopolitical strategy and economic directives could further amplify uncertainty, contributing to market repricing dynamics.
H4 Chart:
M15 Analysis:
-> Swing: Bullish.
-> Internal: Bullish.
Analysis and bias remains the same as yesterday's analysis dated 02 December 2025.
Price has printed as per analysis dated 14 November 2025 where I mentioned price to trade down to either discount of 50% internal EQ, or M15 demand zone before targeting weak internal high, priced at 4,245.195.
Price subsequently printed a bearish CHoCH, however, as mentioned yesterday, I would closely monitor price with respect to depth of pullback.
Price did not pull back with any significance, therefore, I will apply discretion and not classify an iBOS. I have marked this with red dotted and dashed lines.
Price has since printed another bearish CHoCH.
We are currently trading within an established internal range, however, as per yesterday, I will continue to monitor price with respect to depth of pullback.
Intraday expectation:
Price to trade down to either discount of 50% internal EQ, or M15 demand zone before targeting weak internal high, priced at 4,264.700.
Note:
Gold remains highly volatile amid the Federal Reserve's continued dovish stance, persistent and escalating geopolitical uncertainties. Traders should implement robust risk management strategies and remain vigilant, as price swings may become more pronounced in this elevated volatility environment.
Additionally, President Trump’s tariff announcements, particularly against China, are expected to further amplify market turbulence, potentially triggering sharp price fluctuations and whipsaws.
M15 Chart:
Golddaily

Gold Awaits PPI & GDP – Buy Dips, Sell Rallies🟡 XAU/USD – PPI & GDP Data to Define Range Expansion
🔍 Market Context
Gold remains range-bound between $4000–$4100, consolidating after last week’s liquidity sweep.
This week’s key U.S. data — Core PPI, Retail Sales, GDP, and Core PCE — will likely dictate the next major move.
Slight improvement in inflation and consumption data could strengthen the USD temporarily, but overall bias remains bullish mid-term as the Fed is expected to maintain a dovish stance into Q1.
📊 Technical Outlook (4H Chart)
Main Sell Zone (Super OB): 4170–4200 → potential reversal supply zone.
Fair Value Gap (FVG): 4130–4160 → short-term reaction zone if price retraces.
Sell Zone: 4090–4095 → short opportunity aligned with intraday bearish structure.
Buy Zone 1: 4024–4025 → minor demand, expecting internal liquidity sweep.
Buy Zone 2 (Main OB): 4003–4001 → strong order block with multiple rejections; key liquidity pool.
Structure: H4 BOS (Bullish) intact, suggesting a liquidity sweep before next expansion upward.
🎯 Trade Plan
1️⃣ SELL Setup – Short-term reaction from FVG
Entry: 4090–4095
Stop Loss: 4100
Take Profit 1: 4055
Take Profit 2: 4040
Take Profit 3: 4025
➡️ Reasoning: Price is likely to tap the lower edge of FVG and sweep local liquidity before a downside reaction toward internal range demand.
2️⃣ BUY Setup – First demand zone test
Entry: 4024–4025
Stop Loss: 4022
Take Profit 1: 4065
Take Profit 2: 4080
➡️ Reasoning: Expecting a short-term liquidity grab below the mid-range before bullish continuation.
3️⃣ BUY Setup – Main OB accumulation zone
Entry: 4003–4001
Stop Loss: 3998
Take Profit 1: 4045
Take Profit 2: 4075
Take Profit 3: 4090
➡️ Reasoning: Deep liquidity zone aligning with higher-timeframe OB. If macro data disappoints, this area can trigger the next impulsive leg to retest 4170+.
🧭 Overall Bias
→ Ranging bias before Core PCE
→ Buy dips – Sell rallies within 4000–4100 until a clear breakout post-GDP/PCE data.
→ Watch for false breakouts around FVG and maintain risk control before U.S. session releases.

XAUUSD – Reading the Market’s Secret Intentions🌐 MARKET CONTEXT
Gold begins the new week with compressed volatility yet maintains a bearish overall structure on H1. Price continues forming Lower Highs → Lower Lows, suggesting Smart Money is still distributing at premium zones while accumulating at deep discount pools.
Current Market Drivers
USD strength remains stable → keeping gold under pressure
Market awaits midweek USD data → early sessions may be liquidity-driven
Institutional flows show no strong bullish commitment yet
Bias for the day:
🔻 Bearish until price reclaims key premium zones with a valid CHoCH.
🔺 BUY setups valid only at deep discount liquidity pools (3996, 4030).
📉 TECHNICAL ANALYSIS (Liquidity + SMC Structure)
Market Structure
H1 Trend: Bearish
Key premium zone above: 4146–4148
Mid-range equilibrium: 4060–4080
Discount demand clusters: 4030 & 3994
Liquidity Observation
Buy-Side Liquidity (BSL):
Above 4146
Above 4071 liquidity wick
Sell-Side Liquidity (SSL):
Below 4030
Below 3994 (major liquidity pocket)
Imbalances / FVG
Strong bearish FVG at 4146–4148
Minor imbalance at 4068–4071
Clear discount imbalance at 4032–4030
Deep liquidity vacuum near 3996–3994
🔑 KEY PRICE ZONES (Clear, Compelling Explanations)
1️⃣ 4148–4146 → Premium Liquidity Trap – Main SELL Zone
This zone contains:
Unmitigated H1 Supply Zone
Heavy BSL resting above recent swing highs
Major bearish FVG fill
➡️ A classic liquidity-engineered premium trap where Smart Money sweeps breakout buyers before reversing aggressively.
2️⃣ 4068–4071 → Mid-Range Liquidity Sweep – SCALP SELL Zone
Features:
Clusters of intraday stops from earlier longs
A small FVG acting as inducement
Positioned near equilibrium → perfect for fakeouts
➡️ Expect quick wicks and sharp rejections, ideal for short, high-precision scalps.
3️⃣ 4032–4030 → Discount Reaction – SCALP BUY Zone
This area offers:
Clean SSL located just beneath
Micro Demand Zone
A common reversal point during bearish cycles
➡️ Excellent for fast BUY scalps with tight risk, especially during London manipulation.
4️⃣ 3996–3994 → Deep Discount Reversal – GOLD BUY Zone
A high-value accumulation zone:
Contains significant higher-timeframe SSL
Aligns with deep-discount structure
Frequently used by Smart Money to reload long positions
➡️ If price taps this zone, a strong bullish rebound is very likely.
⚙️ TRADE SETUPS (High Precision Entries)
✔️ SELL GOLD – Main Premium Short
Entry: 4148–4146
Stoploss: 4154
TP1: 4120
TP2: 4080
TP3: 4030
Logic: BSL sweep → FVG mitigation → bearish displacement.
✔️ SELL SCALP – Mid-Range Sweep
Entry: 4068–4071
Stoploss: 4077
TP1: 4050
TP2: 4038
Logic: Engineered liquidity → immediate rejection expected.
✔️ BUY SCALP – Discount Liquidity Reaction
Entry: 4032–4030
Stoploss: 4024
TP1: 4045
TP2: 4068
Logic: SSL sweep → CHoCH likelihood → intraday rebound.
✔️ BUY GOLD – Deep Discount Long
Entry: 3996–3994
Stoploss: 3988
TP1: 4020
TP2: 4060
TP3: 4140
Logic: Strong institutional accumulation zone → potential formation of H1 higher low.
🧠 SESSION NOTES
Avoid trading mid-range to reduce chop exposure.
Best moves form after liquidity sweeps in London or during NY displacement.
Confirm entries with M5/M15 CHoCH + displacement.
Never buy inside premium zones; never sell inside deep discount zones.
🏁 CONCLUSION
Gold maintains a bearish structure, favoring SELL setups at premium liquidity traps 4146–4148 and 4068–4071.
BUY setups remain valid only at strong discount zones 4030 and 3994, where liquidity supports a clean bullish reaction.
Let liquidity form the trap. Then strike with precision.

Gold Nonfarm: Buy OB 4030, Target Break 4111🔍 Market Context – November 20, 2025
Gold initially dropped nearly 70 pips at the start of the day but quickly rebounded sharply from the 4030–4032 zone, demonstrating strong buying pressure and a refusal to decline further.
The market structure on the H1–H2 timeframe is forming a classic, well-defined Inverse Head & Shoulders pattern—a quintessential bullish reversal pattern—signaling a potential upward expansion if the neckline is successfully broken.
📅 Key News Events Today:
🇺🇸 Non-Farm Payrolls (NFP)
📉 US Unemployment Rate
🏛 FOMC Meeting Minutes
🗣 Speeches by Trump, Barkin, Williams
🧾 Initial Jobless Claims
⚠️ These events could trigger sharp volatility and will determine the confirmation or rejection of the reversal pattern.
📊 Technical Analysis
🛒 BUY SETUP – Primary Priority
✅ Entry: 4030 – 4032
🛡 Stop Loss (SL): 4027
🎯 Take Profit (TP):
TP1: 4039
TP2: 4047
TP3: 4059
💡 Rationale: Price bounced strongly at the OB + SSS zone. This is a crucial technical support area and the base of the Inverse H&S pattern. The objective is to break the neckline to trigger the uptrend.
🔻 SELL SETUP – Short-Term Strategy
📍 Entry: 4093 – 4095
🛡 SL: 4098
🎯 TP:
TP1: 4088
TP2: 4077
TP3: 4060
TP4: 4033
💡 Rationale: This strategy is only applicable if the price forms a false breakout of the BSL zone and reverses. This is an ideal entry point for quick scalping if the market reacts negatively to the news.
🔑 Key Price Zones
Buy Zone (OB + SSS): 4030 – 4032
→ Strong demand zone, the base of the Inverse Head & Shoulders pattern, confirming the reversal signal if held.
Breakout Neckline Zone: 4101 – 4111
→ The neckline of the Inverse H&S pattern. Breaking this zone will open up opportunities for a sharp rise.
Final Resistance Zone: 4133 – 4140
→ The final target if the breakout is successful and the bullish pattern is confirmed.
✅ Strategy Conclusion
🎯 Main Strategy: Priority is to BUY in the OB zone 4030–4032.
🩸 SELL is only for short-term scalping if there is a signal of rejection at the BSL zone.
🕓 Caution: Be careful entering trades near the Nonfarm news release time—wait for price action to confirm the direction.

XAUUSD 4H – Liquidity Map & Smart Money Outlook🌐 MARKET CONTEXT
Gold continues to trade within a bearish intraday structure, forming consistent Lower Highs → Lower Lows on the M30 timeframe. Price has been reacting strongly at Premium areas where Buy-Side Liquidity (BSL) accumulates, while showing clean rebounds at deeper Discount levels where Sell-Side Liquidity (SSL) resides.
Current Market Sentiment
USD remains steady → maintaining downward pressure on gold
Smart Money prioritizes selling at Premium and accumulating at Discount
Midweek environment → prone to liquidity sweeps before true expansion
Bias for the day:
🔻 Bearish bias, favor SELL setups at Premium zones
🔺 BUY only at deep Discount with CHoCH confirmation
📉 TECHNICAL ANALYSIS (SMC + LIQUIDITY STRUCTURE)
Market Structure
M30 trend: Bearish
Mid-range equilibrium: 4110–4175
Premium liquidity zone: 4378–4380
Deep discount zone: 3882–3884
Imbalances & Liquidity
Major bearish FVG: 4378–4380
Mid-level liquidity pocket: 4238–4240
Strong SSL levels: 3996 and 3882
🔑 KEY PRICE ZONES (Clear & Compelling Explanations)
1️⃣ 4380–4378 → Premium Liquidity Trap – MAIN SELL ZONE
This zone contains:
Buy-Side Liquidity from previous breakout attempts
An unmitigated M30 Supply Zone
A major FVG expecting full mitigation
➡️ Smart Money often drives price into this premium pocket to hunt liquidity before reversing sharply.
2️⃣ 4240–4238 → Mid-Range Liquidity Sweep – SCALP SELL ZONE
A highly reactive intraday level:
Holds clustered stoplosses from intraday traders
Sits near equilibrium → ideal area for engineered fakeouts
Often creates sharp wicks before reversing
➡️ Perfect for quick SELL scalps with minimal drawdown.
3️⃣ 3998–3996 → First Discount Reaction – SCALP BUY ZONE
This zone includes:
A clean SSL cluster just below
A sensitive micro Demand Zone
A common CHoCH reaction area on M30
➡️ Great for fast BUY scalps with tight risk.
4️⃣ 3884–3882 → Deep Discount Reversal Base – MAJOR BUY ZONE
This zone is extremely important:
Sits at the structural low on M30
Contains heavy Sell-Side Liquidity
Aligns with a higher-timeframe Order Block
➡️ If price taps here → strong reversal potential, possibly forming the weekly low.
⚙️ TRADE SETUPS (Detailed Execution Plan)
✔️ SELL GOLD – Main Position
Entry: 4380–4378
Stoploss: 4386
TP1: 4355
TP2: 4300
TP3: 4240
Logic: BSL sweep → FVG fill → strong bearish rejection expected.
✔️ SELL SCALP – Intraday Liquidity Sweep
Entry: 4240–4238
Stoploss: 4246
TP1: 4215
TP2: 4190
TP3: 4155
Logic: Sweep of mid-range liquidity → immediate downward displacement.
✔️ BUY SCALP – Discount Reaction
Entry: 3998–3996
Stoploss: 3990
TP1: 4015
TP2: 4045
Logic: SSL sweep → quick intraday rebound.
✔️ BUY GOLD – Deep Discount Reversal
Entry: 3884–3882
Stoploss: 3876
TP1: 3910
TP2: 3950
TP3: 3995
Logic: Major discount zone → high-probability reversal area.
🧠 SESSION NOTES
Avoid trading in the middle of the range
Wait for M5/M15 confirmation (CHoCH + displacement)
Do not buy at Premium zones
Do not sell at deep Discount zones
Let liquidity sweep first → then enter
🏁 CONCLUSION
Gold maintains a bearish intraday structure, favoring SELL setups at 4378–4380 and 4238–4240.
BUY opportunities appear only at strong Discount zones 3996 and 3882, where liquidity pools support bullish reactions.
Trade like Smart Money: wait for liquidity → strike with precision.

XAUUSD – Where Smart Money Strikes Today🌐 MARKET CONTEXT
Gold begins today’s session after a phase of controlled volatility, where price continued to sweep both sides of the range but failed to commit to a direction. The broader intraday structure remains bearish, with price rejecting premium levels and forming consistent lower highs.
Recent Drivers:
USD shows moderate resilience following firm Fed communication
Market sentiment cautious ahead of late-week economic announcements
No significant safe-haven inflow → neutral risk environment
Session Expectations:
London Session: Likely to trigger early liquidity sweeps above premium wicks
NY Session: Expected to deliver the main directional push
Bias: Bearish unless price reaches deep discount zones and prints a CHoCH
Price is currently trading within the middle of the intraday range → best setups remain at extremes (premium sells / discount buys).
📉 TECHNICAL ANALYSIS (SMC + LIQUIDITY STRUCTURE)
Market Structure
M30 structure remains bearish (Lower Highs → Lower Lows)
Current equilibrium zone: 4060–4080
Inducement stacking above 4147 and 4081
Liquidity Map
Buy-Side Liquidity (BSL): Above 4147 and 4081
Sell-Side Liquidity (SSL): Below 4033 and deeper cluster at 3993
These layers show engineered liquidity designed to trap impatient traders.
Imbalances (FVG Zones)
Bearish FVG: 4147–4148 → strong premium rejection zone
Minor FVG: 4079–4081 → ideal scalp sweep zone
Discount FVGs: 4033 and 3993 → high-quality buy reactions
🔑 KEY PRICE ZONES (Clear & Engaging Explanations)
4148–4147 ▶️ Premium Liquidity Trap – High-Probability Sell
This zone holds a clean bearish OB + untouched BSL above 4147.
Institutional traders typically use this area to trigger breakout buyers before reversing the move sharply downward.
4079–4081 ▶️ Mid-Premium Inducement – Scalp Rejection Zone
A compact liquidity pool sitting just above equilibrium.
Market often sweeps here during London session to induce buys before dropping.
4035–4033 ▶️ Discount Reaction Zone – Reliable Scalping Demand
Micro OB + SSL alignment makes this zone ideal for sharp intraday rebounds.
Expect fast reactions with minimal drawdown.
3995–3993 ▶️ Deep Discount Pool – Strong Reversal Zone
This region contains layered SSL + higher-timeframe discount confluence.
If price taps this zone, a significant intraday reversal becomes highly probable.
⚙️ TRADE SETUPS (SMC-Based, High Precision)
✔️ SELL SETUP 1 – Premium Rejection
Entry: 4148–4147
Stop-loss: 4126
TP1: 4135
TP2: 4105
TP3: 4080
Logic: BSL sweep + FVG mitigation → strong bearish displacement expected.
✔️ SELL SCALP – Mid-Range Liquidity Sweep
Entry: 4079–4081
Stop-loss: 4087
TP1: 4065
TP2: 4048
TP3: 4033
Logic: Sweep of inducement above mini-BSL before continuation down.
✔️ BUY SCALP – Intraday Discount Rebound
Entry: 4035–4033
Stop-loss: 4027
TP1: 4048
TP2: 4070
Logic: SSL sweep triggers a micro CHoCH → quick bullish bounce.
✔️ BUY SETUP 2 – Deep Discount Reversal
Entry: 3995–3993
Stop-loss: 3987
TP1: 4010
TP2: 4040
TP3: 4070
Logic: Key institutionally favoured zone → strong liquidity-driven reversal.
🧠 NOTES / SESSION PLAN
Only trade at extremes — avoid mid-range to prevent chop
Expect engineered fake-outs at London open
NY session likely delivers true directional movement
Wait for M5/M15 confirmation: CHoCH + BOS before executing
Avoid buying near premium zones to avoid falling into liquidity traps
🏁 CONCLUSION
Gold maintains a bearish M30 structure, favouring sell setups at 4147 and 4081.
Discount zones at 4033 and 3993 offer high-probability buy opportunities for intraday rebounds or full reversals.
Stay disciplined.
Let liquidity be your guide.
Strike only when the trap is set.

XAUUSD – Battle Zones of the Day🌐 MARKET CONTEXT
Gold enters today’s session after a day of compressed volatility, where price repeatedly tapped into both buy-side and sell-side liquidity but failed to develop a clean trend. The intraday structure remains bearish, with price rejecting premium zones and forming lower highs on M30.
Recent Catalysts:
USD maintains mild strength following hawkish Fed tone
Market awaits midweek economic releases → low conviction sentiment
Risk sentiment remains neutral; no strong safe-haven flows
Session Expectations:
London Session: Early liquidity sweeps expected toward premium zones
NY Session: Higher probability of real directional expansion
Bias: Bearish intraday until discount zones induce a CHoCH
Price currently trades mid-range, making extreme liquidity zones the safest execution points.
📉 TECHNICAL ANALYSIS (SMC + LIQUIDITY STRUCTURE)
Market Structure
M30 structure: Lower Highs → Lower Lows
Equilibrium area: 4075–4085
Inducement layers stacking above 4147 and 4070
Liquidity
BSL: Above 4147 + 4070
SSL: Below 4033 and deep pocket at 3993
Market forming engineered liquidity wicks in both directions
Imbalance Zones
Bearish FVG at 4147–4148 (perfect scalp sell)
Minor imbalance at 4070–4071
Discount imbalances at 4033 and 3993 support buy setups
🔑 KEY PRICE ZONES (Clear, Attractive Explanations)
4148–4147 ▶️ Premium Liquidity Trap – Ideal Scalp Sell
A premium zone holding an unmitigated bearish OB + BSL inducement.
Smart money uses this area to trigger breakout buyers, then slam price back down.
4071–4070 ▶️ Secondary Premium Liquidity – Fast Rejection Zone
A mini liquidity pool just above equilibrium.
Engineered to sweep early-session highs before reversing sharply.
4035–4033 ▶️ Discount Reaction Zone – Scalping Demand
Micro OB + SSL cluster resting underneath → excellent for intraday rebounds.
Expect clean, mechanical reactions here with low drawdown.
3995–3993 ▶️ Deep Discount Liquidity Pool – High-Value Reversal Zone
Major SSL accumulation + HTF discount zone alignment.
A powerful reversal area if reached — institutions hunt this level for discounted entries.
⚙️ TRADE SETUPS (SMC-Driven, High Precision)
✔️ SELL SETUP 1 – PREMIUM SCALP
Entry: 4148–4147
Stoploss: 4126
TP1: 4135
TP2: 4120
TP3: 4085
Logic: BSL sweep + FVG fill → fast bearish rejection expected.
✔️ SELL SETUP 2 – MID-RANGE LIQUIDITY SWEEP
Entry: 4071–4070
Stoploss: 4077
TP1: 4058
TP2: 4043
TP3: 4033
Logic: Sweep of mini-BSL followed by displacement downwards.
✔️ BUY SETUP 1 – INTRADAY REBOUND
Entry: 4035–4033
Stoploss: 4027
TP1: 4048
TP2: 4070
Logic: SSL sweep → micro CHoCH potential → ideal for quick bounce.
✔️ BUY SETUP 2 – DEEP DISCOUNT REVERSAL
Entry: 3995–3993
Stoploss: 3987
TP1: 4010
TP2: 4040
TP3: 4070
Logic: Strong HTF discount reaction zone → high-probability reversal if tapped.
🧠 NOTES / SESSION PLAN
Avoid mid-range trading — only execute at extreme liquidity zones
Expect fake-outs during London opening
NY session likely delivers the main trend move
Always wait for M5/M15 confirmation (CHoCH + BOS)
Avoid buying near premium zones to prevent entering into liquidity traps
🏁 CONCLUSION
XAUUSD holds a bearish intraday structure, favoring premium sell setups at 4147 and 4070.
Discount zones at 4033 and 3993 remain high-probability areas for intraday bounces and potential reversals.
Trade only at liquidity extremes. Be patient. Let the traps form — then strike.

XAUUSD – High-Impact Levels to Dominate the Day🌐 MARKET CONTEXT
Gold opens today in a compression phase after a high-volatility session yesterday, where both premium and discount liquidity pools were partially swept. Despite this, the market structure on M30 remains intraday bearish, with price continuously rejecting premium supply while building liquidity below.
Recent Drivers:
USD strengthened modestly following hawkish comments from Fed speakers
Market remains in “wait mode” ahead of upcoming PMI and inflation data
Safe-haven demand is neutral → no strong fundamental bias, giving technicals more influence
Sentiment Outlook:
London session: Liquidity grabs likely on both sides before directional movement
NY session: Expected expansion after liquidity sweep
Bias: Bearish intraday unless discount zones trigger a structure shift
Gold is currently trading in the middle of the intraday range, meaning entries must be placed at premium or deep-discount liquidity zones only.
📉 TECHNICAL ANALYSIS (SMC + LIQUIDITY)
Market Structure
Current structure: Lower High → Lower Low
M30 equilibrium → 4135–4140
Price hovering under potential inducement levels near 4170–4180
Multiple unmitigated OBs match today’s entries
Liquidity Map
Buy-side liquidity (BSL): above 4176
Mini BSL: above 4147
Sell-side liquidity (SSL): below 4116 and deeper at 3993
Clear liquidity pockets for engineered wicks and traps
Imbalance (FVG)
Bearish FVG at 4176–4178 → optimal sell zone
Small discount imbalance at 4116–4118 → scalp buy reaction zone
Deep imbalance around 3993–3995 → strong liquidity magnet for later sessions
🔑 KEY PRICE ZONES (With Captivating Explanations)
4178–4176 ▶️ Premium Supply – High Probability Sell Zone
Large premium imbalance + unmitigated bearish OB + BSL inducement above.
This is where institutions typically offload positions before pushing price lower.
4148–4147 ▶️ Scalp Sell Zone – Minor Liquidity Trap
Previous sweep zone with compressed liquidity.
Expect a quick reaction as price hunts micro-BSL then rejects.
4118–4116 ▶️ Discount Buy Zone – Scalping Reaction Point
Mitigation of bullish micro-OB + SSL liquidity resting below.
Perfect for small intraday bounces or CHoCH attempts.
3995–3993 ▶️ Deep Discount Buy Zone – High-Value Liquidity Pool
Major SSL cluster + higher timeframe discount region.
If price drops this low, expect aggressive reactions and potential intraday reversal.
⚙️ TRADE SETUPS
✅ SELL SETUP 1 – MAIN PREMIUM SUPPLY
Entry: 4178–4176
Stoploss: 4184
TP1: 4160
TP2: 4148
TP3: 4120
Logic: BSL sweep → imbalance fill → sharp rejection expected in London.
⚠️ SELL SETUP 2 – SCALPING PREMIUM REJECTION
Entry: 4148–4147
Stoploss: 4126 (Adjusted for safety as provided)
TP: 4137 – 4128 – 4120
Logic: Liquidity trap + inducement zone → ideal quick scalp.
✅ BUY SETUP 1 – SCALPING DISCOUNT DEMAND
Entry: 4118–4116
Stoploss: 4110
TP1: 4126
TP2: 4140
Logic: SSL sweep + micro CHoCH potential. Perfect scalp in NY open.
✅ BUY SETUP 2 – DEEP DISCOUNT REVERSAL
Entry: 3995–3993
Stoploss: 3987
TP1: 4010
TP2: 4040
TP3: 4110 (If strong reversal forms)
Logic: High probability liquidity reversal zone. Strong reaction expected.
🧠 NOTES / SESSION PLAN
Wait for M5/M15 confirmation before executing buys in discount zones
Avoid buying near premium zones; structure favors sell setups first
Expect stop-hunt wicks during London session
New York session likely provides the real expansion move
Avoid trading immediately after high-impact USD news
🏁 CONCLUSION
Gold remains in a bearish intraday structure on M30, with two premium sell zones (4178 and 4148) offering the best risk–reward setups.
Discount buy zones (4116 and 3993) provide high-quality countertrend reactions and potential reversals.
Trade only at extremes. Avoid mid-range noise.

GOLD DAILY TRADING 11/17: BUY TODAY🦁 THE GOLDEN ARENA – NOV 17, 2025
“Rebound or Trap? Let the Orderflow Decide.”
A visually striking TradingView plan – part narrative, part tactical map. This is not just a bias, it’s a battlefield strategy.
🧭 MARKET CONTEXT SNAPSHOT
Price currently consolidating around 4076 – 4084, after clean breaks of structure (BOS) and a deep retracement.
Significant supply zones confirmed at 4157 – 4180, where POC clusters, FVG imbalances, and volume absorptions align.
Orderflow on M5–M30 shows fading buy pressure and aggressive sells into lower highs.
🎯 CORE STRATEGIES FOR TODAY
🔺 Scenario 1: Breakout Trap SELL (High Conviction)
Target Zone 4178 – 4180 (Main Supply)
Stop Loss (SL) 4185
Take Profit 1 (TP1) 4155 (Low volume node)
Take Profit 2 (TP2) 4100 (Local support)
Take Profit 3 (TP3) 4040 (Structural SSL level)
🔍 Why this setup?
Clear liquidity pool above 4178 being targeted.
Volume tapering off into the move → classic reversal signal.
Footprint shows absorption candles at key supply.
🪙 Scenario 2: FVG Scalping SELL (Secondary)
Entry Zone 4157 – 4158
SL 4163
TP 4100 – 4105
✅ Perfect for short-term scalpers looking to ride the intraday rejection from the imbalance zone.
🟢 Bullish Reversal INVALIDATION (Failsafe Plan)
Trigger Break and hold above 4185
Entry Breakout Buy above 4190
SL 4175
TP 4220
Only flip bullish if aggressive buyers step in + strong delta + profile breakout.
🧱 KEY PRICE ZONES TO MONITOR
Level Description
4185 Stopline – invalidates Sell
4178 – 4180 Main SELL Zone (POC + FVG)
4157 – 4158 Minor FVG Scalping Area
4100 Micro support + Bull trap
4040 SSL – liquidity target
📊 VOLUME & ORDERFLOW INSIGHT
M5–M30 Footprints:
Massive seller imbalances from 4175+
Footprint at 4084 shows buyer exhaustion
Volume Profile:
High-volume node at 4178 acting as strong resistance
Low-volume gap below 4155 → fast price travel zone
Delta:
Negative delta buildup confirming sell bias
💡 EXECUTION CHECKLIST
✅ Wait for entry trigger at marked zones – don’t pre-empt.
🚫 Avoid FOMO buy into supply unless 4185 is cleanly broken.
🔔 Set alerts at 4157 and 4180 for rejection signs.
🧠 TRADING MANTRA OF THE DAY
"The chart speaks in structure,
The volume whispers the truth,
But the orderflow shouts the conviction."
📌 Bias: SELL on retracements toward supply → hold for 4100–4040
📌 Watchlist: Footprint aggression, absorption blocks, spoof traps

GOLD: Big Pullback Loading Before a 4400 Rally?Bias: Bullish – Buy-the-Dip Strategy
Approach: Smart Money Concepts (SMC)
🌐 Market Context
Gold continues to show a strong recovery, maintaining a clear bullish structure across the H1, H4, and Daily timeframes.
Institutional order flow remains firmly on the buy-side as:
Liquidity on H1/H4 highs is being swept consistently
Pullbacks are respecting Demand Order Blocks (OBs)
Multiple Breaks of Structure (BOS) confirm bullish continuation
However, the region 4280 – 4330 (FVG + major trap zone) has historically triggered strong distribution – making it a likely area for liquidity hunts and fake breakouts before any corrective move.
🎯 Key Price Levels
🔴 Resistance Zones (Potential Distribution Areas)
4274 – 4295
4330 – 4345 (FVG + Biggest Trap Zone)
Expect volatility and sharp reactions here – suitable for partial profit-taking, not for chasing buy entries.
🟢 Support / Buy Zones (Institutional Demand Areas)
1️⃣ BUY Opportunity – Shallow Pullback (High Probability)
Entry: 4170 – 4190 (H4 OB + BOS retest)
SL: Below 4170
TP1: 4275
TP2: 4360 – 4400
➡️ This is today’s primary setup. Requires clear bullish confirmation on entry.
2️⃣ BUY Opportunity – Deep Pullback (High R:R Setup)
Entry: 4100 – 4120 (Deep OB + liquidity sweep level)
SL: Below 4100
TP1: 4275
TP2: 4360 – 4400
➡️ Best scenario if the market retraces deeply — exceptional Risk:Reward.
📉 Why Selling Is Not a Priority
Despite resistance overhead, the market remains:
Bullish in structure
Supported by demand zones
Without a confirmed Market Structure Shift (MSS) → Bearish BOS
Therefore, selling remains counter-trend and not part of the main trading plan today.
📈 Institutional Technical Outlook (H1/H4)
1. Price approaching 4280 – 4330 trap zone
Expect:
Liquidity sweeps
Wick-driven false breakouts
Short-term corrections back into OB before continuing upwards
2. Liquidity Map
4170 liquidity pool below current price → likely target for engineered pullback
4300 – 4350 equal highs → attractive upside draw for smart money
🧠 Professional Trade Plan Summary
✔️ Do not chase breakouts near resistance
✔️ Wait for price to retrace into:
4170 – 4190
4100 – 4120
✔️ Main targets:
TP1: 4275
TP2: 4360 – 4400
✔️ At TP1:
Secure 50%
Move SL to Break-Even
✔️ Plan invalidation if price closes below 4100
📌 Notes for Large-Capital Traders (UK/EU)
Today’s environment is ideal for high-quality, low-frequency entries at institutional demand zones.
Avoid buying at highs; patience will deliver the best setups.
This plan follows a clean institutional trend-following methodology — suitable for accounts prioritising consistency and low drawdown.
📊 Daily Bias: Strong BUY
⏳ Waiting for pullback towards 4170 – 4190 or 4100 – 4120
🚀 Targeting 4360 – 4400 over the next sessions

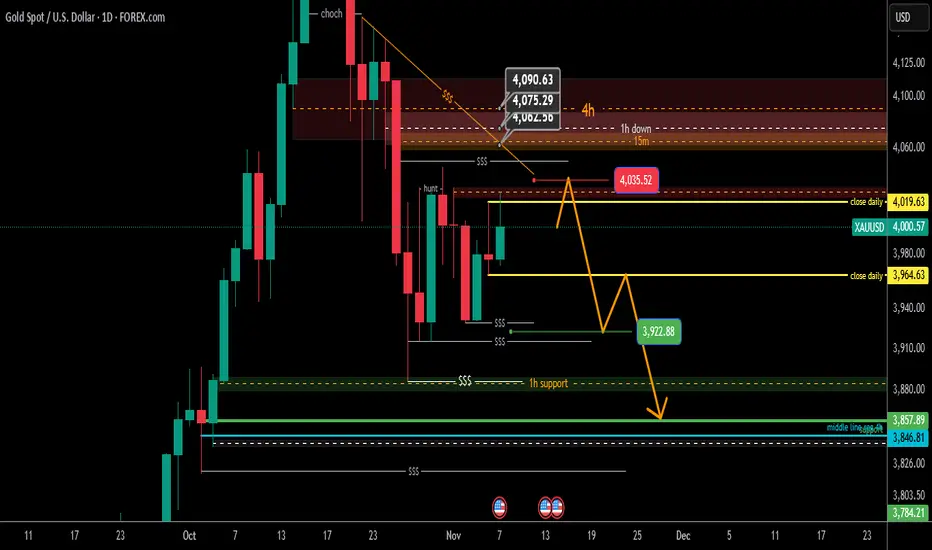
Gold Analysis Daily Time Frame
Hello Traders
Gold is within its daily range (4024 - 3929) and for Monday it will be important whether it can close above or below the marked candle.
I expect a similar move for gold this week, the condition for this move is that the daily candle does not close above 4019, if the Monday candle moves towards 4035 and immediately stabilizes below 4019, this path can be expected to continue until liquidity levels are low.
The three levels of 4062, 4075 and 4090 are still important resistance points, and the market has not yet pulled back to these levels, so the price may be slightly higher than these areas to continue the path. Good luck
Wave 5 is about to start – today just time your Buy right!📊 Wave Perspective
The market is still following the scenario of one more wave 5 increase.
It is expected that on Friday morning, the price may move around 3765 to confirm the continuation trend.
After confirmation, there will be 2 important zones to time your Buy for the big wave.
✅ Trading Plan
Zone 1: High Entry – Main Priority
Entry: 3749 – 3751
SL: 3746
TP: 3792
This is the first buying point, suitable for those who want to enter the wave early following the trend.
Zone 2: Backup Entry – Last Support
Entry: 3738 – 3736
Maximum SL: 3730
TP: 3792
This is a strong support zone, if the price breaks zone 1, this will be the "timing" zone to re-enter.
Note: Since this is a backup entry, reduce Lot size, widen SL a bit, and tighten SL when the price matches to optimize risk.
📌 Capital Management Note
Every order must comply with SL to avoid risks.
Prioritize entering orders according to the big wave plan, avoid FOMO.
EA setup: should be set to Only Buy according to the upward wave perspective.
Analysis perspective is for reference only, combine with personal view before entering orders.
🎯 Expectation
If the scenario is correct, the price may complete wave 5 at target 3792.
Upon reaching TP, partial take profit can be done to secure profits.

XAU/USD 16 September 2025 Intraday AnalysisH4 Analysis:
-> Swing: Bullish.
-> Internal: Bullish.
As mentioned in analysis dated 04 September 2025, with respect to alternative scenario, price could potentially continue higher, is how price printed, price continued its upward trajectory printing all-time-highs.
Price previously, and has now for the second time, printed a bearish CHoCH which is the first indication, but not confirmation, of bearish pullback phase initiation, however, due to the insignificant nature of the pullback, particularly relative to previous price action, I will apply discretion and not classify previous iBOS, I also have marked this in red.
Price has continued with it's upward trajectory. We are now trading within an internal low and fractal high.
Intraday Expectation:
Price to print bearish CHoCH, which is the first indication, but not confirmation, of bearish pullback phase initiation. CHoCH positioning is denoted with a blue dotted line.
Price to then trade down to either discount of internal 50% EQ, or H4 supply zone before targeting weak internal high priced at 3,697.405.
Alternative scenario: Price could potentially print higher-highs.
Note:
The Federal Reserve’s sustained dovish stance, coupled with ongoing geopolitical uncertainties, is likely to prolong heightened volatility in the gold market. Given this elevated risk environment, traders should exercise caution and recalibrate risk management strategies to navigate potential price fluctuations effectively.
Additionally, gold pricing remains sensitive to broader macroeconomic developments, including policy decisions under President Trump. Shifts in geopolitical strategy and economic directives could further amplify uncertainty, contributing to market repricing dynamics.
H4 Chart:
M15 Analysis:
-> Swing: Bullish.
-> Internal: Bullish.
Price has continued with its bullish trajectory printing all-time-highs.
Price is currently trading within and internal low and fractal high. CHoCH positioning is denoted with a blue dotted line.
Intraday Expectation:
Price to continue bearish, react at either M15 supply zone, or discount of 50% internal EQ before targeting weak internal high priced at 3,697.405.
Alternative scenario: Price could potentially continue bullish.
Note:
Gold remains highly volatile amid the Federal Reserve's continued dovish stance, persistent and escalating geopolitical uncertainties. Traders should implement robust risk management strategies and remain vigilant, as price swings may become more pronounced in this elevated volatility environment.
Additionally, President Trump’s recent tariff announcements are expected to further amplify market turbulence, potentially triggering sharp price fluctuations and whipsaws.
M15 Chart:

GOLD DAILY PLAN 09/15: SMC & WYKOOF LOGIC🔎 Market Overview
Market Structure (SMC): Price is currently within a short-term descending channel but showing signs of Wyckoff accumulation around the 3620 – 3635 zone (Liquidity BUY). This is a key support area.
Wyckoff: After the supply test, price is likely to consolidate and then push upwards to sweep liquidity above (Liquidity SELL at 3688 – 3703).
Liquidity Zones:
Liquidity BUY: 3595 – 3592 (major demand area)
Liquidity SELL: 3688 – 3703 (profit-taking & potential reversal zone)
📌 Key Levels
Resistance: 3668 – 3688 – 3703
Support: 3634 – 3629 – 3622 – 3617
🟢 BUY Plan (Primary Setup)
Entry: 3595 – 3592
Stop Loss (SL): 3587 (below Liquidity BUY)
Take Profit (TP) targets:
TP1: 3615
TP2: 3625
TP3: 3635
TP4: 3645
Open TP: 3685 (extended Wyckoff target)
🔴 SELL Plan (Counter-trade)
Entry: 3698 – 3701 (Liquidity SELL zone)
Stop Loss (SL): 3706 (just above breakout trap)
Take Profit (TP) targets:
TP1: 3690
TP2: 3680
TP3: 3670
TP4: 3660
Open TP: 3650
⚡ Scalping Strategy
Only enter when confirmation signals occur at Order Blocks (OB) or Liquidity Zones.
Prioritise BUY trades at support and SELL trades at resistance.
Apply strict risk management: no more than 1–2% risk per trade.
✅ Conclusion:
Main directional bias for the day: BUY from 3595 – 3592, targeting the 3685 – 3700 region.
At Liquidity SELL 3688 – 3703, short-term SELL setups can be considered with targets back to 3660 – 3650.

XAU/USD 05 September 2025 Intraday AnalysisH4 Analysis:
-> Swing: Bullish.
-> Internal: Bullish.
Analysis/bias remains the same as yesterday's analysis dated 04 September 2025.
Price has finally printed a bullish iBOS, in-line with analysis dated 23 April 2025
As mentioned in yesterday's analysis, with respect to alternative scenario, price could potentially continue higher, is how price printed, price continued its upward trajectory printing all-time-highs.
Price has printed a bearish CHoCH which is the first indication, but not confirmation, of bearish pullback phase initiation.
Intraday Expectation:
Price to trade down to either discount of internal 50% EQ, or H4 supply zone before targeting weak internal high priced at 3,578.660.
Alternative scenario: Price could potentially print higher-highs.
Note:
The Federal Reserve’s sustained dovish stance, coupled with ongoing geopolitical uncertainties, is likely to prolong heightened volatility in the gold market. Given this elevated risk environment, traders should exercise caution and recalibrate risk management strategies to navigate potential price fluctuations effectively.
Additionally, gold pricing remains sensitive to broader macroeconomic developments, including policy decisions under President Trump. Shifts in geopolitical strategy and economic directives could further amplify uncertainty, contributing to market repricing dynamics.
H4 Chart:
M15 Analysis:
-> Swing: Bullish.
-> Internal: Bullish.
Analysis/bias remains the same as yesterday's analysis dated 04 September 2025.
Price has printed according to analysis dated 13 June 2025 by targeting weak internal high priced at 3,451.375 and printing a bullish iBOS.
Price has again continued with its bullish trajectory printing all-time-highs with previous pullbacks being very minimal, therefore, I will again apply discretion and mark previous iBOS in red due to insignificant depth of pullback.
Price has printed a bearish CHoCH which confirms internal structure, however, I will continue to monitor depth of pullback.
Intraday Expectation:
Price to continue bearish, react at either M15 supply zone, or discount of 50% internal EQ before targeting weak internal high priced at 3,578.660.
Note:
Gold remains highly volatile amid the Federal Reserve's continued dovish stance, persistent and escalating geopolitical uncertainties. Traders should implement robust risk management strategies and remain vigilant, as price swings may become more pronounced in this elevated volatility environment.
Additionally, President Trump’s recent tariff announcements are expected to further amplify market turbulence, potentially triggering sharp price fluctuations and whipsaws.
M15 Chart:

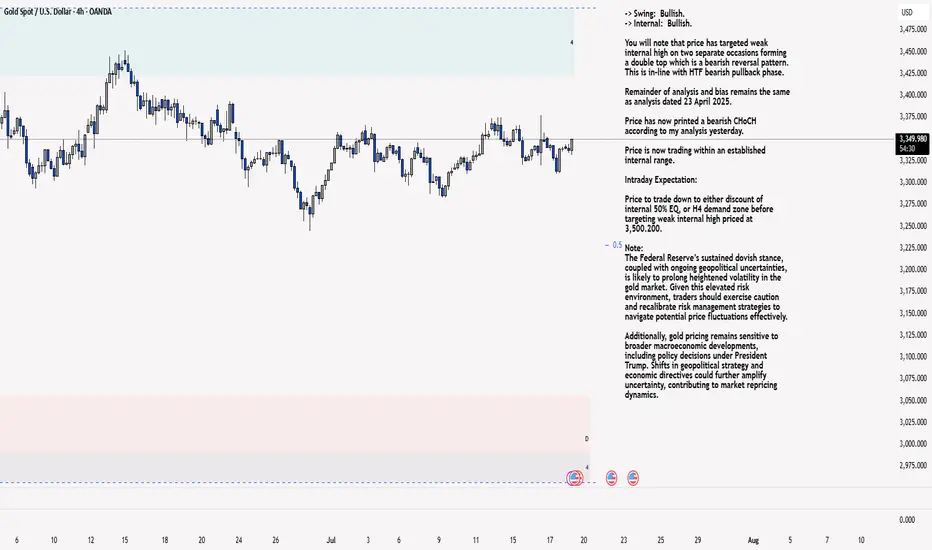
XAU/USD 02 September 2025 Intraday AnalysisH4 Analysis:
-> Swing: Bullish.
-> Internal: Bullish.
You will note that price has targeted weak internal high on three separate occasions which has now formed a triple top, this is a bearish reversal pattern and proving this zone is a strong supply level. This is in-line with HTF bearish pullback phase.
Remainder of analysis and bias remains the same as analysis dated 23 April 2025.
Price has now printed a bearish CHoCH according to my analysis yesterday.
Price is now trading within an established internal range.
Intraday Expectation:
Price to trade down to either discount of internal 50% EQ, or H4 demand zone before targeting weak internal high priced at 3,500.200.
Note:
The Federal Reserve’s sustained dovish stance, coupled with ongoing geopolitical uncertainties, is likely to prolong heightened volatility in the gold market. Given this elevated risk environment, traders should exercise caution and recalibrate risk management strategies to navigate potential price fluctuations effectively.
Additionally, gold pricing remains sensitive to broader macroeconomic developments, including policy decisions under President Trump. Shifts in geopolitical strategy and economic directives could further amplify uncertainty, contributing to market repricing dynamics.
H4 Chart:
M15 Analysis:
-> Swing: Bullish.
-> Internal: Bullish.
Price has printed according to analysis dated 13 June 2025 by targeting weak internal high priced at 3,451.375 and printing a bullish iBOS.
Price has continued to print bullish with previous pullback being very minimal, therefore, I will apply discretion and mark previous iBOS in red due to depth of pullback.
Price has since printed a bearish CHoCH which confirms internal structure, however, I will continue to monitor depth of pullback.
Intraday Expectation:
Price to continue bearish, react at either M15 supply zone, or discount of 50% internal EQ before targeting weak internal high priced at 3,508.790.
Note:
Gold remains highly volatile amid the Federal Reserve's continued dovish stance, persistent and escalating geopolitical uncertainties. Traders should implement robust risk management strategies and remain vigilant, as price swings may become more pronounced in this elevated volatility environment.
Additionally, President Trump’s recent tariff announcements are expected to further amplify market turbulence, potentially triggering sharp price fluctuations and whipsaws.
M15 Chart:

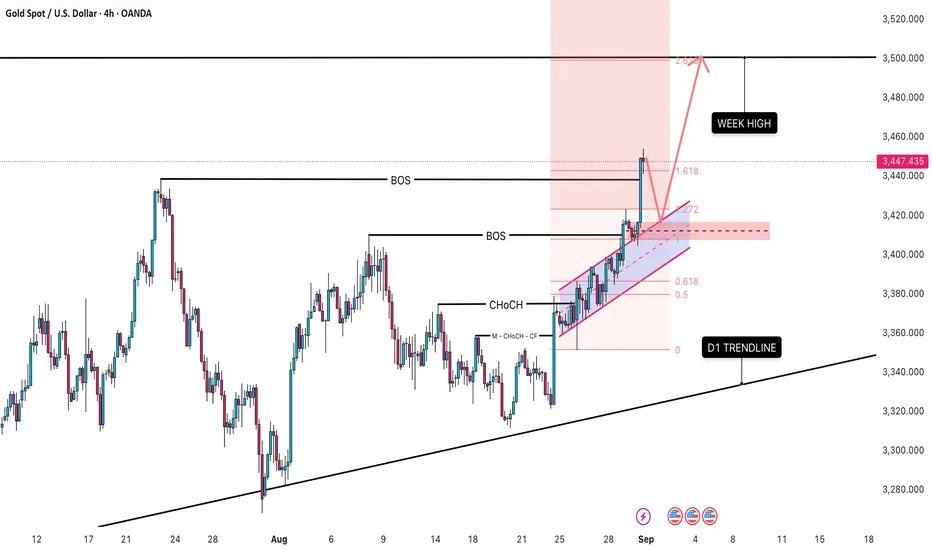
OPEN WEEK WILL DUMP TO 3410 OR PUMP TO 3500 ?The chart shows that gold is currently in a strong bullish trend. Price has broken above a significant supply zone, which now acts as a demand zone. The recent "BOS" (Break of Structure) confirms this bullish momentum.
Trading Strategy
1. Bullish Scenario (Primary):
Entry: Look for a pullback to the key demand zone around the 3,410–3,425 level. This is a high-probability area for a bounce.
Target: The main target for this bullish move is the new week high at 3,500 and potentially extending to 3,520.
Stop Loss: Place your stop loss below the low of the demand zone to protect your capital.
2. Bearish Scenario (Secondary):
Confirmation: A break below the demand zone at 3,410 would invalidate the primary bullish plan.
Target: If this happens, price could retrace back to the D1 Trendline around the 3,350 level.
3. Key Levels to Watch:
Support:
3,410 - 3,425: Major demand zone.
3,380: A minor support level.
3,350: The D1 Trendline.
Resistance:
3,447: Current high.
3,500: Key psychological and structural resistance level.
3,520: Final target.
Important Notes
Risk Management: Always use a proper stop loss and never risk more than 1-2% of your capital on a single trade.
Confirmation: Wait for bullish price action signals like an engulfing candle, pin bar, or double bottom on a lower timeframe before entering a long position.
Market News: Be aware of any high-impact news events that could affect the price of gold.
XAU/USD 07 August 2025 Intraday AnalysisH4 Analysis:
-> Swing: Bullish.
-> Internal: Bullish.
You will note that price has targeted weak internal high on three separate occasions which has now formed a triple top, this is a bearish reversal pattern and proving this zone is a strong supply level. This is in-line with HTF bearish pullback phase.
Remainder of analysis and bias remains the same as analysis dated 23 April 2025.
Price has now printed a bearish CHoCH according to my analysis yesterday.
Price is now trading within an established internal range.
Intraday Expectation:
Price to trade down to either discount of internal 50% EQ, or H4 demand zone before targeting weak internal high priced at 3,500.200.
Note:
The Federal Reserve’s sustained dovish stance, coupled with ongoing geopolitical uncertainties, is likely to prolong heightened volatility in the gold market. Given this elevated risk environment, traders should exercise caution and recalibrate risk management strategies to navigate potential price fluctuations effectively.
Additionally, gold pricing remains sensitive to broader macroeconomic developments, including policy decisions under President Trump. Shifts in geopolitical strategy and economic directives could further amplify uncertainty, contributing to market repricing dynamics.
H4 Chart:
M15 Analysis:
-> Swing: Bullish.
-> Internal: Bullish.
H4 Timeframe - Price has failed to target weak internal high, therefore, it would not be unrealistic if price printed a bearish iBOS.
The remainder of my analysis shall remain the same as analysis dated 13 June 2025, apart from target price.
As per my analysis dated 22 May 2025 whereby I mentioned price can be seen to be reacting at discount of 50% EQ on H4 timeframe, therefore, it is a viable alternative that price could potentially print a bullish iBOS on M15 timeframe despite internal structure being bearish.
Price has printed a bullish iBOS followed by a bearish CHoCH, which indicates, but does not confirm, bearish pullback phase initiation. I will however continue to monitor, with respect to depth of pullback.
Intraday Expectation:
Price to continue bearish, react at either M15 supply zone, or discount of 50% internal EQ before targeting weak internal high priced at 3,451.375.
Note:
Gold remains highly volatile amid the Federal Reserve's continued dovish stance, persistent and escalating geopolitical uncertainties. Traders should implement robust risk management strategies and remain vigilant, as price swings may become more pronounced in this elevated volatility environment.
Additionally, President Trump’s recent tariff announcements are expected to further amplify market turbulence, potentially triggering sharp price fluctuations and whipsaws.
M15 Chart:

XAU/USD 18 July 2025 Intraday AnalysisH4 Analysis:
-> Swing: Bullish.
-> Internal: Bullish.
You will note that price has targeted weak internal high on two separate occasions forming a double top which is a bearish reversal pattern. This is in-line with HTF bearish pullback phase.
Remainder of analysis and bias remains the same as analysis dated 23 April 2025.
Price has now printed a bearish CHoCH according to my analysis yesterday.
Price is now trading within an established internal range.
Intraday Expectation:
Price to trade down to either discount of internal 50% EQ, or H4 demand zone before targeting weak internal high priced at 3,500.200.
Note:
The Federal Reserve’s sustained dovish stance, coupled with ongoing geopolitical uncertainties, is likely to prolong heightened volatility in the gold market. Given this elevated risk environment, traders should exercise caution and recalibrate risk management strategies to navigate potential price fluctuations effectively.
Additionally, gold pricing remains sensitive to broader macroeconomic developments, including policy decisions under President Trump. Shifts in geopolitical strategy and economic directives could further amplify uncertainty, contributing to market repricing dynamics.
H4 Chart:
M15 Analysis:
-> Swing: Bullish.
-> Internal: Bullish.
H4 Timeframe - Price has failed to target weak internal high, therefore, it would not be unrealistic if price printed a bearish iBOS.
The remainder of my analysis shall remain the same as analysis dated 13 June 2025, apart from target price.
As per my analysis dated 22 May 2025 whereby I mentioned price can be seen to be reacting at discount of 50% EQ on H4 timeframe, therefore, it is a viable alternative that price could potentially print a bullish iBOS on M15 timeframe despite internal structure being bearish.
Price has printed a bullish iBOS followed by a bearish CHoCH, which indicates, but does not confirm, bearish pullback phase initiation. I will however continue to monitor, with respect to depth of pullback.
Intraday Expectation:
Price to continue bearish, react at either M15 supply zone, or discount of 50% internal EQ before targeting weak internal high priced at 3,451.375.
Note:
Gold remains highly volatile amid the Federal Reserve's continued dovish stance, persistent and escalating geopolitical uncertainties. Traders should implement robust risk management strategies and remain vigilant, as price swings may become more pronounced in this elevated volatility environment.
Additionally, President Trump’s recent tariff announcements are expected to further amplify market turbulence, potentially triggering sharp price fluctuations and whipsaws.
M15 Chart:
XAU/USD 17 June 2025 Intraday AnalysisH4 Analysis:
-> Swing: Bullish.
-> Internal: Bullish.
Analysis and bias remains the same as analysis dated 23 April 2025
Price has now printed a bearish CHoCH according to my analysis yesterday.
Price is now trading within an established internal range.
Intraday Expectation:
Price to trade down to either discount of internal 50% EQ, or H4 demand zone before targeting weak internal high priced at 3,500.200.
Note:
The Federal Reserve’s sustained dovish stance, coupled with ongoing geopolitical uncertainties, is likely to prolong heightened volatility in the gold market. Given this elevated risk environment, traders should exercise caution and recalibrate risk management strategies to navigate potential price fluctuations effectively.
Additionally, gold pricing remains sensitive to broader macroeconomic developments, including policy decisions under President Trump. Shifts in geopolitical strategy and economic directives could further amplify uncertainty, contributing to market repricing dynamics.
H4 Chart:
M15 Analysis:
-> Swing: Bullish.
-> Internal: Bullish.
Following previous high, and printing of bearish CHoCH, price has pulled back to an M15 supply zone, where we are currently seeing a reaction. Therefore, I shall now confirm internal high.
Price is now trading within an established internal range.
The remainder of my analysis shall remain the same as analysis dated 13 June 2025, apart from target price.
As per my analysis dated 22 May 2025 whereby I mentioned price can be seen to be reacting at discount of 50% EQ on H4 timeframe, therefore, it is a viable alternative that price could potentially print a bullish iBOS on M15 timeframe despite internal structure being bearish.
Price has printed a bullish iBOS followed by a bearish CHoCH, which indicates, but does not confirm, bearish pullback phase initiation. I will however continue to monitor, with respect to depth of pullback.
Intraday Expectation:
Price to continue bearish, react at either M15 supply zone, or discount of 50% internal EQ before targeting weak internal high priced at 3,451.375.
Note:
Gold remains highly volatile amid the Federal Reserve's continued dovish stance, persistent and escalating geopolitical uncertainties. Traders should implement robust risk management strategies and remain vigilant, as price swings may become more pronounced in this elevated volatility environment.
Additionally, President Trump’s recent tariff announcements are expected to further amplify market turbulence, potentially triggering sharp price fluctuations and whipsaws.
M15 Chart:

XAU/USD 12 June 2025 Intraday AnalysisH4 Analysis:
-> Swing: Bullish.
-> Internal: Bullish.
Analysis and bias remains the same as analysis dated 23 April 2025
Price has now printed a bearish CHoCH according to my analysis yesterday.
Price is now trading within an established internal range.
Intraday Expectation:
Price to trade down to either discount of internal 50% EQ, or H4 demand zone before targeting weak internal high priced at 3,500.200.
Note:
The Federal Reserve’s sustained dovish stance, coupled with ongoing geopolitical uncertainties, is likely to prolong heightened volatility in the gold market. Given this elevated risk environment, traders should exercise caution and recalibrate risk management strategies to navigate potential price fluctuations effectively.
Additionally, gold pricing remains sensitive to broader macroeconomic developments, including policy decisions under President Trump. Shifts in geopolitical strategy and economic directives could further amplify uncertainty, contributing to market repricing dynamics.
H4 Chart:
M15 Analysis:
-> Swing: Bullish.
-> Internal: Bearish.
Analysis and bias remains the same as analysis dated 22 May 2025.
In my analysis from 12 May 2025, I noted that price had yet to target the weak internal high, including on the H4 timeframe. This aligns with the ongoing corrective bearish pullback across higher timeframes, so a bearish internal Break of Structure (iBOS) was a likely outcome.
As anticipated, price targeted strong internal low, confirming a bearish iBOS.
Price has remained within the internal range for an extended period and has yet to target the weak internal low. A contributing factor could be the bullish nature of the H4 timeframe's internal range, which has reacted from a discounted level at 50% of the internal equilibrium (EQ).
Intraday Expectation:
Technically price to continue bullish, react at either premium of internal 50% EQ or M15 demand zone before targeting weak internal low priced at 3,120.765.
Alternative scenario:
Price can be seen to be reacting at discount of 50% EQ on H4 timeframe, therefore, it is a viable alternative that price could potentially print a bullish iBOS on M15 timeframe.
Note:
Gold remains highly volatile amid the Federal Reserve's continued dovish stance and persistent geopolitical uncertainties. Traders should implement robust risk management strategies and remain vigilant, as price swings may become more pronounced in this elevated volatility environment.
Additionally, President Trump’s recent tariff announcements are expected to further amplify market turbulence, potentially triggering sharp price fluctuations and whipsaws.
M15 Chart:

XAU/USD 22 May 2025 Intraday AnalysisH4 Analysis:
-> Swing: Bullish.
-> Internal: Bullish.
Analysis and bias remains the same as analysis dated 23 April 2025
Price has now printed a bearish CHoCH according to my analysis yesterday.
Price is now trading within an established internal range.
Intraday Expectation:
Price to trade down to either discount of internal 50% EQ, or H4 demand zone before targeting weak internal high priced at 3,500.200.
Note:
The Federal Reserve’s sustained dovish stance, coupled with ongoing geopolitical uncertainties, is likely to prolong heightened volatility in the gold market. Given this elevated risk environment, traders should exercise caution and recalibrate risk management strategies to navigate potential price fluctuations effectively.
Additionally, gold pricing remains sensitive to broader macroeconomic developments, including policy decisions under President Trump. Shifts in geopolitical strategy and economic directives could further amplify uncertainty, contributing to market repricing dynamics.
H4 Chart:
M15 Analysis:
M15 Analysis:
-> Swing: Bullish.
-> Internal: Bearish.
In my analysis from 12 May 2025, I noted that price had yet to target the weak internal high, including on the H4 timeframe. This aligns with the ongoing corrective bearish pullback across higher timeframes, so a bearish internal Break of Structure (iBOS) was a likely outcome.
As anticipated, price targeted strong internal low, confirming a bearish iBOS.
Price has remained within the internal range for an extended period and has yet to target the weak internal low. A contributing factor could be the bullish nature of the H4 timeframe's internal range, which has reacted from a discounted level at 50% of the internal equilibrium (EQ).
Intraday Expectation:
Technically price to continue bullish, react at either premium of internal 50% EQ or M15 demand zone before targeting weak internal low priced at 3,120.765.
Alternative scenario:
Price can be seen to be reacting at discount of 50% EQ on H4 timeframe, therefore, it is a viable alternative that price could potentially print a bullish iBOS on M15 timeframe.
Note:
Gold remains highly volatile amid the Federal Reserve's continued dovish stance and persistent geopolitical uncertainties. Traders should implement robust risk management strategies and remain vigilant, as price swings may become more pronounced in this elevated volatility environment.
Additionally, President Trump’s recent tariff announcements are expected to further amplify market turbulence, potentially triggering sharp price fluctuations and whipsaws.
M15 Chart:

XAU/USD 06 May 2025 Intraday AnalysisH4 Analysis:
-> Swing: Bullish.
-> Internal: Bullish.
Analysis and bias remains the same as analysis dated 23 April 2025
Price has now printed a bearish CHoCH according to my analysis yesterday.
Price is now trading within an established internal range.
Intraday Expectation:
Price to trade down to either discount of internal 50% EQ, or H4 demand zone before targeting weak internal high priced at 3,500.200.
Note:
With the Federal Reserve's dovish stance and persisting geopolitical uncertainties, heightened volatility in Gold is expected to continue. Traders should proceed with caution and adjust risk management strategies in this high-volatility environment.
Price could also be driven by President Trump's policies, geopolitical moves and economic decisions which are sparking uncertainty.
H4 Chart:
M15 Analysis:
-> Swing: Bullish.
-> Internal: Bearish.
Price did not print according to previous analysis by failing to target weak internal low.
Price has now printed a bullish iBOS. This is potentially due to the fact that H4 TF was in a bearish pullback phase and reacted at discount of 50% internal EQ which could mean that H4 TF bearish pullback phase is now over and targeting the weak internal high, which is mentioned in H4 analysis.
Price has also printed a bearish CHoCH which indicates, but not confirms bearish pullback phase initiation.
Price is now trading within an established internal range, however, I will continue to monitor depth of pullback.
Intraday Expectation:
Price to trade down to either discount of internal 50% EQ, or M15 supply zones before targeting weak internal high priced at
Note:
With the Federal Reserve maintaining a dovish stance and ongoing geopolitical tensions, volatility in Gold prices is expected to remain elevated. Traders should exercise caution, adjust risk management strategies, and stay prepared for potential price whipsaws in this high-volatility environment.
Trump's tariff announcement will most likely cause considerably increased volatility and whipsaws.
M15 Chart:
