Gold (XAUUSD) – Short SetupGold is currently trading around $3,405 and moving directly into a strong resistance zone between $3400 – $3450. Price is entering a Reversal Zone around that price range, where previous attempts to break higher have failed multiple times.
The structure shows that gold is testing the upper resistance line again, while momentum indicators are already showing signs of exhaustion. If price rejects this area, I expect a potential move down to the following targets:
Target 1 (T1): $3,348
Target 2 (T2): $3,286
Target 3 (T3): $3,169
Stop Loss (SL): Above $3,450
If price breaks above this level with strong volume, the setup becomes invalid.
Summary:
I expect a rejection around the resistance zone and a potential pullback towards lower support levels. If the the resistance zone holds, this setup offers a good risk-reward ratio to the downside.
No financial advice – just my personal trade idea based on my chart.
Golddown

Gold in Monthly Chart "mengkhawatirkan" concerning!FX_IDC:XAUIDRG
IF volume declines and breaks the fibo 0.5; it would be a nightmare for gold.
Fundamentally, gold has been massively collected by some major countries in the last few years. If they got an economic crisis, such as China with Evergrande, they would sell Gold as one of their assets to stimulate their people economically.
#greedycreatesdecentralized

Potential Gold (XAU/USD) Bat; Is gold going down?Soooooo, you know when there's one person in the room that says something crazy.....well I'm possibly about to become that person.
My previous post about the long short on the USD/JPY still shows that there is still a little bit of way for the USD to climb before the drop. So, this took me to the gold chart, and here's where we are at present. I have had this bat drawn for around 10 days, and really didn't believe that it would play out, but so far it is.
This is IMPORTANT bit....this bat could easily break if closes above point C, it could also really break if it doesn't drop down to point D. To get down to point D we need the DXY to rise....and to get to that point we will need the FED to announce a rate rise. Now I'm fully aware that Wall Street is 60/40 that there will be a halt in rate rises, sending the dollar down, but, and it is a but, this chart is a possibility. If there is a rate hike then the chances are that we are heading to point D at 1866, then put your fib on the CD point and 50% is the TP1, point C is TP2.
I'm not saying that any of this will definitely happen, and don't shoot the loony in the room, but it's a possibility that is on the table. Don't forget, the FED won't be worried about throwing the little guy in the street under a bus. Their job is to look after the economy.

How are you going to celebrate DXYday?Making money shorting precious metals / crypto, or making money long USD pairs?
Bull Flag
First target 106

XAUUSD to 1805$ as you can see gold was going long for 3 days without any retracement. and now we gold is trading inside a very pivot zone and we suggest to sell it for long term from here

XAUUSD is in bearish regionGOLD following the downtrend, no it is supposed to be the LH
SELL AT 1813
TP 1804
SL 1816


XAUUSD ShortHello PIPPIN TRADERS!!!!! My personal outlook on GOLD. The structure is moving correctively upwards...that means the BIG GUYS are preparing to make a sudden and huge move. HAPPY PIPPIN!

GOLD going down!!There is a big chance for gold to not break the major trendline.. this price action / channel line is strong enough to pulling back gold until now.. area beetwen 1827 - 1816 has to break down to confirm gold will continue going down.. if gold can hit 1824 there will be the confirmation of double top pattern and chasing the strong support retest at 1680..
will USD strong enough for gold going down to that level??? lets see for 1 or 2 weeks from now...

GOLD IS DOWN !Gold is in a downtrend, which we conclude that it will continue tomorrow in the downtrend


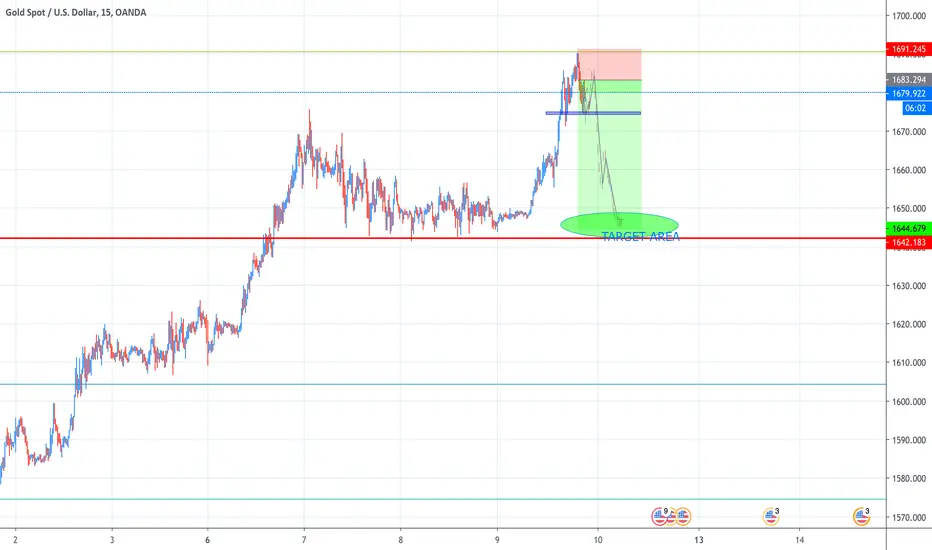
XAUUSD SELLIn this chart analysis Expect GOLD moving down till the target area drawed. Can be a very nice trade if respect support and resistance zones.
GOLD Analysis - Dr GOLDGold has broken the 4hr pink TL, await a retest to Monthly Resistance.
Based on my analysis price will head down before heading further up :D


