Why is gold fluctuating in futures towards the target of 5120?Since 1975, with the increasing decline in the value of the world's most worthless currency, the dollar, all holders of this worthless fiat have been facing losses day by day against a valuable peak in physical assets!
Currently, the dollar is proud to be at the peak of worthlessness with rulers with a brilliant record of abusing children and girls at a very young age, even less than 5 years old, for sexual slavery, and every day, the yellow pumpkin head with a flat stomach the color of its own impurity, with a speechless tongue, is showing the consequences of accompanying these impurities and its fellow cups.
What makes us think is at what moment in history this swamp will drown all its companions forever. With the hope that this will happen soon!!
Good luck
Goldfutures

GOLD $GC XAUUSD Target Hit - UpdateTraders and Investors,
W pattern completed as expected and posted about a few days ago. This has given us a great long swing opportunity and then several long and short opportunities on smaller time frames. We have been trading around the levels and zones taking one of them at a time. Whereas one swing long position has been running for this W pattern completion target.
When W pattern completes the market take a correction, this is why today price fell a bit from the FCP zone as expected. It is now consolidating. Lets see if see a further correction or a breakout in the NY session.
Trade what you see, wait for the confirmations and manage the risk as always.
Follow for more. Please support this analysis by liking, commenting, and sharing with friends, colleagues, traders, and trading communities. Thanks👍🙂

OOO GOLD IS THAT A DOUBLE TOP?I feel like I see a double top formed on the daily! The real test will come with the fib pull back in the 4249-4255 price range but only price will show us but I think we are seeing a key area for gold and If I had to choose I would say we may be heading for a minor pullback to let off some steam and also take some par profits!
Let me know yall thoughts tho and what do you think! GD luck tomorrow, I cant wait for the NY session.

Will Gold (Spot) Test $4,000/oz or Gold is Becoming UnsFall DownGold is Becoming Unstoppable
Made a New Record High of +3976.5
- But Will It Rise Further? Will it Test $4000 per oz?
or
- Will Fall Down From Here (The New ATHs) ?????
Taking reference from the Gold Futures Market
- Gold futures already & officially hit $4,000/oz for the first time in history.
- Generally, it is expected that the spot price & the futures prices converge as the contract expiration date approaches
- That means at expiry, gold spot & future must attain the same level
That means the spot might rise to 4000, or the future price might fall from 4000
The attached Gold mini future chart says that gold prices might fall from current levels

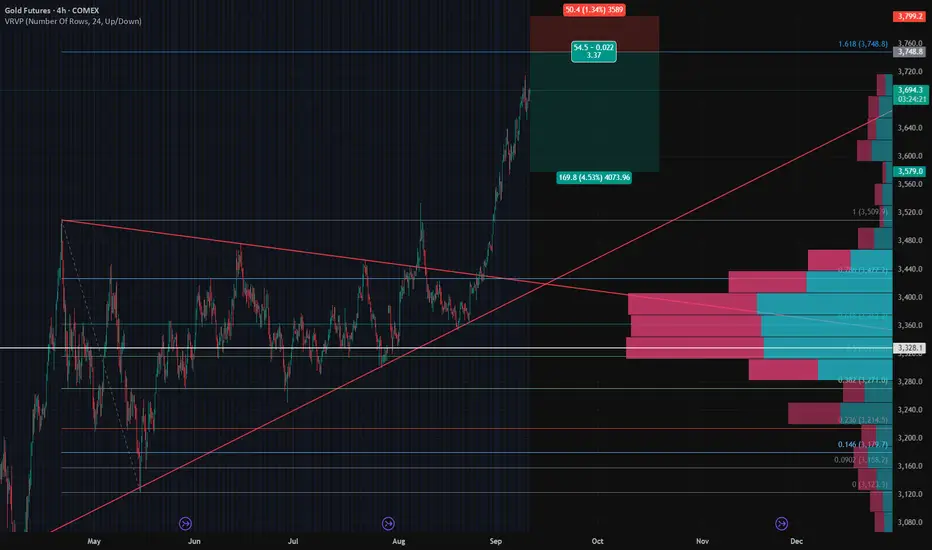
Gold Futures – Short Setup to Lock in Profits🟠 Gold Futures – Short Setup to Lock in Profits
Gold has had a strong breakout above the symmetrical triangle and has now pushed into an extended move near $3,700+. While the trend remains bullish on the higher timeframe, the current leg looks overextended, and I’m looking to hedge profits with a short setup.
🔑 Key Technicals
Pattern Breakout: Gold broke out of a long consolidation wedge and accelerated higher.
Resistance Zone: Price is testing the Fib 1.618 extension near $3,750, a potential exhaustion area.
Volume Profile: Strong demand zone sits between $3,300 – $3,360 where most volume is concentrated. A pullback could retest this area.
Risk-Reward: Setup gives ~1:3.4 RR with stop above recent highs and target into the HVN zone.
📉 Trade Idea – Protective Short
Entry: 3750
Stop Loss: 3800 (extension level).
Take Profit: $3580
⚖️ Strategy
This is not a reversal call – the larger trend is still bullish. The short setup is hedge/profit-protection only, aiming to capture a pullback after the parabolic leg.
I’ll be watching if buyers can defend $3,600 on the first dip; failure to hold could accelerate selling toward the high-volume zone.
📊 Bias
Short-term: Bearish (pullback expected)
Mid-term: Neutral to Bullish (trend intact above $3,300)
What do you think – do we see a healthy correction here, or is gold too strong to fade yet?
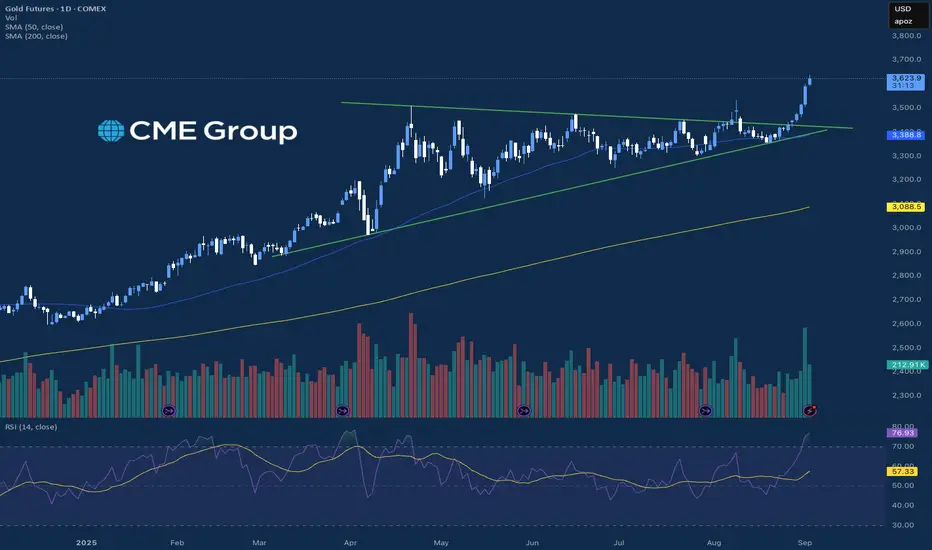
All Time Highs for Precious MetalsGold and Silver are continuing to show resilience today leading the precious metals higher to new all time high prices. Looking at the Gold market, today marks 5 consecutive days with a higher all-time high and a higher low, and Silver has had 4 consecutive days with a higher high and higher low, which is rare to see at elevated prices for these markets. There was some significant data released looking at JOLTs, which was the lowest reported number since Match of 2021 which led Gold and Silver to both see positive gains again today. Along with that, there is an expected nonfarm payrolls report and an unemployment rate coming out Friday, and the nonfarm payrolls number is expected at 74k, which is the lowest expected number since February of 2021.
Equity markets battled back and forth today and the S&P and Nasdaq were able to finish the day positive with a strong upside move into the close. With the equities trading near all time high prices, there will be a lot of attention on the economic data for the rest of the week looking at jobs and employment. The CME Fed Watch Tool also saw slight shifts over the past 2 days and now are pricing in a 25-basis point rate cut for the September and October meeting. These figures have been changing rapidly, and traders will get more clarity once we hear from Powell after the September meeting in a few weeks.
If you have futures in your trading portfolio, you can check out on CME Group data plans available that suit your trading needs tradingview.com/cme/
*CME Group futures are not suitable for all investors and involve the risk of loss. Copyright © 2023 CME Group Inc.
**All examples in this report are hypothetical interpretations of situations and are used for explanation purposes only. The views in this report reflect solely those of the author and not necessarily those of CME Group or its affiliated institutions. This report and the information herein should not be considered investment advice or the results of actual market experience.
GOLD (XAUUSD): Bullish! Look For Buys!In this Weekly Market Forecast, we will analyze the Gold (XAUUSD) for the week of Sept 1 - 15th.
Gold has been ranging for months. August closed strong, above the high of July. I am looking for continuation of this bullish momentum in September.
Wait for buying opportunities. Be patient. +FVGs will form, and present the best POIs for long entries.
Enjoy!
May profits be upon you.
Leave any questions or comments in the comment section.
I appreciate any feedback from my viewers!
Like and/or subscribe if you want more accurate analysis.
Thank you so much!
Disclaimer:
I do not provide personal investment advice and I am not a qualified licensed investment advisor.
All information found here, including any ideas, opinions, views, predictions, forecasts, commentaries, suggestions, expressed or implied herein, are for informational, entertainment or educational purposes only and should not be construed as personal investment advice. While the information provided is believed to be accurate, it may include errors or inaccuracies.
I will not and cannot be held liable for any actions you take as a result of anything you read here.
Conduct your own due diligence, or consult a licensed financial advisor or broker before making any and all investment decisions. Any investments, trades, speculations, or decisions made on the basis of any information found on this channel, expressed or implied herein, are committed at your own risk, financial or otherwise.

Gold Futures – Waiting for the Flush Before the Long (Asian KillMarket Context:
Gold is sitting right inside a confluence zone — overlapping Daily + H4 Fair Value Gaps at 3,375–3,380. This zone also aligns with the lower boundary of last week’s range (W-L at 3,397).
What I’m Watching:
Going into the Asian Killzone, I’m looking for an impulsive spike down into this FVG.
This move would ideally push below 3,375, tag liquidity, and create DOM excess — the kind of aggressive selling that often marks exhaustion before reversal.
ADX is above 25 and rising, signaling momentum is strong — but we’re at a potential pivot level.
Bullish Setup Criteria:
Flush down into 3,375 or slightly below.
DOM excess showing absorption (stuck sellers).
Strong rejection candle (M1/M5) followed by bullish follow-through.
Targets if Triggered:
T1: 3,397 (Weekly Low)
T2: 3,423 (Daily High)
Stretch: 3,451 (Monthly High)
Invalidation:
1H close below 3,375 without immediate reclaim.
Summary:
Patience is key. I want to see sellers press in during Asia, fail to break down with continuation, and then get run over on a squeeze higher. If we get the right reaction, this could be the start of a strong move into Weekend.

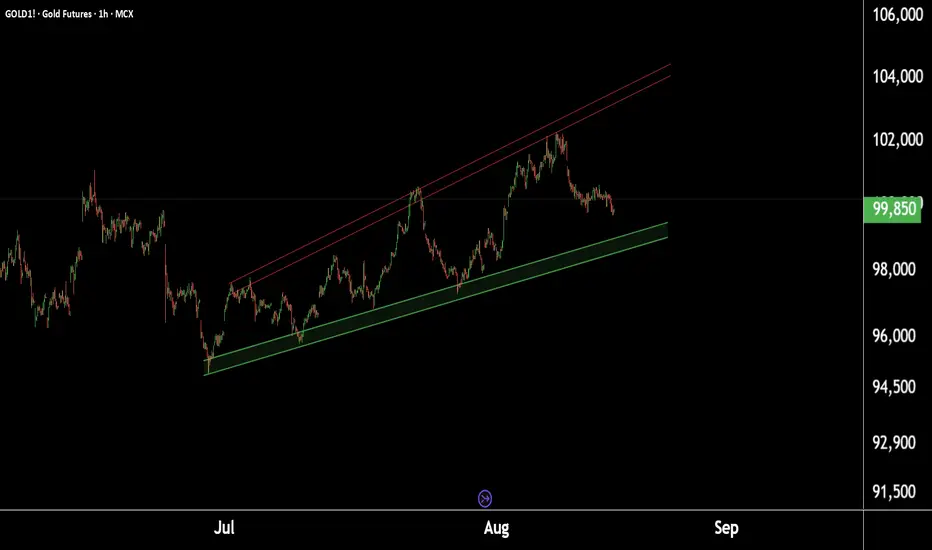
Gold at Crucial Levels – Buy or Sell? Watch These Key Price ZoneDaily Gold Update:
This is the daily timeframe chart of Gold1!.
Gold1! is forming an ascending broadening wedge pattern with support in the ₹98,500–₹98,800 range.
If this support holds, we may see higher prices.
However, if it breaks, Gold1! could decline towards its pattern target near ₹95,000.
Thank You !!
Gold Futures Hit $3,534 – Spot Lags by $100. What Could Mean?I don’t usually track Gold Futures every single day, but today a fellow trader drew my attention to something — and it’s impossible to ignore.
Gold Futures just printed an all-time high at $3,534, while spot gold (XAUUSD) topped at $3,409 — a $120 spread at the peak, now narrowed to about $100 at the time of writing.
A spread like this is highly unusual and, more importantly, unsustainable. By the time the August 27th contract expires, futures and spot must converge to the same price.
That means one of two things is about to happen — and either way, the move would be explosive.
1. Bullish Scenario – Futures Are Right
If the futures market is telling the truth, spot gold will have to accelerate higher to close the $100 gap.
If XAUUSD stabilize above $3,400, the odds of a push toward its own ATH become significant — and the move could be fast and aggressive.
________________________________________
2. Bearish Scenario – Futures Are Overreaching
If futures are overshooting, they will have to correct — hard.
From a technical standpoint, if spot will drop below $3,370, the door to a continuation is open toward at least $3,330 support.
A 400-pip drop in spot could translate into at least a 1,000-pip drop in futures, bringing the spread back toward its more typical 20–30 range.
________________________________________
Why This Matters?
Regardless of direction, $100+ spreads do not last. In the next three weeks, one side will be proven wrong, and the prices will snap back together.
Looking back at this year’s price action, spot and futures have always mirrored each other with an average spread of 20-30usd, depending on conditions and expectation, and for example:
• The spot ATH at $3,500 matches $3,509 in futures.
• The May low was identical in both markets.
This current divergence is the outlier — and it’s screaming that a major move is coming.
________________________________________
Bottom line: If futures are right, spot gold is about to rip higher. If spot is right, futures are about to collapse.

Gold Fails to Break Tuesday’s High – H4 FVG Still in SightGold continues to coil beneath Tuesday’s high, showing signs of failed bullish follow-through. Price attempted to press higher but couldn’t break out — a sign that sellers may still be in control. We’re still under key resistance at the Daily High, and that unfilled H4 Fair Value Gap below remains a prime draw.
🧠 My outlook:
Expecting price to run back down toward the H4 FVG.
Watching for a potential stop run above Tuesday’s high to clean up the lack of excess shown on the DOM.
Anticipating the cleanest LONG setup might appear during NY session, but a solid entry could develop during Asian or London for a short if we see early signs of rejection.
Key levels and reactions around D-H and the previous day’s high will be crucial. If the market tips its hand early, I’ll be looking to position short with that FVG as my magnet.
Let me know if you're seeing something different. This feels like a setup that rewards patience and precision.

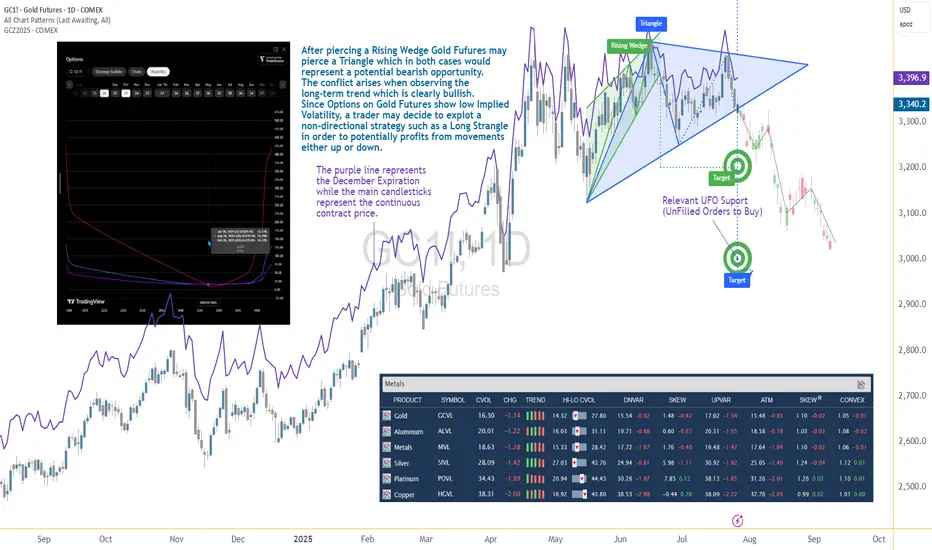
Options Blueprint Series [Intermediate]: Gold Triangle Trap PlayGold’s Volatility Decline Meets a Classic Chart Setup
Gold Futures have been steadily declining after piercing a Rising Wedge on June 20. Now, the market structure reveals the formation of a Triangle pattern nearing its apex — a point often associated with imminent breakouts. While this setup typically signals a continuation or reversal, the direction remains uncertain, and the conflict grows when juxtaposed with the longer-term bullish trajectory Gold has displayed since 2022.
The resulting dilemma for traders is clear: follow the short-term bearish patterns, or respect the dominant uptrend? In situations like these, a non-directional approach may help tackle the uncertainty while defining the risk. This is where a Long Strangle options strategy becomes highly relevant.
Low Volatility Sets the Stage for an Options Play
According to the CME Group’s CVOL Index, Gold’s implied volatility currently trades near the bottom of its 1-year range — hovering just above 14.32, with a 12-month high around 27.80. Historically, such low readings in implied volatility are uncommon and often precede sharp price movements. For options traders, this backdrop suggests one thing: options are potentially underpriced.
Additionally, an IV analysis on the December options chain reveals even more favorable pricing conditions for longer-dated expirations. This creates a compelling opportunity to position using a strategy that benefits from volatility expansion and directional movement.
Structuring the Long Strangle on Gold Futures
A Long Strangle involves buying an Out-of-the-Money (OTM) Call and an OTM Put with the same expiration. The trader benefits if the underlying asset makes a sizable move in either direction before expiration — ideal for a breakout scenario from a compressing Triangle pattern.
In this case, the trade setup uses:
Long 3345 Put (Oct 28 expiration)
Long 3440 Call (Oct 28 expiration)
With Gold Futures (Futures December Expiration) currently trading near $3,392.5, this strangle places both legs approximately 45–50 points away from the current price. The total cost of the strangle is 173.73 points, which defines the maximum risk on the trade.
This structure allows participation in a directional move while remaining neutral on which direction that move may be.
Technical Backdrop and Support Zones
The confluence of chart patterns adds weight to this setup. The initial breakdown from the Rising Wedge in June signaled weakness, and now the Triangle’s potential imminent resolution may extend that move. However, technical traders must remain alert to a false breakdown scenario — especially in trending assets like Gold.
Buy Orders below current price levels show significant buying interest near 3,037.9 (UFO Support), suggesting that if price drops, it may find support and rebound sharply. This adds further justification for a Long Strangle — the market may fall quickly toward that zone or fail and reverse just as violently.
Gold Futures and Micro Gold Futures Contract Specs and Margin Details
Understanding the product’s specifications is crucial before engaging in any options strategy:
🔸 Gold Futures (GC)
Contract Size: 100 troy ounces
Tick Size: 0.10 = $10 per tick
Initial Margin: ~$15,000 (varies by broker and volatility)
🔸 Micro Gold Futures (MGC)
Contract Size: 10 troy ounces
Tick Size: 0.10 = $1 per tick
Initial Margin: ~$1,500
The options strategy discussed here is based on the standard Gold Futures (GC), but micro-sized versions could be explored by traders with lower capital exposure preferences.
The Trade Plan: Long Strangle on Gold Futures
Here's how the trade comes together:
Strategy: Long Strangle using Gold Futures options
Direction: Non-directional
Instruments:
Buy 3440 Call (Oct 28)
Buy 3345 Put (Oct 28)
Premium Paid: $173.73 (per full-size GC contract)
Max Risk: Limited to premium paid
Breakeven Points on Expiration:
Upper Breakeven: 3440 + 1.7373 = 3613.73
Lower Breakeven: 3345 – 1.7373 = 3171.27
Reward Potential: Unlimited above breakeven on the upside, substantial below breakeven on the downside
R/R Profile: Defined risk, asymmetric potential reward
This setup thrives on movement. Whether Gold rallies or plunges, the trader benefits if price breaks and sustains beyond breakeven levels by expiration.
Risk Management Matters More Than Ever
The strength of a Long Strangle lies in its predefined risk and unlimited reward potential, but that doesn’t mean the position is immune to pitfalls. Movement is key — and time decay (theta) begins to erode the premium paid with each passing day.
Here are a few key considerations:
Stop-loss is optional, as max loss is predefined.
Precise entry timing increases the likelihood of capturing breakout moves before theta becomes too damaging. Same for exit.
Strike selection should always balance affordability and distance to breakeven.
Avoid overexposure, especially in low volatility environments that can lull traders into overtrading due to the potentially “cheap” options.
Using strategies like this within a broader portfolio should always come with well-structured risk limits and position sizing protocols.
When charting futures, the data provided could be delayed. Traders working with the ticker symbols discussed in this idea may prefer to use CME Group real-time data plan on TradingView: www.tradingview.com - This consideration is particularly important for shorter-term traders, whereas it may be less critical for those focused on longer-term trading strategies.
General Disclaimer:
The trade ideas presented herein are solely for illustrative purposes forming a part of a case study intended to demonstrate key principles in risk management within the context of the specific market scenarios discussed. These ideas are not to be interpreted as investment recommendations or financial advice. They do not endorse or promote any specific trading strategies, financial products, or services. The information provided is based on data believed to be reliable; however, its accuracy or completeness cannot be guaranteed. Trading in financial markets involves risks, including the potential loss of principal. Each individual should conduct their own research and consult with professional financial advisors before making any investment decisions. The author or publisher of this content bears no responsibility for any actions taken based on the information provided or for any resultant financial or other losses.
GOLD - GC | Weekly Recap & Plan 13.07.2025🟡 GOLD (GC) Weekly Recap & Outlook
Symbol: GC1!
Date: Week of July 8–12, 2025
Timeframes Used: 4H, Daily, Weekly, HTF structure
🔍 What Happened Last Week?
Gold saw a strong rejection from a confluence of two HTF trendlines, signaling resistance.
But that move was absorbed by:
🟦 Daily Demand (blue zone)
🔵 Daily Swing Liquidity (blue line)
This builds a bullish structure on the daily chart.
🧭 Scenarios I'm Watching
Scenario 1 — Minor Pullback:
🔹 Price may revisit the Daily Gap (pink line) and find support for continuation.
Scenario 2 — Deeper Pullback:
🟣 Price could retrace into the HTF bullish trendline (purple) before resuming upside.
🗞️ Bonus Macro Scenario: Powell Resignation?
There are growing rumors that Fed Chair Powell might resign this week.
📈 If that happens, I expect strong bullish momentum in Gold —
→ very limited retracement, and
→ potential straight breakout into new highs.
🎯 Targets for the Week:
✅ 1st Target:
W C DOL (purple line) → acts as a primary take profit area.
✅ 2nd Target (Expansion):
EQHs / DOL (extended purple levels)
Game Plan:
Watch for LTF confirmation on both retracement zones.
Maintain bullish bias unless Daily Demand fails.
If Powell resigns, be ready for breakout setups.

Gold (XAUUSD) Trade Setup – Valid Until July 10, 2025This 15-minute chart shows a clean technical breakout from a falling channel. Here's how to interpret and potentially trade this move:
🧠 Context: What Just Happened
Price was locked inside a descending channel (blue) for multiple sessions.
A breakout occurred above the channel, indicating a potential short-term bullish reversal.
The bounce aligns with recent tariff-related headlines easing off and short-covering momentum building.
I trade these support and resistance lines daily on micro gold futures.
What these lines represent:
Golden Line: Heavy Support or Resistance depending on the price direction towards the lines for major reversal or $10-$15 swings.
Silver Lines: Consolidation areas or mid way support and resistance for a scalping few touches.
Bronze dotted lines: Low volume days support and resistance for a quick $5 up or down.
Also, I can see a directional setup. Here is a hypothetical scenario that could play out:
📌 Key Zones to Watch
🔼 Resistance $3,342 Next major target / sell zone
🟧 Resistance $3,319 Current breakout level retest
⚪ Support $3,307–$3,316 Minor consolidation area
🔻 Support $3,295–$3,289 Strong demand / invalidation
🚨 Bear Pivot $3,272 Break below = bearish return
🧭 Trading Playbook
Bullish Bias (Preferred Scenario)
✅ Break and hold above $3,319 = potential move to $3,342
🎯 Target: $3,340–$3,342
🔒 SL below: $3,307
Optional re-entry on retest of $3,316 zone
Bearish Reversal (If Bulls Fail)
⚠️ If price fails $3,319 and breaks back below $3,307, sellers may reclaim control
📉 Look for short setups toward $3,295 and even $3,272
SL above: $3,319
📌 Key Tip
Watch for volume confirmation and 5m candle closes at each level. Don’t chase — let price come to your levels.
⏳ Validity
This setup remains valid through July 10, or until $3,342 target is hit or $3,272 is broken.
This is not financial advice; it's for educational purposes only.

Gold, GC!, Sideway to the Downside (Long Term)06/30/2025, 10:30 PM PT
GC! is currently at its max around 3,500.
On the Weekly MACD, the crossover between MACD lind signal line already happened. There is also a bearish divergence on weekly chart.
On the Daily chart, RSI just crosses below 50 on RSI, and MACD shows weakness on the bull (it still not in the bear's territory just yet).
Reversasl to bear side may happen if price stays below 3,200
Bullish will continues if price break out of all time high
Current range for big timeframe from 3,200 - 3,500
Plan for swing trade:
Bullish Case (short term): break trendline. If hold above 3,360, price could go up to 3,400 -> 3,450
Bearish Case (short term): If price rejects and stays below 3,360, price could go down 3,310 -> 3,280
***Disclaimer: This analysis and trade plan are for educational and informational purposes only and should not be considered as financial or investment advice.

Gold: Primarily HigherIn our primary scenario, we expect gold to set a new all-time high as part of the ongoing beige wave I. To achieve this, the price should soon generate more upward momentum during the subordinate light green wave 5 and surpass the current all-time high from April 22. Once the wave I cycle has concluded at higher levels, we anticipate the start of a new bearish phase. However, there remains a 40% chance that the precious metal has already completed the beige wave alt.I and is now entering a fresh downward cycle. Under this alternative scenario, the price would break directly below the supports at $3,123 and $2,970.
📈 Over 190 precise analyses, clear entry points, and defined Target Zones - that's what we do.

Gold Future MCXThe Gold Future Price is Stuck in A Triangle Trend Lines.
There is Good Action Seen from Both Buyers and Sellers. Lets se who wins it.
If the price breaks DOWN the Support Trend Line with Good Volume "THE PRICE CAN TRAVEL DOWN TILL 90000 Levels."
If the Price Breks UP the Resistance Trend Line with Good Volume " THE PRICE CAN TRAVEL UP TILL 95500 Levels."
NOTE: (In My View)
Price Going Down till 90000 is More Likely.....

Gold Futures (GC) – May 28, 2025
Gold is currently trading within a clean range, and I’m keeping it simple:
🔴 I will only sell in the red supply zone, but only after seeing confirmed seller reaction and order flow backing the move.
🟢 I will only buy in the green demand zone, once buyers clearly show strength and the flow supports it.
📉 My target for any trade is always the opposite zone — if I sell in the red, I’ll target the green. If I buy in the green, I’m aiming for the red.
All of this holds until aggressive order flow tells me new participants are stepping in and shifting the narrative.
No trades in the middle. Discipline and confirmation first.
#GoldFutures #GCAnalysis #SmartMoney #OrderFlow #SupplyAndDemand #FuturesTrading #PriceAction #TradingDiscipline #TechnicalAnalysis

Gold Futures: Flight of the PhoenixCOMEX:GC1!
Gold Futures Analysis:
Gold futures are currently presenting a clearer picture compared to equity index futures. Crude oil futures, on the other hand, have already priced in much of the recent tariff news, with a reversal observed from the 2025 mid-range back towards $65. Despite heightened volatility, the WTI crude oil market remains relatively balanced, with bearish sentiment materializing, if prices drop below and stay below the $65 mark.
Gold futures, however, are offering more defined risk-reward opportunities at the moment. Our analysis shows a macro bullish trend in gold, along with price discovery and market auction trends visible on lower timeframes.
On the 4-hour chart below, we observe a rising upward channel, with key levels identified and reasoning for these levels labeled on the chart.
Key Levels:
• ATH: 3201.6
• HVN (High Volume Node) for long entry: 3115
• LVN (Low Volume Node)/LIS for short entry: 3095.1
• Key LVN Support: 3003.7-3018
Scenario 1: Bearish Continuation
If Gold futures stay below the trend line that defines both our long and short trade ideas, the bearish scenario could materialize. For a short trade to be viable, we would look for a close below the LVN/LIS level (3095.1) and enter on a pullback, targeting the major LVN support zone around 3018.0.
Example trade parameters for Scenario 1:
• Entry: 3095.1
• Stop: 3125
• Target: 3018
• Risk: 29.9 points
• Reward : 77.1 points
• Risk to Reward Ratio: RRR=77.1/29.9 ≈2.58
Scenario 2: Bullish Reversal
In the event that Gold futures push back towards all-time highs due to heightened uncertainty and a flight to safety, we expect initial profit-taking by shorter timeframe traders to provide a pullback. This could present a long opportunity towards the all-time highs.
Example trade parameters for Scenario 2:
• Entry: 3115
• Stop: 3095
• Target: 3200
• Risk : 20 points
• Reward : 85 points
• Risk-to-Reward Ratio: RRR= 85/20 = 4.25
Important Notes:
• These are example trade ideas, and traders are encouraged to do their own analysis and preparation before entering any positions.
• Stop losses are not guaranteed to trigger at specified levels, and actual losses may exceed predetermined stop levels.

Behind the Curtain: Unveiling Gold’s Economic Catalysts1. Introduction
Gold Futures (GC, MGC and 1OZ), traded on the CME market, are one of the most widely used financial instruments for hedging against inflation, currency fluctuations, and macroeconomic uncertainty. As a safe-haven asset, gold reacts to a wide range of economic indicators, making it crucial for traders to understand the underlying forces driving price movements.
By leveraging machine learning, specifically a Random Forest Regressor, we analyze the top economic indicators influencing Gold Futures on daily, weekly, and monthly timeframes. This data-driven approach reveals the key catalysts shaping GC Futures and provides traders with actionable insights to refine their strategies.
2. Understanding Gold Futures Contracts
Gold Futures (GC) are among the most actively traded futures contracts, offering traders and investors exposure to gold price movements with a range of contract sizes to suit different trading strategies. CME Group provides three types of Gold Futures contracts to accommodate traders of all levels:
o Standard Gold Futures (GC):
Contract Size: Represents 100 troy ounces of gold.
Tick Size: Each tick is 0.10 per ounce, equating to $10 per tick per contract.
Purpose: Ideal for institutional traders and large-scale hedgers.
Margin: Approximately $12,500 per contract.
o Micro Gold Futures (MGC):
Contract Size: Represents 10 troy ounces of gold, 1/10th the size of the standard GC contract.
Tick Size: Each tick is $1 per contract.
Purpose: Allows smaller-scale traders to participate in gold markets with lower capital requirements.
Margin: Approximately $1,250 per contract.
o 1-Ounce Gold Futures (1OZ):
Contract Size: Represents 1 troy ounce of gold.
Tick Size: Each tick is 0.25 per ounce, equating to $0.25 per tick per contract.
Purpose: Provides precision trading for retail participants who want exposure to gold at a smaller contract size.
Margin: Approximately $125 per contract.
Keep in mind that margin requirements vary through time as market volatility changes.
3. Daily Timeframe: Key Economic Indicators
Gold Futures respond quickly to short-term economic fluctuations, and three key indicators play a crucial role in daily price movements:
o Velocity of Money (M2):
Measures how quickly money circulates within the economy.
A higher velocity suggests increased spending and inflationary pressure, often boosting gold prices.
A lower velocity indicates stagnation, which may reduce inflation concerns and weigh on gold.
o Unemployment Rate:
Reflects the strength of the labor market.
Rising unemployment increases economic uncertainty, often driving demand for gold as a safe-haven asset.
Declining unemployment can strengthen risk assets, potentially reducing gold’s appeal.
o Oil Import Price Index:
Represents the cost of imported crude oil, influencing inflation trends.
Higher oil prices contribute to inflationary pressures, supporting gold as a hedge.
Lower oil prices may ease inflation concerns, weakening gold demand.
4. Weekly Timeframe: Key Economic Indicators
While daily fluctuations impact short-term traders, weekly economic data provides a broader perspective on gold price movements. The top weekly indicators include:
o Nonfarm Payrolls (NFP):
Measures the number of new jobs added in the U.S. economy each month.
Strong NFP numbers typically strengthen the U.S. dollar and increase interest rate hike expectations, pressuring gold prices.
Weak NFP figures can drive economic uncertainty, increasing gold’s safe-haven appeal.
o Nonfarm Productivity:
Represents labor efficiency and economic output per hour worked.
Rising productivity suggests economic growth, potentially reducing demand for gold.
Falling productivity can signal economic weakness, increasing gold’s appeal.
o Personal Spending:
Tracks consumer spending habits, influencing economic activity and inflation expectations.
Higher spending can lead to inflation, often pushing gold prices higher.
Lower spending suggests economic slowing, which may either weaken or support gold depending on inflationary outlooks.
5. Monthly Timeframe: Key Economic Indicators
Long-term trends in Gold Futures are shaped by macroeconomic forces that impact investor sentiment, inflation expectations, and interest rates. The most influential monthly indicators include:
o China GDP Growth Rate:
China is one of the largest consumers of gold, both for investment and jewelry.
Strong GDP growth signals robust demand for gold, pushing prices higher.
Slower growth may weaken gold demand, applying downward pressure on prices.
o Corporate Bond Spread (BAA - 10Y):
Measures the risk premium between corporate bonds and U.S. Treasury bonds.
A widening spread signals economic uncertainty, increasing demand for gold as a safe-haven asset.
A narrowing spread suggests confidence in risk assets, potentially reducing gold’s appeal.
o 10-Year Treasury Yield:
Gold has an inverse relationship with bond yields since it does not generate interest.
Rising yields increase the opportunity cost of holding gold, often leading to price declines.
Falling yields make gold more attractive, leading to price appreciation.
6. Risk Management Strategies
Given gold’s volatility and sensitivity to macroeconomic changes, risk management is essential for trading GC Futures. Key risk strategies may include:
Monitoring Global Liquidity Conditions:
Keep an eye on M2 Money Supply and inflation trends to anticipate major shifts in gold pricing.
Interest Rate Sensitivity:
Since gold competes with yield-bearing assets, traders should closely track interest rate movements.
Higher 10-Year Treasury Yields can weaken gold’s value as a non-yielding asset.
Diversification and Hedging:
Traders can hedge gold positions using interest rate-sensitive assets such as bonds or inflation-linked securities.
Gold often performs well in times of equity market distress, making it a commonly used portfolio diversifier.
7. Conclusion
Gold Futures remain one of the most influential instruments in the global financial markets.
By leveraging machine learning insights and macroeconomic data, traders can better position themselves for profitable trading opportunities. Whether trading daily, weekly, or monthly trends, understanding these indicators allows market participants to align their strategies with broader economic conditions.
Stay tuned for the next "Behind the Curtain" installment, where we explore economic forces shaping another key futures market.
When charting futures, the data provided could be delayed. Traders working with the ticker symbols discussed in this idea may prefer to use CME Group real-time data plan on TradingView: www.tradingview.com - This consideration is particularly important for shorter-term traders, whereas it may be less critical for those focused on longer-term trading strategies.
General Disclaimer:
The trade ideas presented herein are solely for illustrative purposes forming a part of a case study intended to demonstrate key principles in risk management within the context of the specific market scenarios discussed. These ideas are not to be interpreted as investment recommendations or financial advice. They do not endorse or promote any specific trading strategies, financial products, or services. The information provided is based on data believed to be reliable; however, its accuracy or completeness cannot be guaranteed. Trading in financial markets involves risks, including the potential loss of principal. Each individual should conduct their own research and consult with professional financial advisors before making any investment decisions. The author or publisher of this content bears no responsibility for any actions taken based on the information provided or for any resultant financial or other losses.

GOLD TRADING POINT UPDATE > READ THE CHAPTIANBuddy'S dear friend 👋
SMC Trading Signals Update 🗾🗺️ Gold Traders SMC-Trading Point update you on New technical analysis setup for Gold 🪙 Gold Traders Gold 3 time frame 🖼️ looking FVG rejected point below 👇 2929+ 29209. Technical patterns). Weekly basis setup. )
Key Resistance level 2929 + 2957
Key Support level 2891 - 2848
2832
Mr SMC Trading point
Pales support boost 🚀 analysis follow)

BUY XAUUSD As you notice on the chart, we have the price that gave us a reversal point in which we will enter.
Set your levels as I set mine!
Follow for more!

SELL XAUUSDOur first trade for the day is on XAUUSD that you can take as a seller following the same levels as mine.
Follow for more!
