Goldfutures


GOLD TRADE PLANMY plan on gold is to sell . Gold has a strong resistance and a high probability to go down .
Gold has a big potential to go down in short period .
Grab your popcorn and watch gold go down
If you enjoyed my idea : LEAVE A LIKE AND A FOLLOW .

GoldTwo possible graphical scenarios for Gold. They are only on a graphic level, without considering anything else.

☆ XAU / USD GOLD — Gold Trading ☆Hello! Gold providing good signals for growth.
For whole 32 days we was in triangle/flag pattern
In Elliott Waves, usually 5th wave on gold have extension. For example on stocks we see extension of 3rd waves.
Please consider to trade with affordable risk.
Stay in touch
this is Artem Crypto.

Gold Bullish Daily Pennant BreakoutPennant completed on the daily gold chart. Breakout to bull side of the pennant had started. Upside initial target is the double 2012 high around $1795ish. We'll see if it plays out.

XAUUSD GOLD SPOT: The Future of Gold???WELCOME TO MY PAGE AND FEEL FREE TO LIKE AND SUPPORT BY FOLLOWING, I hope everyone has a great day in the market today = )
Chart above shows XAUUSD in H1 Time Frame. Continuing from our previous idea, XAUUSD Gold has indeed followed our plan as stated, a BREAKDOWN from the top of the channel line (GREEN) towards the bottom.
Now, we look for how GOLD reacts at the support levels @ 1690 region:
- A REBOUND definitely means a LONG opportunity to the top of channel line @ 1717-1720 area
- A BREAKDOWN from support level @ 1690 would likely mean a major trend reversal for gold (Bullish to bearish)
Following a breakdown would likely mean a retouch of the bottom of channel line, rejection then SELL pressure to our next major support @ 1671
Fundamental Analysis:
As always, it is good to supplement technical analysis with confirmation from news signals, thus allowing a higher rate of profitability and wins.
- A possible strengthening Dollar this week beginning
- Gold prices had been supported last week by market signals suggesting that U.S. official interest rates could turn negative next year as the Fed is forced to resort to ever-more dramatic measures to support the economy. Two senior Fed officials – Atlanta Fed President Raphael Bostic and Chicago counterpart Charles Evans – may both touch on the subject when they speak later Monday.
- Flow of hot money into gold is easing off : Physical demand from Indian retails suffer due to higher prices and a weakening rupiah
- World Gold Council data suggest imports fell 50% from a year ago in the first quarter, while Chinese imports fell by 62%.
Notably, many ETFs who have held gold since May may begin a slow sell off with their inventories to secure profits as they respond to news and the reopenings of economies.
OVERALL TREND, Im Bearish on Gold due to the above reasons.
Of course things can change and to watch out for:
1) Implementation of Negative rates by Fed --> implies a backwardation of fiat monetary system and a shift onto gold instead (You can read about how it works here--> www.goldmoney.com)
2) News of second wave of Pandemic
As always, good luck with all your trades and FEEL FREE TO LIKE AND SUSCRIBE IF YOU LIKE WHAT YOU SEE
Regards,
GOL D ROGER

Gold Futures- Position idea.SwingHello , everyone,
Remember to choose a trade size that fits your budget and doesn’t over-leverage your account. Markets can be unpredictable so ensuring you protect against excessive losses is important to your long-term success.
If you would like to take advantage of this idea make sure to let us know about your progress in a comment.
ATTENTION : The content presented in this publication IS NOT financial or Investissement advice, you are totally responsible for how you manage your capital.
FOLLOW US
LIKE
COMMENT
Kind regards.


Gold 15min opportinity to buy !!3 pullback at the trendline
with an upward trend
Big Probability and opportunity
to go up

Gold hourly for daily tradingIf we have a big volume in the next days that broke 1709.0 ,
the gold will go up for 1718.3 ,
otherwise, it will be a rollback to go down for 1702.05

GOLD scalpI am expecting the price to retest the higher levels. Planning to set a trailing stop in case of a breackout.

XAUUSD IDEA FOR THE FUTUREHeavy seller pressure coming in at the current level we are standing right now. All the way back to 2011'. We can clearly aim for a correction at the .618 fib. Closing some nice 700 pip move

XAUUSD possible to buy!!!As we can see gold now currently sideways
but the gold still in uptrend.
Upside might be over 1700 and downside can be around 1608.
Support will be around 1638 and then 1608.
If the price go up we should take a closely look around 1670 level.
In my plan it will pull back to 1660 and then continue go up to be over 1700
Lucky all everyone

XAUUSD: Sell opportunity on Inverse Head and ShouldersGold is trading on an Inverse Head and Shoulders pattern with the Right Shoulder repeating the Left Shoulder sequence. On the 4H chart it is clearer (RSI = 63.637, MACD = 12.780, ADX = 53.651) as the MACD is repeating the crosses on the exact same spots.
On the MA50 (blue line), which last week supported the current uptrend, breaks then we are expecting a drop first to the 0.5 Fibonacci = 1,577.50 and the 0.786 = 1,505.00 in extension.
** If you like our free content follow our profile (www.tradingview.com) to get more daily ideas. **
Comments and likes are greatly appreciated.

XAUUSD: Sell opportunity within the Channel Down.Gold has formed a Channel Down on the 4H chart (RSI = 55.183, MACD = 5.240, ADX = 19.705). The Lower Low was priced yesterday on the 0.382 Fibonacci retracement and the pattern is now pricing the Lower High. We are expecting the next Lower Low on the 0.5 Fibonacci = 1,550.
** If you like our free content follow our profile (www.tradingview.com) to get more daily ideas. **
Comments and likes are greatly appreciated.


Gold, short term cup & handle pattern forming This is my first post, would love to hear your feedback :)

Gold Futures | Broadening WedgePlease support this idea with LIKE if you find it useful.
Price formed a Right-Angled Broadening Wedge (descending) - bullish pattern. The market closed near the Ichi Cloud support zone. In case we have a confirmed retracement of the Ichi Cloud we can initiate a Long position.
If there is a confirmed breakout of the pattern we can also initiate a long position
Thank you for reading this idea! Hope it's been useful to you and some of us will turn it into profitable.
Remember this analysis is not 100% accurate. No single analysis is. To make a decision follow your own thoughts.
The information given is not a Financial Advice.

GOLD BULL IS AWAITINGGOLD
We can buy at the retrace level which is 1652.00
And the potential take profit will be 1720.00

Hand Sanitizer + Facemasks + Precious MetalsA bit concerned. I dismissed claims that silver would not be available when the time came but tonight, I've just noticed apmex.com (a top online retailer for precious metals) has now listed many of the top selling 1 OZ SILVER BARS as PRE-SALE ONLY. AKA SOLD-OUT. Then I checked the smaller sub ounce gold coins. Same story.
Wonder what happens next?
FOREXCOM:XAGUSD TVC:SILVER TVC:GOLD OANDA:XAUUSD OANDA:XAUEUR FX_IDC:XAUCNY OANDA:XAUJPY AMEX:JNUG AMEX:JDST AMEX:GLD AMEX:GDXJ AMEX:GDX AMEX:BTG NYSE:GOLD AMEX:NGD FX_IDC:XAGUSD AMEX:SLV

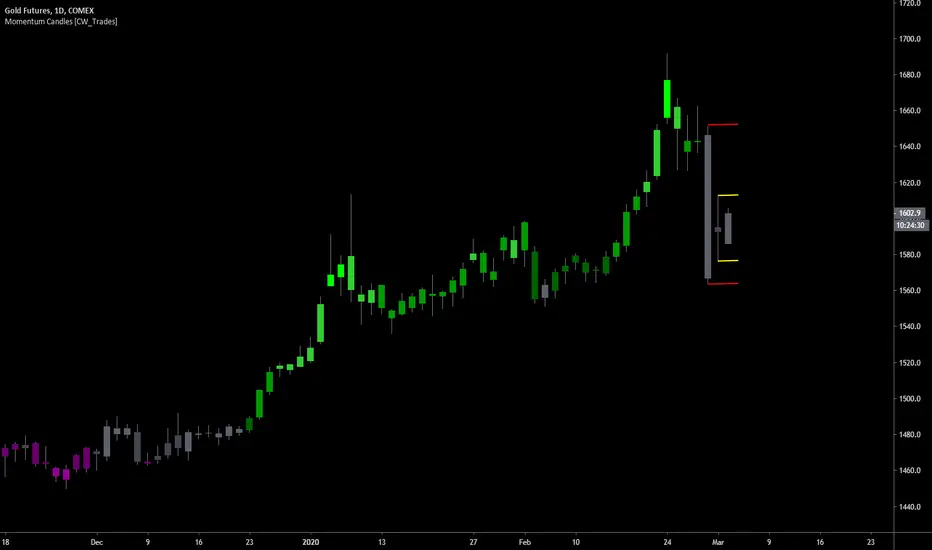
Gold Inside Candles#gc1! #gold – After last week’s market selloff which dropped gold price with it, gold created an inside candle on Monday which could be an indication of a reversal back to the upside ahead.
An inside candle is formed when price trades within the high and low range of the previous candle, making the candle an inside candle. The inside candle is therefore a two candlestick price pattern. An inside candle is also similar to a bullish or a bearish harami candlestick pattern. The main difference being that with an inside candle, the highs and lows are considered while the real body is ignored.
An inside candle is generally considered to be a reversal pattern formed when the second candle or candlestick is engulfed within the previous candlestick’s high and low.
In this gold chart, Friday’s selloff is the first candle in the inside candle pattern shown with two red lines extending from its high and low. Mondays candle is completely inside Fridays high and low and is a long-legged doji candle, where price has a small body and two long wicks extending above and below it. These long wick represent traders attempting to push price higher and lower on Monday, but ultimately closing price near the open which creates a small body. Doji candles represent trader indecision and indicate that they were mostly undecided as to which direction to move price during the course of the day.
The most recent candle, Tuesdays, is also creating another inside day for now as it is trading inside of Mondays total price range indicated by yellow lines.
What we want to see going forward in the immediate short-term is for a price move above Mondays high in price, or above the upper yellow line of Mondays doji candle. From there, a move above Fridays high in price(upper red line) would be further indication that gold traders are still bullish and ready to take price higher.
The overall view on gold remains bullish.