Technical analysis of short-term gold operationsGold rebounded to $3,339 and fell back after encountering resistance. It accelerated its decline after the opening of the U.S. market. After falling to $3,260 and stabilizing, gold began to rebound, and was still suppressed by the integer of $3,300 until the closing. Gold broke upward at the opening of Thursday, rising to $3,367, and fell back to $3,314 after encountering resistance and stabilizing. It is currently trading at $3,337. Overall, gold further retreated to $3,260 to stabilize, and rebounded to $3,367 and encountered resistance, which is basically consistent with the lower space of $3,250 and the upper space of $3,385 given by us.
Gold rebounded after hitting a new low in a week on Wednesday, mainly because Bessant said that tariff negotiations will not start soon and will be conducted at the current trade level between China and the United States. Trump did not propose unilateral reductions in tariffs on Chinese imports and denied any upcoming tax cuts, which increased uncertainty and caused some safe-haven funds to flow back into the gold market.
Goldintraday

Gold fluctuates in a wide range, and the short-term trend is upwGold fell by $240 in two trading days, but the rebound was also very fierce, from yesterday's low of 3260 to 3367 in the early trading. The current volatility is still very large. The high and low points of $100 often appear, and it is normal to fluctuate by dozens of dollars. So pay attention to the market. There is no shortage of opportunities. Just grab what you can grasp.
The daily cycle has stepped back to the MA10 position. It has entered a critical stage. If the bulls recover, the strong rhythm is still there. It is too early to say that the peak has been reached. Pay attention to follow the market and don't be stubborn. The short-term resistance is 3386 and the 618 position of the decline and rebound is 3408. It is recommended to wait and see in the European session and look at the trend. Intervene in the US session.

XAU/USD 24 April 2025 Intraday AnalysisH4 Analysis:
-> Swing: Bullish.
-> Internal: Bullish.
Analysis and bias remains the same as yesterday's analysis dated 23 April 2025
Price has now printed a bearish CHoCH according to my analysis yesterday.
Price is now trading within an established internal range.
Intraday Expectation:
Price to trade down to either discount of internal 50% EQ, or H4 demand zone before targeting weak internal high priced at 3,500.200.
Note:
With the Federal Reserve's dovish stance and persisting geopolitical uncertainties, heightened volatility in Gold is expected to continue. Traders should proceed with caution and adjust risk management strategies in this high-volatility environment.
Price could also be driven by President Trump's policies, geopolitical moves and economic decisions which are sparking uncertainty.
H4 Chart:
M15 Analysis:
-> Swing: Bullish.
-> Internal: Bearish.
Price printed as per my note yesterday whereby I mentioned that we should be surprised if price printed a bearish iBOS as all HTF's require a pullback.
Price subsequently printed a bearish iBOS which confirms internal structure.
Intraday Expectation:
Price has traded up to just short of premium of internal 50% EQ where we are seeing a reaction. Price could potentially trade further into premium of 50%, or H4/M15 nested supply zone before targeting weak internal low priced at 3,260.190.
Note:
With the Federal Reserve maintaining a dovish stance and ongoing geopolitical tensions, volatility in Gold prices is expected to remain elevated. Traders should exercise caution, adjust risk management strategies, and stay prepared for potential price whipsaws in this high-volatility environment.
Trump's tariff announcement will most likely cause considerably increased volatility and whipsaws.
M15 Chart:

XAU/USD 23 April 2025 Intraday AnalysisH4 Analysis:
-> Swing: Bullish.
-> Internal: Bullish.
Price has now printed a bearish CHoCH according to my analysis yesterday.
Price is now trading within an established internal range.
Intraday Expectation:
Price to trade down to either discount of internal 50% EQ, or H4 demand zone before targeting weak internal high priced at 3,500.200.
Note:
With the Federal Reserve's dovish stance and persisting geopolitical uncertainties, heightened volatility in Gold is expected to continue. Traders should proceed with caution and adjust risk management strategies in this high-volatility environment.
Price could also be driven by President Trump's policies, geopolitical moves and economic decisions which are sparking uncertainty.
H4 Chart:
M15 Analysis:
-> Swing: Bullish.
-> Internal: Bullish.
Analysis and bias remains the same as yesterday's analysis dated 22 April 2025.
In addition we should be mindful that All HTF's require a pullback and H$ TF has indicated the start of bearish pullback phase as a bearish CHoCH has been printed, therefore, it should not come as a surprise if price printed a bearish iBOS.
You will note that currently price has mitigated an M15 demand zone and strong low is currently holding.
Price printed as per analysis dated 18 April 2025 by targeting weak internal high.
Price has continued to print higher-highs with minimal pullbacks.
Multiple CHoCH's have been printed, however, I will apply discretion and not classify them as CHoCH's in order not to distort internal structure due to very minimal pullbacks.
Since most recent all time high price has printed a bearish CHOCH and is now trading within an established internal structure which I will continue to monitor.
Intraday Expectation:
Price to trade down to either discount of 50% internal EQ, or M15 demand zone before targeting weak internal high priced at 3,500.200
Note:
With the Federal Reserve maintaining a dovish stance and ongoing geopolitical tensions, volatility in Gold prices is expected to remain elevated. Traders should exercise caution, adjust risk management strategies, and stay prepared for potential price whipsaws in this high-volatility environment.
Trump's tariff announcement will most likely cause considerably increased volatility and whipsaws.
M15 Chart:

XAU/USD 22 April 2025 Intraday AnalysisH4 Analysis:
-> Swing: Bullish.
-> Internal: Bullish.
As mentioned in my analysis dated 16 April 2025 I that will wait for price to print a bearish CHoCH but will also continue to monitor price.
Price printed a bearish CHoCH, however, the pullback was very minimal with price continuing to print higher-highs. As a result I will again apply discretion and mark the CHoCH in red in order not to distort internal structure.
Intraday Expectation:
Await for price to print bearish CHoCH to indicate bearish pullback initiation phase. Bearish CHoCH positioning is denoted with a blue dotted line.
Note:
With the Federal Reserve's dovish stance and persisting geopolitical uncertainties, heightened volatility in Gold is expected to continue. Traders should proceed with caution and adjust risk management strategies in this high-volatility environment.
Price could also be driven by President Trump's policies, geopolitical moves and economic decisions which are sparking uncertainty.
H4 Chart:
M15 Analysis:
-> Swing: Bullish.
-> Internal: Bullish.
Price printed as per analysis dated 18 April 2025 by targeting weak internal high.
Price has continued to print higher-highs with minimal pullbacks.
Multiple CHoCH's have been printed, however, I will apply discretion and not classify them as CHoCH's in order not to distort internal structure due to very minimal pullbacks.
Since most recent all time high price has printed a bearish CHOCH and is now trading within an established internal structure which I will continue to monitor.
Intraday Expectation:
Price to trade down to either discount of 50% internal EQ, or M15 demand zone before targeting weak internal high priced at 3,500.200
Note:
With the Federal Reserve maintaining a dovish stance and ongoing geopolitical tensions, volatility in Gold prices is expected to remain elevated. Traders should exercise caution, adjust risk management strategies, and stay prepared for potential price whipsaws in this high-volatility environment.
Trump's tariff announcement will most likely cause considerably increased volatility and whipsaws.
M15 Chart:

XAUUSD Analysis todayHello traders, this is a complete multiple timeframe analysis of this pair. We see could find significant trading opportunities as per analysis upon price action confirmation we may take this trade. Smash the like button if you find value in this analysis and drop a comment if you have any questions or let me know which pair to cover in my next analysis.

XAU/USD 16 April 2025 Intraday AnalysisH4 Analysis:
-> Swing: Bullish.
-> Internal: Bullish.
Price has printed according to yesterday's analysis, however, as I mentioned in my analysis yesterday whereby I stated that price has printed a bearish CHoCH and I would continue to monitor price.
Price has printed very minimal pullback and continued its bullish trajectory, therefore, I will again apply discretion and not classify a bullish iBOS. I have however marked this in red as a guide.
Intraday Expectation:
Await for price to print bearish CHoCH to indicate bearish pullback initiation phase. Bearish CHoCH positioning is denoted with a blue dotted line.
Note:
With the Federal Reserve's dovish stance and persisting geopolitical uncertainties, heightened volatility in Gold is expected to continue. Traders should proceed with caution and adjust risk management strategies in this high-volatility environment.
Price could also be driven by President Trump's policies, geopolitical moves and economic decisions which are sparking uncertainty.
H4 Chart:
M15 Analysis:
-> Swing: Bullish.
-> Internal: Bullish.
Price did not print according to yesterday's analysis, failing to target weak internal low by printing a bullish iBOS. This is most probably due to Trump's tariff policy and ongoing uncertainty.
Price has now printed a bearish CHoCH to indicate bearish pullback phase initiation.
Price is now trading within an established internal range. However, I will continue to monitor price.
Intraday Expectation:
Price to trade down to either discount of 50% internal EQ, or M15 demand zone before targeting weak internal high priced at 3,317.920
Note:
With the Federal Reserve maintaining a dovish stance and ongoing geopolitical tensions, volatility in Gold prices is expected to remain elevated. Traders should exercise caution, adjust risk management strategies, and stay prepared for potential price whipsaws in this high-volatility environment.
Trump's tariff announcement will most likely cause considerably increased volatility and whipsaws.
M15 Chart:

GoldXAUUSD
- Completed " 12345 " Impulsive Waves
- Break of Structure
- RSI - Divergence
- Bullish Channel as an corrective pattern in Short Time Frame
- Change of Characteristics

THE KOG REPORT THE KOG REPORT:
In last week’s KOG Report we said we would stick with the NFP move and look for price to continue long looking for our target region 3050-55. We were already in the move with the trades protected, however, on open we did get closed at BE only to be able to get a better entry from the undercut low. After the break of the key level and on the flip we managed to then continue with the move upside completing numerous Excalibur targets as well as our bias and red box targets upside.
I can’t say that was an easy week, the move was huge and thankfully we managed to stay the right side of it guided by the in-house indi’s and Excalibur.
So, what can we expect in the week ahead?
Although further upside is likely, we can’t long here as it’s too dangerous after that stretch last week. So let’s see how the market opens and if the Asia session attempts to test that high again. It’s the first level of 3230 that needs to be watched, support here can push us back upside into the above the key level of 3250-55 which is our ideal level for the hunt. If we can stay below that level we could see a RIP and price attempt the correction many traders are looking for in the early part of the week. The lower levels 3220 need to break as well as then the hurdle of 3210 which will make the correction easier.
Due to low volume news next week, we could see a lot of ranging in anticipation of some geopolitical news which will bring sudden spurts of volume and the movement that we want to see.
3190 is the key level support and also the pattern test region, traders should keep an eye on this level of support for any RIP’s and potential for upside, so if attacked a bounce around there should be on the cards. It’s simply a red box break and close week this week, monitoring the price action and only looking for the longs if we get pullbacks, otherwise, 1-2 decent short opportunities should be enough for the short week.
KOG’s bias of the week:
Bearish below 3265 with targets below 3220, 3210. 3197, 3190 and below that 3170
Bullish on break of 3265 with targets above 3276, 3280, 3285 and above that 3292
RED BOXES:
Break above 3250 for 3255, 3261, 3269, 3275 and 3290 in extension of the move
Break below 3230 for 3220, 3210, 3206, 3195 and 3180 in extension of the move
Please do support us by hitting the like button, leaving a comment, and giving us a follow. We’ve been doing this for a long time now providing traders with in-depth free analysis on Gold, so your likes and comments are very much appreciated.
As always, trade safe.
KOG

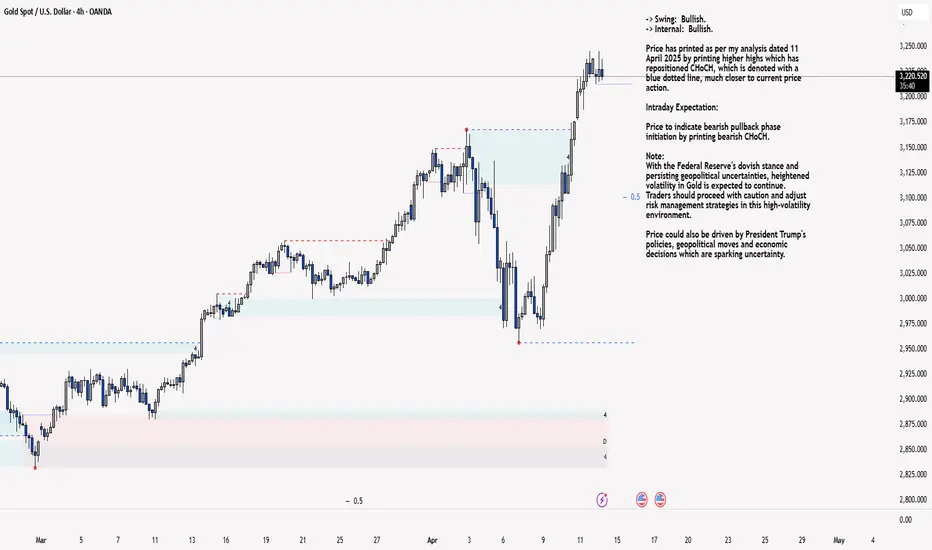
XAU/USD 14 April 2025 Intraday AnalysisH4 Analysis:
-> Swing: Bullish.
-> Internal: Bullish.
Price has printed as per my analysis dated 11 April 2025 by printing higher highs which has repositioned CHoCH, which is denoted with a blue dotted line, much closer to current price action.
Intraday Expectation:
Price to indicate bearish pullback phase initiation by printing bearish CHoCH.
Note:
With the Federal Reserve's dovish stance and persisting geopolitical uncertainties, heightened volatility in Gold is expected to continue. Traders should proceed with caution and adjust risk management strategies in this high-volatility environment.
Price could also be driven by President Trump's policies, geopolitical moves and economic decisions which are sparking uncertainty.
H4 Chart:
M15 Analysis:
-> Swing: Bullish.
-> Internal: Bullish.
As mentioned in previous analysis that I will continue to monitor internal structure following the printing of a bearish CHoCH.
Due to the extreme bullishness of the market I will be mapping internal structure as it appears.
The reasoning behind this due to the fact of the increasing range of the internal structure. By mapping internal structure as it appears we are more likely to be in a good position to have an early warning of all HTF bearish pullback phase initiations.
Price has printed a double bullish iBOS since last analysis and we are now trading within an establish internal range where you will note that price has printed a double top and has been unable to close above weak internal high.
Intraday Expectation:
Technically price should target weak internal high priced at 3,244.340.
Alternative scenario:
Due to the narrowing of internal range, it could be a potential early signal that all HTF's are beginning their bearish pullback phase initiation. I would therefore not be surprised if price printed a bearish iBOS.
Note:
With the Federal Reserve maintaining a dovish stance and ongoing geopolitical tensions, volatility in Gold prices is expected to remain elevated. Traders should exercise caution, adjust risk management strategies, and stay prepared for potential price whipsaws in this high-volatility environment.
Trump's tariff announcement will most likely cause considerably increased volatility and whipsaws.
M15 Chart:
GOLD Price Analysis: Key Insights for Next Week Trading DecisionIn this video, I break down the key forces pushing gold to record highs. Learn how factors such as US-China trade tensions, global inflation pressures, and geopolitical uncertainty—combined with a weakening US Dollar and safe-haven demand—are reshaping the gold market.
In this quick analysis, we cover:
🔹 Inflation & Economic Uncertainty: How rising prices and central bank policies continue to drive interest in gold.
🔹 Trade Tensions & Geopolitical Risks: The impact of US-China disputes and global instability on market sentiment.
🔹 US Dollar Weakness: Why a softer USD is making gold a more attractive asset for international investors.
🔹 Technical Insights: Pinpointing key price levels and exploring potential trend continuations or reversals ahead of US retail sales data.
Disclaimer:
Forex and other market trading involve high risk and may not be for everyone. This content is educational only—not financial advice. Constantly assess your situation and consult a professional before investing. Past performance doesn’t guarantee future results.
#GoldMarketAnalysis #Inflation #TradeTensions #GeopoliticalRisks #TechnicalAnalysis #GoldTrading

XAU/USD(20250414) Today's AnalysisTechnical analysis:
Today's buying and selling boundaries:
3219
Support and resistance levels:
3288
3262
3246
3193
3176
3150
Trading strategy:
If the price breaks through 3246, consider buying, the first target price is 3262
If the price breaks through 3219, consider selling, the first target price is 3193

GOLDFrom this week, we aren't looking for GOLD buys, we need some drop starting this week.
Disclosure: We are part of Trade Nation's Influencer program and receive a monthly fee for using their TradingView charts in our analysis.

GOLD Ready to Break Highs Again! 🔥 3058 Level in Sight – Are You Ready? 🔥
📊 Market is following H4 Structure
📈 H4 BMS & OB in Play – Strong Momentum Building!
For detailed analysis & real-time updates, follow our TradingView page! 📍📩

4.11 Interpretation of gold technical ideas4.11 Interpretation of gold operation ideas: Gold prices rose sharply to a new high. How to trade next?
The daily line closed with a big positive line, and the closing price was far away from the previous high. This is a truly effective breakthrough!
There are two types of breakthroughs: 1. The amplitude and strength of the breakthrough! 2. The closing price after the breakthrough!
At present, the intraday pattern of gold prices is unbalanced. The rise and fall depends entirely on the international situation. The US dollar has fallen below 100 points, which has led to panic selling by investors and a sharp rise in gold prices. Therefore, if the situation eases, we must be wary of a rapid decline in gold prices. After a wave of accelerated rises in the morning, today's main focus is on the trend of the afternoon and US markets.
At present, the price of gold is hovering in the 3210 range. If it falls back, it is expected to rebound in the 3200-3190 range. If the European market breaks through the high for the second time and continues to strengthen during the day, then the US stock market will usher in a bullish opportunity again.
The market is always full of opportunities! The above strategies are for reference only, and personal opinions are for reference only. The specific operation is subject to real-time operation. If you want to obtain core member signals and increase account profits, please contact Ailen❤️❤️❤️

GOLD WEEKLY CHART MID/LONG RANGE ROUTE MAP UPDATEDWeekly GOLD Analysis: 17th February 2025
Hello Traders,
Here’s a weekly chart analysis of GOLD, offering an in-depth look at recent market trends and future outlook. Since October 2023, our consistent tracking has achieved 100% target accuracy, as shown by the Golden Circle markers on the charts. Let’s break down the highlights and what’s next.
Recap of Last Week’s Successes
Weekly Chart Highlights:
* EMA5 crossed and settled above Entry ✅ 2735 reached
* Bullish Target TP1: 2877 ✅ Achieved
* GoldTurn Levels at 2875 activated twice ✅ Reached
What’s Next for GOLD? Bullish or Bearish?
After hitting ENTRY LEVELS at 2735 and TP1 2877, we saw a small close above 2877 last week, leaving 3018 open as a potential target. We mentioned that an EMA5 lock would confirm this movement.
While EMA5 hasn’t locked yet, the close from last week provided a solid push upward, gaining over 500 pips. The long-term gap remains open, with more movement likely after last week’s candle body close.
Key Level: 2735 remains a critical zone.
GoldTurn Levels at 2875 and 2735 are active, and the price may revisit these levels before bouncing back to reach TP1 and beyond.
Recommendations & Strategy:
* Focus on EMA5: Watch its behavior around 2877 for key signals on short- and long-term trades.
* Support Levels: GoldTurn levels at 2875 and 2735 are vital for identifying reversal points and prime dip-buying opportunities.
* FVG Support: A range between 2835 and 2850 is also supportive.
For precise entry and exit points, check our daily, 12H, 4H, and 1H analyses for clearer market guidance.
We’ll continue to provide daily updates, insights, and strategies on our TradingView and YouTube channels every Sunday. Don’t forget to like, comment, and share to support our work and help others benefit!
The Quantum Trading Mastery

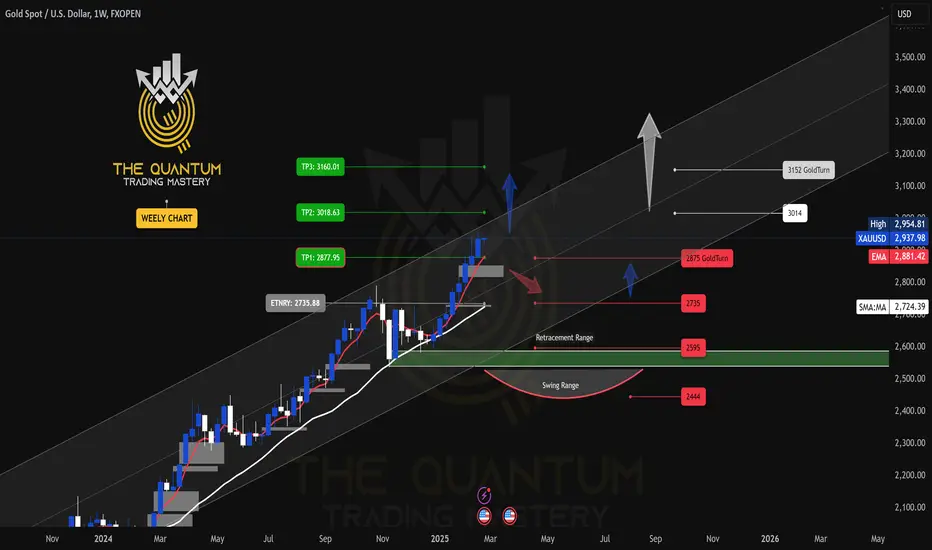
GOLD WEEKLY CHART MID/LONG RANGE ROUTE MAP UPDATEDWeekly GOLD Analysis: 24th February 2025
Hello Traders,
Here’s a weekly chart analysis of GOLD, offering an in-depth look at recent market trends and future outlook. Since October 2023, our consistent tracking has achieved 100% target accuracy, as shown by the Golden Circle markers on the charts. Let’s break down the highlights and what’s next.
Gold reached an all-time high of $2,954.80 last week. As previously noted, close attention to the movement of the 5-day Exponential Moving Average (EMA5) was advised. The anticipated Fair Value Gap (FVG) provided strong support at $2,850, with the EMA5 approaching the first take-profit (TP1) level at $2,877, leading to a bullish surge that touched the all-time high. However, the EMA5 has yet to cross and stabilize above $2,877.
This situation persists, with the EMA5 still not locked above $2,877, which is necessary for further bullish confirmation. If the EMA5 fails to cross and hold above this level, the price may reverse to test the GoldTurn level at $2,875 before potentially bouncing back upward.
The key level at $2,735 remains a critical zone. Active GoldTurn levels at $2,875 and $2,735 suggest that the price may revisit these areas before advancing to TP1 and beyond.
Recommendations & Strategy:
* Focus on EMA5: Watch its behavior around 2877 for key signals on short- and long-term trades.
* Support Levels: GoldTurn levels at 2875 and 2735 are vital for identifying reversal points and prime dip-buying opportunities.
* EMA5 detachment is still due on weekly chart.
For precise entry and exit points, check our daily, 12H, 4H, and 1H analyses for clearer market guidance.
We’ll continue to provide daily updates, insights, and strategies on our TradingView and YouTube channels every Sunday. Don’t forget to like, comment, and share to support our work and help others benefit!
The Quantum Trading Mastery
Gold: Sell@3188-3200Gold has continued its strong rally, hitting a new all-time high, with bullish sentiment running extremely hot.
However, we must approach this rationally — every new high is usually followed by a technical pullback.
Currently, the 3200 level is a significant psychological resistance, as well as a key threshold for short-term bullish momentum.
From a technical perspective, the sharp recent rally has shown signs of momentum exhaustion, with clear overbought signals emerging.
📌 Strategy Suggestion:
Consider building short positions around the 3188–3200 zone
If 3137 is broken, further downside could extend to 3112–3090
⚠️ Risk Management Notes:
The larger the rally, the stronger the pullback potential
Avoid chasing long positions at these levels to prevent getting trapped at the top
Keep position sizes under control and set stop-losses to guard against sudden volatility
Wishing everyone smooth trades and solid profits!

Gold V-shaped reversal breaks through new highs to usher in a buFundamental analysis:
The erratic tariff plans of the US administration have shaken the entire global market, with market participants scrambling for direction and certainty. This is usually supportive for gold, which has risen 18% so far this year. Gold has also been boosted by expectations of further monetary easing by the Federal Reserve and central bank purchases.
Technical interpretation:
From the 4-hour chart, spot gold has completed a typical V-shaped reversal pattern, rebounding strongly after a deep correction. After hitting a low of $2,956.67, gold prices launched a counterattack, breaking through the suppression of multiple moving averages in one fell swoop, and finally stood firm at the key resistance level of $3,100. It is worth noting that gold prices are currently running above the rising trend line, which indicates that the short-term trend has clearly turned bullish.
The MACD indicator shows a strong bullish signal, with the DIFF line and the DEA line forming a golden cross, and the DIFF value is 13.58 and the DEA value is -1.55, indicating that the upward momentum is accumulating at an accelerated rate. At the same time, the MACD bar chart continues to expand, further confirming the strengthening of bullish power.
Although the daily MACD indicator temporarily shows signs of high divergence, the DIFF value is 35.22 and the DEA value is 40.67, but both are at high levels, indicating that the medium- and long-term momentum is still strong. The daily RSI is 62.58, which is in a moderately strong area and does not show obvious overbought. The daily CCI is 74.30, which also shows that the medium-term upward momentum is still continuing.
Analysis of short-term operation ideas:
After the gold price broke through the key resistance of $3,100, the technical side showed a clear trend of strengthening. If it can stand firm at this level, the next target will point to the historical high of $3,167.60, and a new round of upside will be opened after the breakthrough. In terms of support, $3,060.00 (previous breakthrough position) will provide effective support. If it fails, it may pull back to the lower track of the rising channel near $2,968.00. Recent US inflation data and trade situation developments will become key catalysts for short-term trends.

Gold continues to strengthen and fluctuates widely in the short Gold stabilized near the 200-period moving average at the beginning of this week, and the current upward trend is supported by the daily chart oscillator indicators. Both the daily RSI and MACD remain in the bullish range, with obvious momentum;
The upper target is concentrated in the 3167-3168 US dollar line, which is the historical high set at the beginning of this month; if it successfully breaks through this area, the gold price may enter a new upward channel.
In the short term, the support level below $3100 is concentrated in the 3065-3060 US dollar range, and a break below it will open a downward channel to $3000. The $3000 mark coincides with the 200-period moving average of the 4-hour chart, which is the key long-short dividing point;
If it falls below this point, it means that gold has entered the correction stage, and bulls need to remain vigilant; but the current fundamentals and market sentiment still strongly support the gold price to maintain high volatility.

Gold trading ideas April 9th ahead of FOMC MinutesAll entries demand confirmation on M5 or M15;
Snipers don't chase—they wait for the market to come to their scope;
You’re not “late,” you’re loading up for a legendary entry.
🔻 SELL ZONE
📍 3045–3055
🛑 SL: 3065
Why: M15–H1 OB + imbalance fill from previous BOS
Liquidity grab probability during London
🎯 TP1: 3015 | TP2: 2971 | TP3: 2943
🔻 SELL ZONE
📍 3094–3109
🛑 SL: 3122
Why: D1/H4 OB + unmitigated FVG + resting equal highs
Textbook supply raid + swing short
🎯 TP1: 3055 | TP2: 3015 | TP3: 2965
🟢 BUY ZONE
📍 2965–2950
🛑 SL: 2948
Why: H1 demand + FVG + trendline bounce
RSI recovery + bullish CHoCH M15
🎯 TP1: 2990 | TP2: 3022 | TP3: 3044
🟢 BUY ZONE
📍 2922–2904
🛑 SL: 2890
Why: Unmitigated Daily OB + final imbalance
Psychological trap zone if swept
🎯 TP1: 2943 | TP2: 2982 | TP3: 3022
🟢 BUY ZONE
📍 2885–2894
🛑 SL: 2870
Why: Breaker + extreme OB + fib 0.786
Liquidity grab scenario with high RR
🎯 TP1: 2950 | TP2: 3000 | TP3: 3050
📌 Bonus Notes
🔐 Watch 3060–3080 – strong base area.
📌 Important Notice!!!
The above analysis is for educational purposes only and does not constitute financial advice. Always compare with your plan and wait for confirmation before taking action.
📣 If this strategy sparked clarity, hit that like button and follow. 💛

Gold bulls are in the driver's seat, beware of a pullback!Fundamental analysis:
A new round of tariff shocks has become a core factor affecting the trend of gold prices. "The rebound in gold reflects the market's growing concerns about tariff threats and the possible reshaping of global trade norms."
Technical interpretation:
The 4-hour chart shows that gold prices have now formed a clear upward channel, with support and resistance lines connecting lows and highs respectively. Recently, the price came near the MA200 moving average, and at the same time found buying near the key support level of $3015.00. From the MACD indicator, the DIFF line (0.41) and the DEA line (-8.65) have formed a golden cross, and the bar chart has turned red and the volume has increased, suggesting that upward momentum is accumulating. The RSI indicator is at the 60.47 level, close to but not yet in the overbought area, indicating that there is still room for upward movement. The CCI indicator is at 150.94. Although it is in the overbought area, the trend is strong and no obvious top divergence has yet to appear. It is worth noting that the recent price has not fallen below the lower track of the rising channel during the decline, indicating that bulls are still dominant.
Operational analysis:
The gold price is currently at a key technical position and has just retested the support level near MA55. If it can stand firm at this position, it is expected to retest the resistance level of $3090.00, and further breakthroughs may challenge the previous high of $3167.60. The short-term MACD golden cross signal strengthens the bullish expectations, but if the support of $3015.00 cannot be maintained, it may fall back to $2980.00. The lower track of the rising channel will be the key line of defense for the long-short boundary.

Technical analysis of short-term operations in the US market on 4,9 US trading operation interpretation ideas:
Today, there was a bottoming out and rebound. In the morning, it first went south and then north. It fell sharply to 2970 and then quickly counterattacked 3000 after entering the Asian session! I emphasized in the morning that the gold short may be coming to an end! It will enter a short-term sharp decline and then rebound! But the current trend is obvious that today's increase has exceeded expectations!
We must beware of the possibility of a V-reversal in the US market! Although the large-scale purchase of gold caused by the selling of US bonds is still difficult to confirm the long position in the US market!
The intraday increase is close to 90 points! There may be two emotions.
1: The market impact after the tariffs are implemented has not been eliminated
2: If the bullish trend continues in the US market, it may retreat to around 3045 in the future, and continue to be bullish later!
Short-term support: 3045---3030----3000
Pressure level: 3075---3080---3100---3135
