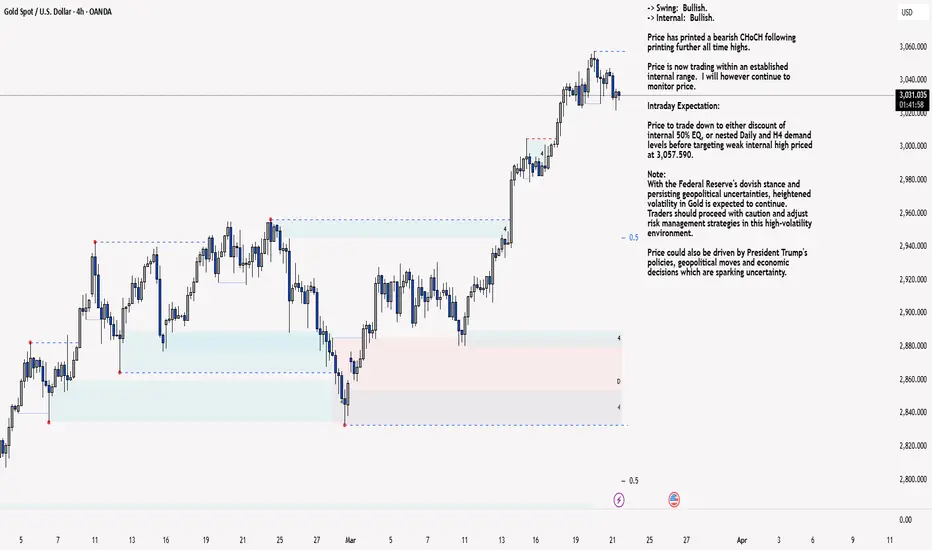
XAU/USD 21 March 2025 Intraday AnalysisH4 Analysis:
-> Swing: Bullish.
-> Internal: Bullish.
Price has printed a bearish CHoCH following printing further all time highs.
Price is now trading within an established internal range. I will however continue to monitor price.
Intraday Expectation:
Price to trade down to either discount of internal 50% EQ, or nested Daily and H4 demand levels before targeting weak internal high priced at 3,057.590.
Note:
With the Federal Reserve's dovish stance and persisting geopolitical uncertainties, heightened volatility in Gold is expected to continue. Traders should proceed with caution and adjust risk management strategies in this high-volatility environment.
Price could also be driven by President Trump's policies, geopolitical moves and economic decisions which are sparking uncertainty.
H4 Chart:
M15 Analysis:
-> Swing: Bullish.
-> Internal: Bullish.
You will note how price has mitigated M15 demand zones at the extreme of strong internal low. The remainder of my analysis and bias remains the same as analysis dated 19 March 2025.
Price has continued to surge to new all time highs, largely fuelled by geopolitical tensions, gold is solidifying itself as a safe haven asset.
Price has printed a further bullish iBOS followed by a bearish CHoCH to confirm internal structure.
Intraday Expectation:
Price has mitigated M15 demand zone. Technically price should target weak internal high priced at 3,057.590.
Alternative scenario:
You will note internal range has significantly narrowed. All HTF's require a pullback, therefore, it would be completely viable if price printed a bearish iBOS.
Note:
With the Federal Reserve maintaining a dovish stance and ongoing geopolitical tensions, volatility in Gold prices is expected to remain elevated. Traders should exercise caution, adjust risk management strategies, and stay prepared for potential price whipsaws in this high-volatility environment.
M15 Chart:
Goldintraday
MCX Gold intraday trend forecast for March 21, 2025I have a bearish outlook for the day. The first phase is bearish and then a pull back is likely to take place. This is my mathematically derived outcome. Use your technical analysis and trade with Stop-Loss.

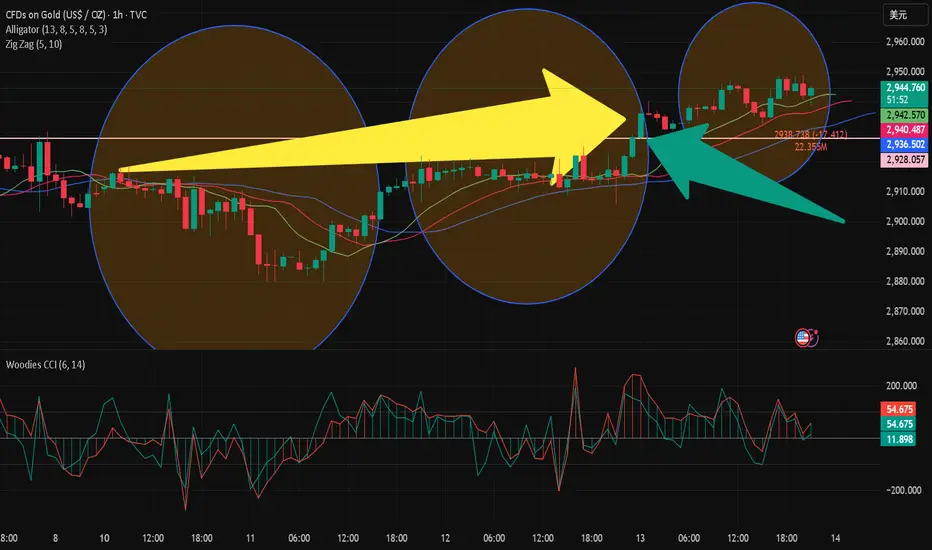
GOLD (XAU/USD) H1 Trading Plan📉 GOLD (XAU/USD) H1 Trading Plan 📉
🔹 Wait for Sell-Side Liquidity Break! 🏦💧
Gold is currently testing key liquidity zones. Before entering a trade, we must wait for a sell-side liquidity grab (sweep of lows). Once liquidity is taken, shift to a lower time frame (M5/M15) for confirmation before executing a position.
✅ Trading Steps:
1️⃣ Identify sell-side liquidity zones (equal lows, swing lows).
2️⃣ Wait for a break below liquidity to confirm stop-hunt.
3️⃣ Look for bullish confirmation on LTF (Break of Structure, order block, or engulfing candle).
4️⃣ Enter with tight stop-loss & proper risk management.

3.21 Gold Short-term Analysis and Operation SuggestionsGold hit a record high on Thursday (March 20) after the Federal Reserve hinted that it might cut interest rates twice this year, further enhancing the attractiveness of gold amid the current geopolitical and economic tensions. As of press time, spot gold was basically stable near $3,030, having hit a record high of $3,057.21.
——Gold Technical Analysis
From the daily chart, the volume indicator is firmly aiming higher, supporting another wave of gains, while the relative strength index (RSI) is stable near 72. At the same time, the price of gold is trading above all its moving averages, with the 20-day simple moving average (SMA) providing dynamic support near 2,936. From the 4-hour chart, technical indicators have eased from extreme levels, but are far from indicating an imminent downtrend. In addition, the 20-period SMA continues to rise steadily, currently around 3,011, while well above the longer-term moving average. Overall, Zhang Jinglin recommends rebounding and shorting as the main operation of gold today!
Gold short-term operation strategy:
SELL: 45 Stop loss 55
TP1:35
TP2:25
TP3:10

3.20 Technical Analysis of Gold Short-term OperationsOn Wednesday, gold maintained a bullish trend! In yesterday's trading:
1: Following the trend principle, the support is stuck at 3020, but the amplitude of the retracement is not given to the retracement near 3020, the lowest is the range of 3022-3025.
2: For short orders, avoid short orders directly; because there is no price reference for short orders, no indicator reference for short orders, therefore, avoid all of them;
3: In terms of trend, at the current stage, the bullish trend is still continuing, therefore, do not catch the top, do not think about catching a large-scale short order, it is not realistic for the time being!
In today's market:
1: 4 hours, the stochastic indicator is in a golden cross state, the main long signal; MACD double lines are glued together, and the state of passivation divergence! These signals suggest that the market is mainly controlled by bulls during the day, and it is difficult to fall sharply for the time being; in terms of form, the continuous positive rise and the broken positive oscillation form, the short-term support position is near 3040; the high point is unknown;
2: In the daily K, the stochastic indicator continues to form a golden cross, which is a bullish signal; in terms of form, the continuous positive rise is the main trend, and the short-term support position today is near 3040;
To sum up: today's short-term trend thinking; the support positions are near 3040, near 3020; near 3000, followed by around 2990; near the support, the trend thinking;

XAU/USD 20 March 2025 Intraday AnalysisH4 Analysis:
-> Swing: Bullish.
-> Internal: Bullish.
Price has very nearly printed a bearish CHoCH following printing further all time highs.
CHoCH positioning is very near current price.
Remainder of my analysis remains the same as yesterday's analysis dated 19 March 2025
Price has printed a bullish iBOS, however, I will apply discretion and not classify as a bullish iBOS due to very insignificant pullback which would distort internal range. Therefore, I have marked the iBOS in red.
Intraday Expectation:
Await for price to indicate pullback phase initiation by printing bearish CHoCH. ChOCH positioning is denoted with a blue dotted line.
Note:
With the Federal Reserve's dovish stance and persisting geopolitical uncertainties, heightened volatility in Gold is expected to continue. Traders should proceed with caution and adjust risk management strategies in this high-volatility environment.
Price could also be driven by President Trump's policies, geopolitical tensions and economic decisions which are sparking uncertainty.
H4 Chart:
M15 Analysis:
-> Swing: Bullish.
-> Internal: Bullish.
Again, since yesterday's analysis, price has continued to surge to new all time highs, largely fuelled by geopolitical tensions. Gold is solidifying itself as a safe haven asset.
Price has printed a further bullish iBOS followed by a bearish CHoCH to confirm internal structure.
Intraday Expectation:
Price has mitigated M15 demand zone. Technically price should target weak internal high priced at 3,057.590.
Alternative scenario:
You will note internal range has significantly narrowed. All HTF's require a pullback, therefore, it would be completely viable if price printed a bearish iBOS.
Note:
With the Federal Reserve maintaining a dovish stance and ongoing geopolitical tensions, volatility in Gold prices is expected to remain elevated. Traders should exercise caution, adjust risk management strategies, and stay prepared for potential price whipsaws in this high-volatility environment.
M15 Chart:

3.20 Focus on the long and short battle of the Federal Reserve!!On Wednesday (March 19), the spot gold price continued to fluctuate at a high level during the Asian and European sessions, hitting a record high of $3,045/ounce during the session, and then fell slightly to around $3,029. The market focus is highly concentrated on the upcoming Fed's March interest rate decision.
Fundamentals: 1. The struggle between risk aversion demand and policy expectations
2. Rising geopolitical risk premiums
3. Trump's tariff remarks sparked concerns about economic recession
4. Fed policy expectations dominate short-term fluctuations
Technical aspects: Long and short game in high-level fluctuations
4-hour structure chart:
Bollinger Band pattern: upper track 3044.86, middle track 3031.24, lower track 3017.63, the current quote 3030.49 is close to the middle track, indicating a short-term balance of long and short forces. If the price stands firm on the middle track, it is expected to test the upper track (3044) again; if it falls below the middle track, it may seek support from the lower track (3017)
Moving average support: The 100-day moving average (2928.75) and the 200-day moving average (2903.27) form a long-term support band, and the price difference with the current quotation exceeds US$100, further verifying that gold is in a strong cycle.
Resistance level: 3050 3080 3100
Support level: 3018 3000 2980

XAU/USD 19 March 2025 Intraday Analysis H4 Analysis:
-> Swing: Bullish.
-> Internal: Bullish.
Price has now printed a bearish CHoCH confirming internal range, however, I will continue to monitor.
Intraday Expectation:
Price to trade down to either discount of internal 50% EQ or nested Daily and H4 demand zones before targeting weak internal high priced at 3,045.310.
Note:
With the Federal Reserve's dovish stance and persisting geopolitical uncertainties, heightened volatility in Gold is expected to continue. Traders should proceed with caution and adjust risk management strategies in this high-volatility environment.
Price could also be driven by President Trump's policies, geopolitical moves and economic decisions which are sparking uncertainty.
H4 Chart:
M15 Analysis:
-> Swing: Bullish.
-> Internal: Bullish.
Again, since yesterday's analysis, price has continued to surge to new all time highs, largely fuelled by geopolitical tensions. Gold is solidifying itself as a safe haven asset.
Price has printed a further bullish iBOS followed by a bearish CHoCH to confirm internal structure.
Intraday Expectation:
Price has traded down to discount of 50% internal EQ and nearly mitigated M15 demand zone. Technically price should target weak internal high priced at 3,045.410.
Alternative scenario:
You will note internal range has significantly narrowed. All HTF's require a pullback, therefore, it would be completely viable if price printed a bearish iBOS.
Note:
With the Federal Reserve maintaining a dovish stance and ongoing geopolitical tensions, volatility in Gold prices is expected to remain elevated. Traders should exercise caution, adjust risk management strategies, and stay prepared for potential price whipsaws in this high-volatility environment.
M15 Chart:

3.19 Gold continues to peak, waiting for the Fed's interest rateThe gold market continued to rise strongly after opening yesterday, reaching the highest point of 3038 and then consolidating at a high level, with no obvious adjustment in the middle. Although we determined that the market would surge, it was still stronger than expected. The daily line finally closed with a big positive line with a slight shadow line. After this pattern ended, the bulls in today's market are still there.
Resistance level: 3045 3050

On 3.19, gold continued to fluctuate upward after breaking throuAs a safe-haven asset, gold has attracted more buying amid global political tensions: the escalation of the conflict in the Middle East and the continued strikes by the United States against the Houthi armed forces in the Red Sea region may affect the energy supply chain. The uncertainty of the ceasefire negotiations between Russia and Ukraine has led to a high risk aversion in the market. The increase in domestic political risks in the United States may affect market confidence and push up gold demand.
The rise in gold on March 18 is in line with my thinking. Obviously, the US market was suppressed at 3028. After a short-term retracement, it further broke upward. It is expected to continue the upward trend at night and see the suppression of 3044.
The weekly and monthly lines are concerned about the upper track position, and even diverge upward under the impetus of market sentiment. The specific position cannot be determined because there is no reference point, but it is only necessary to follow the market trend to do it, and the transaction is relatively simple. From a technical perspective, the upper track of the weekly line is 3030, and the upper track of the monthly line is 3050. This is the position that needs attention. In addition, the previous two waves of rises have gone through 4 positive monthly K lines, and then closed with a negative correction.
Support level
$2994; $2982; $2950
Resistance level
$3025; $3050; $3080

3.18 Risk aversion and expectations of rate cuts support gold toIntraday data analysis:
Gold hit a new record high and maintained an upward trend. For the support below, pay attention to the upper rail of the 4-hour Bollinger band at $3010, followed by the integer position of $3000, which is also near the high point of gold prices on Monday; for the pressure above, pay attention to the upper rail of the weekly Bollinger band at $3028, which is also the upper rail position of the current 4-hour Bollinger band. If the gold price continues to break upward, the upper space can pay attention to the upper rail of the monthly Bollinger band at $2950. The 5-day moving average and the MACD indicator cross upward, and the KDJ and RSI indicators cross upward. The short-term technical side is bullish.
Gold intraday reference: Supported by risk aversion expectations and interest rate cut expectations, gold maintains an upward trend and gold prices hit a new record high. In terms of operation, it is recommended to treat it with a volatile mindset. Pay attention to the support below at $3010, followed by $3000. Pay attention to the breakthrough near $3028 for the pressure above. If it stands firm here, you can continue to pay attention to $3050.

3.18 Gold Refreshes $3,000, Be Cautious About Backtesting RisksIn 4 hours, the main trend is continuous rising and breaking rising; the main trend is anti-falling; in terms of indicators, the stochastic indicator crosses downward, mainly empty, but the pattern is anti-falling. At the same time, the MACD double lines are glued together, without crosses. Therefore, the cross of the stochastic indicator is just a correction method for 4 hours to change time for space; the horizontal support position is at the support position of 2980 and 2955.
Short-term operation: SELL: 3000
TP1: 2990
TP2: 2980
TP3: 2970
As usual, we will update regularly throughout the day and tell you how we manage active ideas and settings. Thank you for your likes, comments and attention, we are very grateful!

3.17 Technical Analysis of Gold Short-term OperationsIn the early Asian session on Monday (March 17), spot gold fluctuated at a high level and is currently trading at $2,990.02/oz. Spot gold once broke through the important $3,000 mark during trading last Friday, reaching a high of $3,004.82/oz, setting a new historical high. Investors chased this historic surge in safe-haven assets, seeking to avoid the economic uncertainty caused by US President Trump's tariff war, and then fell slightly due to profit-taking, closing at $2,988.12/oz.
Analysis of intraday gold short-term operations:
Gold is still in a three-month upward channel, and the relative strength index (RSI) on the daily chart remains around 70, indicating that the bullish tendency is still intact.
Once the gold price stabilizes above $3,000/oz (integer level, midpoint of the ascending channel) and confirms that this level is support, then $3,060/oz (upper limit of the ascending channel) may be set as the next bullish target, and the next bullish target is $3,100/oz (integer level).
On the other hand, if gold fails to turn $3,000/oz into support, technical buyers may be frustrated. In this case, $2,920/oz (20-day simple moving average, lower limit of the ascending channel) and $2,900/oz (round level, static level) may be seen as the next support level for gold
Resistance: 2998 3010 3020
Support: 2980 2965 2950

Gold Market Forecast: Next Week’s Trading Setup & Key Price ZoneGold remains range-bound near record highs, with bullish potential as traders eye the Fed’s next move. Concerns over U.S. tariffs driving inflation, ongoing geopolitical tensions, and China’s rising gold reserves add to market uncertainty.
In this video, I break down the key technical level, market sentiment, and my personal strategy for positioning ahead of next week’s price action.
🔔 Don’t forget to like, subscribe, and hit the notification bell for more market insights!
#GoldPrice #XAUUSD #GoldForecast #GoldTrading #ForexAnalysis #MarketNews #FederalReserve #InterestRates #SafeHaven #Geopolitics #TradingStrategy
Disclaimer:
Forex and other market trading involve high risk and may not be for everyone. This content is educational only—not financial advice. Always assess your situation and consult a professional before investing. Past performance doesn’t guarantee future results.

3.17 Gold short-term may extend low and longLast week, the gold market opened at 2912.9 at the beginning of the week, and then fell back at the beginning of the week. After the weekly low reached 2880, the market rose strongly due to risk aversion. After breaking the previous historical high of 2957, the market accelerated upward. On Friday, the weekly high reached 3005.2, and then the market consolidated. The weekly line finally closed at 2986.1, and the market closed with a big positive line with a lower shadow slightly longer than the upper shadow. After this pattern ended, the market continued to look at the bullish demand point after the adjustment at the beginning of the week. After the breakout of 2940 and 2958 last week, the stop loss was followed up at 2956.
Short-term operation suggestions:
SELL: 2995 target 2980 70 stop loss 10

Gold swing trade week 16/03/25Last week he had a trade from 2880 that ran for 1244 pips congragulations if you took it.
This week we are looking for a sell then leading into a buy at previous resistance.
Current Price Action:
Gold is trading near $2,984, slightly rejecting resistance.
The price is respecting the ascending channel with higher highs and higher lows.
Support & Resistance Levels:
Immediate Resistance: Around $2,998 - $3,000, psychological and technical resistance.
Key Support: 2,961 - $2,965 (potential buy zone).
Next Major Resistance: 3,021 - 3,030 (Fibonacci extension + trendline target).
Fibonacci Levels:
The 0.618 Fibonacci retracement around 2,964 aligns with a potential buy entry.
The 0.382 retracement at 2,996 acts as immediate resistance.
Trendlines & Channel:
Price is respecting the bullish channel.
A break above 3,000 could push XAU/USD toward 3,021 - 3,050.
If price breaks below 2,961, a retracement to 2,930 - 2,900 is possible.
Moving Averages:
Short-term EMA (White) is above the Green MA, signaling continued bullishness.
If the price holds above 2,965, bulls remain in control.

Gold weekly chart with buy and sell levels 15/03/25Gold has achieved new all-time highs this week, breaking the 3000 level before retreating to 2982. As we look ahead to the coming week, I've outlined key buy and sell levels on this 4-hour Gold chart, along with potential entries.
For a buy, consider entering at 2988, targeting 2990 as the first resistance. If this level is surpassed, the next resistance range could be around 3000 to 3005. It's important to follow the chart levels closely and secure profits along the way.
For a sell, an entry at 2977 could aim for a move down to 2970, with subsequent targets around 2962 to 2960 as resistance levels. Stick to the marked entries on the chart for better clarity and control.
As always use proper risk management , take profit along the way and dont overleverage

XAU/USD 14 March 2025 Intraday AnalysisH4 Analysis:
-> Swing: Bullish.
-> Internal: Bearish.
Previous analysis was not met as price printed a bullish iBOS. Support in the rise of price is largely due to the trump trade and tariff war which is causing market jitters.
Intraday Expectation:
Price to indicate bearish pullback phase initiation by printing bearish CHoCH. Bearish CHoCH positioning is denoted with a blue dotted line.
Note:
With the Federal Reserve's dovish stance and persisting geopolitical uncertainties, heightened volatility in Gold is expected to continue. Traders should proceed with caution and adjust risk management strategies in this high-volatility environment.
Price could also be driven by President Trump's policies, geopolitical moves and economic decisions which are sparking uncertainty.
H4 Chart:
M15 Analysis:
-> Swing: Bullish.
-> Internal: Bullish.
Price has further printed a bullish BOS. Remainder of analysis and bias remains the same as yesterday's analysis dated 13 March 2025
Analysis and bias has not been met, largely due macroeconomic events, particularly the Trump trade tariff war, which is causing uncertainty within the markets which is supporting Gold price.
Price has printed a bullish iBOS.
Within the structure following the iBOS, price has printed a several bearish CHoCH's with very minimal pullbacks before continuing bullish.
In order not to distort internal structure range I will apply discretion and not classify bearish CHoCH without considerable pullback.
Intraday Expectation:
Await for price to print Bearish CHoCH which is supported by a pullback relative to recent price action.
Note:
With the Federal Reserve maintaining a dovish stance and ongoing geopolitical tensions, volatility in Gold prices is expected to remain elevated. Traders should exercise caution, adjust risk management strategies, and stay prepared for potential price whipsaws in this high-volatility environment.
M15 Chart:

3.14 Gold breaks through historical high to 3000Yesterday, the gold market continued the risk-averse rally and broke through the historical high. After opening at 2933.4 in the morning, the market first rose to 2947.4 and then fell back. The daily line reached a low of 2932.4 and then rose strongly. After breaking through the previous historical high of 2957 during the US trading session, the market accelerated upward. The daily line reached a high of 2989.3 and then the market consolidated. The daily line finally closed at 2988.8 and the market closed with a basically saturated big positive line. After this pattern ended, the weekly line completed the N-shaped break. Today's market reached the 3000 mark and quickly pulled back to 2988 and then came to 2997.
Short-term recommended operations:
Resistance level: 3000 3010 3020
Support level: 2995 2985 2970

3.14 Risk aversion and interest rate cuts have pushed gold to thGold is supported by risk aversion and interest rate cut expectations, and the overall trend remains upward. Short-term technical aspects also show that the advantages of the bulls have been strengthened.
On the daily chart, gold has set a new record high and performed very strongly. For the support below gold, radicals pay attention to the upper rail position of the daily and weekly Bollinger bands at $2,983, which is also the low point of the gold price falling back in the morning. Secondly, the low point of the fall after the intraday high in the US market on Thursday was $2,976. The continued fall suggests that the gold price has the risk of adjustment. Pay attention to the previous historical high of $2,956; for the pressure above gold, pay attention to the breakthrough of the integer position of $3,000. If it breaks through and stands firm here, it will not guess the top. The 5-day moving average is golden cross upward, the KDJ and RSI indicators are golden cross upward, and the MACD indicator forms a dead cross, indicating that the advantages of the bulls in the short-term technical aspect are further strengthened.
Resistance points: 2,990, 3,000, 3,010
Support points: 80, 70, 56

3.14 Gold peaks againGold is forming higher highs while forming an ascending triangle, which will be confirmed if the price of gold closes above the record high of $2,982/oz on a daily basis. If the price of gold breaks the record high, then the price of gold will target the round mark of $2,990/oz. If the buyers conquer the latter, a test of the psychological barrier of $3,000/oz will be inevitable.
The 14-day relative strength index (RSI) is moving higher above 50, supporting the case for further upside in gold prices.
On the other hand, the price of gold has strong support at the 21-day simple moving average (SMA) of $2,914/oz. If the selling pressure intensifies, the price of gold will challenge the ascending trendline support of $2,893/oz. Failure to defend this level will accelerate the decline towards the psychological level of $2,850/oz.
Resistance 2980 2990 3000
Support 2950 2930 2900
As always, we will be updating regularly throughout the day and letting you know how we are managing active ideas and settings. Thank you all for your likes, comments, and attention, we really appreciate it!

GOLD(UPDATE)Hello friends
Considering that we are at a price ceiling and the power of buyers has decreased and we are witnessing the formation of lower ceilings, we can enter a sell transaction if the resistance level is not broken, of course with capital and risk management.
This analysis is reviewed only from a technical perspective.
*Trade safely with us*

3.13 Technical analysis of gold short-term operationGold market analysis:
, Gold hourly level: In the morning, it rose from 2932 to 2946, and fell back to 2932 from 2946 in the afternoon. It rose from 2932 to 2948 in the European session. From the trend of the Asian and European sessions, it can be seen that it may enter a certain range of back and forth consolidation; combined with the trend of the bottom of 2880 rising to 2948, it can be found that there is a similar pattern in early March. After a short-term continuous rise, it will enter the box oscillation for several hours, and then continue to rise in a short-term continuous rise, and then continue to enter the box oscillation; then combined with the yellow channel in the above figure, pay attention to the pressure of the upper rail 2951-53 tonight. If it is suppressed, it may fall back to 2932-30 repeatedly. The lower rail support is an ideal bullish point. It will move up to 2923-25 tonight, which is also the top and bottom conversion position. If it can be touched, it is necessary to continue to follow the bullish
Resistance point l: 2945 2955 2970
Support level: 2935 2920 2900
Traders, if you like this idea or you have your own opinion about it, please write it in the comments. I will be happy