GoldXAUUSD
- Completed " 123 " Impulsive Waves
- Break of Structure
- RSI - Divergence
- Bullish Channel as an corrective pattern in Short Time Frame
- Change of Characteristics
Goldking

GoldXAUUSD
- Order Block
- Bullish Channel as an corrective pattern in Short Time Frame
- Break of Structure
- Completed " 1234 " Impulsive Waves
- Fair Value Gap

GoldXAUUSD
- Rising Wedge as an corrective pattern in Short Time Frame
- Break of Structure
- Consolidation Phase
- Completed " 12345 " Impulsive Waves and " AB " Corrective Waves
- RSI - Divergence

GoldXAUUSD
- Completed " 12345 " Impulsive Waves
- Consolidation Phase in Long Time Frame
- RSI - Divergence
- Bullish Channel as an corrective pattern in Short Time Frame
- S / R Level

GoldXAUUSD
- Fibonacci Level - 361.80%
- Fair Value Gap
- Completed " 123 " Impulsive Waves
- Break of Structure
- Symmetrical Triangle as an corrective pattern in Long Time Frame

GoldXAUUSD
- Completed " 12345 " Impulsive Waves and " ABC " Corrective Waves
- Change of Characteristics
- Break of Structure
- Consolidation Phase as an corrective pattern in Short Time Frame
- Order Block

GoldXAUUSD
- Completed " 1234 " Impulsive Waves
- Break of Structure
- RSI - Divergence
- Change of Characteristics
- Fibonacci Level - 38.20% / 50.00%

GoldXAUUSD
- Consolidation Phase in Long Time Frame
- Impulse Correction
- Completed " 12345 " Impulsive Waves and " AB " Corrective Waves
- Break of Structure
- Bullish Channel as an correction in Short Time Frame

Accurate sniping, gold is shorted all the way.Who else has continuously arranged short orders from above 4050 and gone down all the way. Before the market closed yesterday, we arranged in advance at 3990 and accurately set a limit short order. During the opening rebound, gold only touched 3994. After perfectly activating the limit short order, it quickly fell and hit the target near 3970 in one fell swoop, with a steady profit of 200pips on a single transaction. This wave of operations is not only a manifestation of technology, but also a perfect combination of rhythm and plan execution. It once again verifies our core concept of planned trading and strict risk control, precise analysis, advance layout, and steady cashing. Looking back at the entire market, since above 4050, we have clearly stated that there is a risk of periodic correction in gold, and have repeatedly suggested the idea of shorting on the rebound. Facts have proved that planning in advance and decisive execution are better than chasing ups and downs afterwards. The rhythm of this round of decline is clear, and the short-selling-dominated pattern is obvious. We decisively enter the market in the key interval. Every high-level short order is fast, accurate, and ruthless, and we win in a steady manner.
From a technical perspective, gold completed a structural breakdown at the 4000 mark. Short-term support is focused on the 3945-3940 area. If it continues to break down, it will open up downward space to the 3920 line. The upper pressure is focused on the 4000-4015 area. Rebound pressure is still the focus of shorting at rallies. The overall rhythm is still bearish, and short-term operations are mainly based on rebound shorting.
The market never waits for anyone. Profits belong to traders who have plans and execution capabilities. Congratulations to all my friends who are paying attention. Once again, I have steadily realized profits. Strength is not something that can be expressed with words, but is the result of precise implementation of each order. Next, I will continue to track the gold fluctuation structure and lead everyone to steadily grasp the next key market opportunity.

The golden rhythm is in your hands!Today's gold trend once again perfectly verifies our strategic predictions. The market has entered the stage of falling under high pressure as expected. We have been shorting from above 4050 to the bottom. The rhythm is clear and the execution is in place. It can be said to be another god-level operation, with stability and precision coexisting. The value of planned trading is once again reflected. It is not a blind prediction, but a steady progress based on structure, rhythm and logic. Congratulations to my friends who are paying attention.
From the current gold trend analysis, although it rebounded to above 4050 during the US trading phase, it can be clearly seen from the 4-hour chart structure that the gold price entity still closed below 4045. This is also the main reason why I asked my brothers to arrange short positions in advance. 4045 is still an important suppression position at the stage, and the 4000 mark below is still a key support position. Once this mark is held, gold will most likely remain in the 4050-4000 range of shock and consolidation. On the contrary, if it falls below 4000 again, the downward space is expected to extend to around 3985-3980. On the contrary, if the market stabilizes without breaking 4000 and successfully breaks through and stands firmly above 4050, the emergence of a new high is only a matter of time. Therefore, the current core observation range is within the 4000-4050 area. Before the breakthrough, it is recommended to maintain the strategy of selling high and buying low. Once the price effectively breaks through the boundary of either side, following the trend is the best strategic direction.

Gold accurately grasps the rhythm!Yesterday, a historic breakthrough took place, with gold prices exceeding $4,000 per ounce for the first time and surging to around $4,060 at one point, while also driving silver prices to a record closing high. This strong rally was mainly driven by market risk-averse buying triggered by escalating geopolitical tensions. However, the market took a significant turn on Thursday, with Hamas and Israel suddenly reaching a ceasefire agreement in the Middle East, and market risk aversion quickly cooled, causing gold prices to fall from their highs. This dramatic "roller coaster" market clearly shows that the core logic currently dominating the gold market is still the change in geopolitical risk preferences, and its volatility has therefore been sharply amplified, sounding the alarm for the market.
From a technical perspective, after hitting a high near $4,060, gold prices retreated to key support near $4,000 in late New York trading, perfectly exemplifying the "buy bulls, don't chase the gains; reposition upon a pullback to key support" trading strategy. Currently, the $4,000 mark has become a key dividing line between bulls and bears in the near term. From an operational perspective, we recommend maintaining a medium- to long-term bullish approach, but emphasize entry timing and risk management. Specifically, we should consider the $4,000 level as a key defensive level, patiently awaiting dips and long opportunities after a pullback and stabilization. The initial upside target is the previous high near $4,060. If gold can successfully break through and hold this resistance area, it will open up further upside potential, potentially challenging $4,100 or even higher. Conversely, if repeated attempts to reach $4,060 fail, short-term bulls should appropriately take profits and exit positions, wary of the risk of price consolidation at high levels or a deeper technical correction.

How to correctly grasp the gold trading opportunitiesGold is still maintaining a bullish rhythm, the daily structure is stable, and the bullish trend has not been destroyed. Although it is slightly tired after the continuous rise, there is no obvious peaking signal yet. The hourly chart is still an oscillating upward structure. There is buying every time it falls back, indicating that the bullish force in the market is still dominant. From the four-hour cycle, the moving average system maintains a bullish arrangement, and the price runs above the moving average of each cycle. Although the RSI has entered the overbought range and there is a need for a short-term correction, the overall trend is still strong. The upper 4050-4060 area is the key pressure zone. If it can effectively break through and stand firm, the upper space will be further opened. We recommend that you continue to prioritize buying on pullbacks. Short-term support is in the 4020-4010 area, with stronger defense near the 4000 mark. As long as it stabilizes, there is still an opportunity for bulls. However, we should also be aware that after the continuous rise in gold, there is a possibility of a short-term correction. Aggressive investors can continue to consider shorting with a light position near 4060, with the initial target of 4030-4020-4010. Be sure to control risks, and shorting is only a supplementary strategy. Next, focus on US fiscal dynamics and Federal Reserve policy signals. These news factors will directly affect the short-term fluctuation rhythm of gold. Conservative investors should wait for support confirmation before entering the market, while aggressive investors should gamble with a light position and respond flexibly.

Golden opportunity has arrivedGold has continued its strong upward momentum since breaking through the 4000 mark, reaching a high of around 4049. The market has hardly made any decent corrections, market sentiment has continued to be high, and bullish confidence has been infinitely magnified. However, the more emotional the stage is, the more we need to remain calm and rational. Structurally, gold has entered the end of an accelerated upward trend, and short-term indicators are obviously overbought. Although prices have hit new highs, momentum has not increased simultaneously, and there are signs of slight divergence, indicating that the upper space is gradually narrowing. Combined with the 4-hour structure, the 4050-4060 area is a period of strong pressure, and it may face a technical correction in the short term. In terms of operational thinking, you can consider shorting with a light position in the 4050-4060 area, and first target the 4020-4000 area. Conservative people can wait for the confirmation of the pullback before participating, and do not blindly chase the long position. Although gold is strong at present, it is not a mindless rise stage. The larger the bullish space, the deeper the adjustment will often be. At this time, risk control should be the core and planning should be the basis. Short-term short positions should only participate in structural corrections, and should not make impulsive trades that blindly fight against the trend. Steady execution, position control, and maintaining rhythm are the key to remaining invincible in extreme markets.If your recent operations are not ideal, or you are confused about how to grasp the rhythm, you are welcome to communicate with me at any time. I hope I can help you avoid detours and steadily improve your trading thinking and execution.

When the market is crazy, staying calm is the biggest advantage!Since the US government shutdown, the gold market has completely lost its disguise and continues to rise without any decent technical pullback. The current market sentiment is high and the bulls are fully dominant. Even the 4,000 mark has failed to form an effective suppression. In the short term, if we want to see a significant correction, we can only hope that the US government will resume operations. Otherwise, the gold price may still maintain a strong upward rhythm. The current upward momentum even exceeds the market intensity in some war stages. From a technical perspective, in the short term, pay attention to the pressure of 4030 and 4050 levels. If there are signs of resistance to rising, try short-selling with a light position, strictly control risks, and flexibly stop profit; the support below focuses on the 4000-3990 area. Once it stabilizes effectively, it is still expected to continue to rise. Today's market has long broken the inherent thinking of not chasing ups and downs in the past. Gold has entered a new cycle of letting itself go. The new gold era is strong and not afraid of highs. Brothers who are uncertain can communicate with me at any time, and I will give strategic guidance at the bottom as soon as possible.

How to seize the certain opportunities in the gold market?Yesterday, gold continued its record-breaking rally, achieving its sixth consecutive week of gains and further entering an unknown price range. The core driving force behind this round of gains lies in the market's continued rise in dovish expectations for the Federal Reserve to further implement loose policies before the end of the year. Although the 25 basis point interest rate cut last week has been digested by the market, investors are increasingly expecting two more interest rate cuts in October and December, providing strong support for gold prices. In addition, ongoing geopolitical tensions, increased gold holdings by various countries and strong inflows of funds into gold ETFs have together constituted the multiple pillars of this bull market. Under the interweaving of risk aversion and loose expectations, gold has risen by more than 40% this year, highlighting its strong appeal.
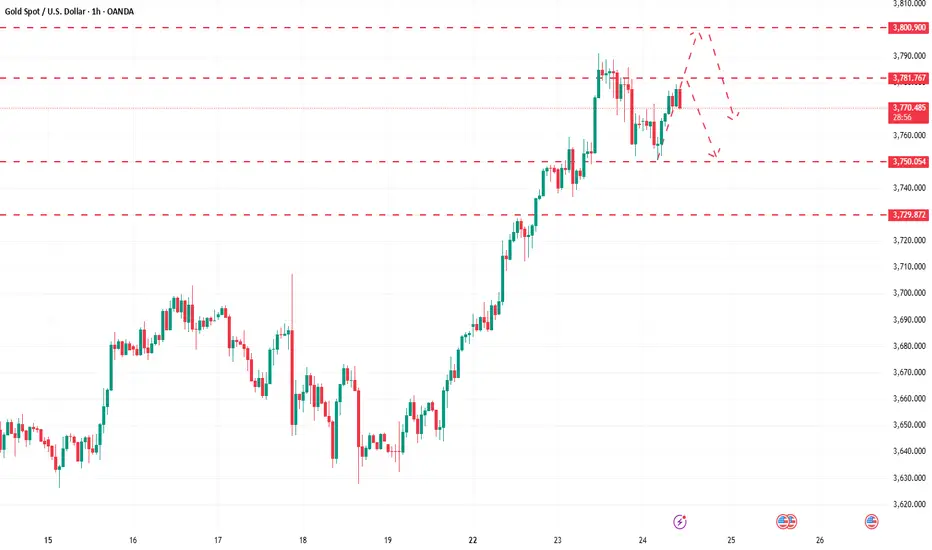
From a technical perspective, the daily chart shows that gold prices closed with a large real body positive line, and the trend is extremely strong. The MACD indicator double lines sent a golden cross signal, confirming the short-term bullish trend. However, the indicator has deviated seriously into the overbought area, suggesting that there is a large risk of technical correction in the later period. Strategy analysis needs to focus on the support role of the MA5 moving average below. If it falls below, it may trigger a deeper adjustment. It is recommended to remain cautious in operation. You can consider light positions and try to arrange short orders on rallies. The upper resistance focuses on the 3780-3800 range, and the lower support is around 3745-3730. Although the current market trend is upward, we need to be vigilant against the risk of high-level corrections.
Perfectly grasp the golden trading opportunity?Last Thursday and Friday, gold continued its range-sweeping pattern as expected. The market fluctuated too quickly, and hesitation basically meant missing out. However, frequent trading can also be a burden. We ambushed both the bulls and the bears in advance and reaped good profits.
For today's market, first of all, the gold daily chart combination is a typical "big sun front resistance line" pattern, which is an obvious lure to buy. As long as it does not break through the previous high of 3707, then today we tend to continue to be bearish. From a technical point of view, the high-level continuous negative adjustment state is obvious, and the rebound momentum is gradually weakening. The long upper shadow line of the daily line shows that the upper selling pressure is heavy, and the short-term bullish power is insufficient. The upper track of the Bollinger band in the 4-hour cycle is repeatedly under pressure, the MACD momentum column continues to shrink, and the fast and slow lines show signs of forming a dead cross, indicating that the rise is weak.
On the news front, the Fed's expected interest rate cut has been realized, and the realization of positive news has weakened the momentum for gold to rise further. The subsequent market focus will be on "whether there will be another interest rate cut and the extent of the cut." Uncertainty makes funds more inclined to take profits at high levels. At the same time, the US dollar index stabilized and rebounded, and US Treasury yields stopped falling, which continued to suppress gold.
At the level of funds and market sentiment, long positions are already at a high level, with limited room for growth. Institutions are more likely to overvalue and undervalue at high levels, and it is difficult for gold to maintain a sustained upward trend under the volatile pattern.
Therefore, in terms of operation, it is recommended to look for short opportunities below the previous high of 3707 today, especially above 3685, where short orders can be arranged in batches, positions can be strictly controlled, and stop-loss space can be enlarged to cope with fluctuations. The short-term target will first look at the 3670-3660 area. If it breaks down strongly, it will further look down to the 3650-3635 area.

Don’t hesitate when gold rebounds, just go short!Gold fluctuated repeatedly in the range yesterday, and the trend was completely in line with our trading idea of selling high and buying low. The long and short two-way layout was stable and profits were achieved. The daily line closed with a negative line and a long upper shadow, indicating that the high-level adjustment pattern is still continuing, but the technical indicators have not formed a death cross, and the overall bullish trend is still dominant. The short-term level continues to maintain a volatile and bearish idea. The rebound of the middle track of the Bollinger band in the 4H cycle was blocked and fell back. At the same time, the 1H secondary high was suppressed, and the upper pressure was still significant. Today's operation focus is based on the middle track pressure to see a volatile downward trend. Pay attention to the 3660-3675 area on the top. If this range is broken, the short-term may extend to test the 3685 line; pay attention to the 3625-3610 range on the bottom. Once it stabilizes, it is still a good opportunity to buy on the low. If it holds this position, the bullish pattern remains unchanged. If it is lost, we must be alert to the risk of a deep correction. The current volatile market continues to release room for selling high and buying low. Planned trading is the key to avoiding emotional chasing of gains and losses.

Gold rebounds, bears should not miss this opportunity!Did gold fall as we expected? Congratulations to those who have been paying attention. We have been emphasizing from the weekend, last weekend, until yesterday that the top of gold is just above the 3700 mark, and the extreme position is in the 3720-30 area. When the Fed cuts interest rates, gold will fall. We have been saying this over and over again. I don’t know if you have listened to us.
Gold, the release of yesterday's interest rate decision also made the market experience a shock. The large fluctuations back and forth without a bottom line also made the market abuse the bulls and bears wantonly. The trend was also quite magical, making the market defenseless and not giving the slightest chance. After a small rebound near 3694 when the news was announced, it began to dive rapidly, reaching the lowest point near 3652, and then quickly rose again to near 3707, and then continued to fall rapidly, reaching the lowest point near 3645. After the opening, it rebounded again at 3672 and continued to fall. The current lowest point was near 3634. A series of large-scale back and forth sweeps also made the market more fearful, and the daily line also closed in the form of a large negative line. The market is in a state of decline, directly breaking the support of the short-term moving average. It is currently hovering between the 5-day and 10-day moving averages. Therefore, due to the closing of yesterday's large negative line, it is relatively likely to start a pullback and repair again in the short term, and the effective support below is maintained at around 3630-3620. This area is also the key tactical defense we mentioned earlier. Once this position continues to be lost, the long and short positions may be reversed in the later period. The key pressure above is maintained at around 3675-3690. You can refer to this position to continue to short and wait. If gold rebounds to around 3675-3690 during the day, short it, and the target is around 3630-20.

In the game between bulls and bears, where will gold go?After a slight pullback yesterday, gold broke through the previous high of 3674 in the US session, reaching a high near 3685. After an intraday correction, it reached a new high in the European session, currently reaching 3699. Since the start of its strong rally, gold has gained nearly $386, almost continuously breaking new highs. Market expectations for bullishness have further intensified, and the current trend remains clearly bullish, with no signs of a significant bearish pullback. Short-term support is closely watched at 3675, a previous high and a short-term dividing line between bulls and bears. If it stabilizes above this level, bulls are expected to regain momentum. The European high and the 3700 mark will become key short-term resistance levels. If it breaks through and stabilizes at 3700, it is expected to continue to rise to test resistance in the 3710-3720 area.
In terms of operational thinking, if gold first rebounds to below 3700 and comes under pressure, you can try to short with a light position, with the target at 3685-3670 area; if it stays at 3700 for a long time, you need to adjust the short position in time, follow the trend and go long, waiting for a new round of upward opportunities.

Gold hits a new high again, the opportunity to invest has come!Gold's recent performance remains strong, reaching a new all-time high near 3,685, fully demonstrating the dominance of bullish sentiment. Although inflation remains viscous, the market is increasingly confident that the Federal Reserve will cut interest rates this week. Focus is shifting to the extent of the cut and subsequent policy guidance. If the rate cut exceeds expectations, gold may usher in a new round of liquidity-driven gains. If it falls short of expectations, short-term profit-taking may occur, leading to increased volatility.
From a technical perspective, gold has closed higher for several consecutive days, with short-term moving averages aligned in a bullish pattern. The daily and 4-hour charts remain in an upward trend, with the support center continuously shifting upwards. The bullish structure is solid, but the current price is already at a relatively high level. If the upward push fails to break through with significant volume, there is still room for a short-term pullback, and we need to be wary of the possibility of a technical correction. Today's core trading strategy is to primarily buy on dips, supplemented by shorting at high levels. We should participate with the trend and avoid blindly chasing the market. Support below is the 3650-3635 area. If it stabilizes after a pullback, we can arrange long positions in batches, with the initial target around 3680-3685, and then explore the potential for further growth after breaking through the new high. Resistance above is the 3685-3690 area. If the short-term upward push encounters resistance and fails to break through, we can try shorting with a light position, with a stop-loss placed above the resistance level. Enter and exit quickly, and avoid a prolonged battle. The short-term bullish strength and weakness dividing line is the 3630-3620 level. If it breaks below, we should be wary of the risk of a deep pullback.
This week is packed with macroeconomic events, with the Federal Reserve's interest rate decision in particular under scrutiny, potentially amplifying market volatility. We recommend building positions in batches, maintaining strict position management, and setting effective stop-loss and take-profit targets to ensure profit capture while minimizing drawdown risk.
Do you think the Federal Reserve will cut interest rates beyond expectations this time? We welcome your exchange of views. We will also adjust our strategies immediately based on the data to ensure that our trading rhythm keeps pace with the market.

Gold continues to fluctuate before the US interest rate decisionGold, after last Friday's continuation of the previous day's bottoming out and rebound, continued to fall into a range-bound oscillation mode, and after opening today, it continued to retreat to around 3626 before rising. Although there is no breakthrough between the bulls and bears at present, it is still in a tug-of-war, and the support below will also be maintained near the low point of 3626. This position is also the first watershed related to whether gold can continue to fall in the later period. The key pressure above is maintained near the previous secondary high point of 3655. This position is also the key suppression point for the recent retracement after multiple touches. It is also the shoulder position of the head and shoulders top, which also plays a role. It plays a connecting role, and once this position continues to suppress, gold may be under pressure again in the later period. If it does not break through again this week, gold may retreat again next week to test the support level of 3610. Although the daily line is still in a high sideways trend, the upward momentum has also declined significantly. If it bottoms out and rebounds, it needs a secondary definition of the European session, which is also an advance forecast of the US session. If gold rebounds to 3645-3655 during the day, short it and target around 3630-20. The strength of the European session may also determine the direction of the US session.

Big events in gold this week!Gold closed with another positive line on the weekly chart. Although it has a long upper shadow line, the overall upward pattern is still solid, the trend has not been destroyed, and it still maintains a strong pattern. The daily level shows a high-level yin-yang cycle consolidation. It has failed to break through the 3660 high in the short term. Therefore, it will temporarily respond with a shock thinking, waiting for another bullish opportunity after the breakthrough. What needs to be paid attention to is that the Federal Reserve’s interest rate decision is about to come this week. The market may usher in a new direction choice, and volatility may intensify. At that time, the market rhythm will be more critical. Pay attention to the 3620-3660 area in the small range of the day. If it can break through, look at the extension space of the large range of 3675-3610. Remind brothers, this week’s trading should pay more attention to rhythm and risk control, avoid blindly chasing ups and downs, wait patiently for the key positions to be confirmed before entering the market accurately, execute high-winning trading plans, and lock profits firmly in the account.For the specific layout and operation rhythm, please refer to the bottom notification I released at the first time to ensure consistent execution and unified thinking, and avoid blindly following the trend and causing unnecessary risks.

How to seize the certain opportunity of gold?Gold prices are currently consolidating within a yellow parallel channel on the hourly chart, forming a rising flag pattern. We anticipate an eventual breakout and the start of a unilateral rally. The key short-term move lies in the middle band. If the price holds support at the middle band and 3630, a volatile upward trend is likely. A break above the upper band at 3665 could accelerate the upward trend. If the price loses control of the middle band and falls below 3630, the market will continue to fluctuate within the channel, potentially testing the lower band and support near the 10-day moving average early next week, offering a bullish opportunity at low levels.
The 3635-3630 support level should be closely monitored. If a bottoming-out rebound signal emerges, consider buying on dips. If the price effectively breaks below 3630, wait patiently for a pullback to the lower band next Monday before entering a long position. The primary resistance area above is 3665. Only a break above this level would confirm the formation of a rising flag pattern and trigger a unilateral rally. Caution is advised throughout trading, awaiting clarity on the direction of key levels.
