XAU/USD Intraday Plan | Support & Resistance to WatchFollowing yesterday’s analysis, gold failed to hold momentum above $3,883 and sold off sharply, breaking back toward first support zone. Price tested the $3,828 level before rebounding, with the 50MA (pink) now acting as resistance.
A sustained break above $3,861/50MA could invite a retest of $3,883, with upside targets at $3,903 if momentum extends.
Failure to clear the $3,361/50MA risks renewed downside toward $3,828, with a deeper move opening secondary support zone. The 200MA (green) remains a key dynamic support if selling pressure escalates.
📌 Key levels to watch:
Resistance:
$3,861
$3,883
$3,903
$3,920
Support:
$3,842
$3,828
$3,796
$3,776
🔎 Fundamental Focus – Fri, Oct 3 (NFP Day)
Today is packed with high-impact US data:
🚩Non-Farm Payrolls (NFP),
🚩Average Hourly Earnings,
🚩Unemployment Rate,
🚩ISM Services PMI, plus several FOMC speeches.
⚠️ Reminder: US government data may be impacted by the shutdown, so releases could be delayed or revised.
High volatility and sharp swings expected.
Goldlevels

XAUUSD: Reversal confirmationOANDA:XAUUSD had a significant correction immediately after establishing a new ATH at 3897 with strong bearish momentum, I assess that 3897 will be the top in the near future and the market will begin to correct from here. With the U.S. government currently shut down and the release time of the nonfarm data possibly delayed, it is highly likely that gold will not experience unusual volatility and will continue to correct to lower levels.
Price is currently trading below the trendline, and the bullish structure has been broken with heavy volume, while the rebound shows low momentum, indicating this is a strong break.
As I analyzed in yesterday’s session, CME traders have pushed a large number of long put contracts into the market to hedge against a decline. Therefore, price may continue to fall in today’s session as the nonfarm release is postponed. You can read my previous analysis here:
Resistance:
Support:
Strong support:
Trading plan: Look for sell entry at the resistance zone on the 5m timeframe when a reversal signal with large selling volume appears as indicated by Quantum Vol-Delta.
Place stop loss just above the nearest M5 swing high or above the resistance zone.
Move to break-even at 1R (R:R=1:1).
Please like and comment below to support our traders. Your reactions motivate us to produce more analysis in the future 🙏✨
Victor Dan @ ZuperView

XAUUSD: Caution advised ahead of NFP releaseOANDA:XAUUSD current bullish momentum is weakening, and traders are extremely cautious ahead of the upcoming Non-Farm Employment Change, which is expected to be USD-positive , accompanied by gradually emerging profit-taking pressure from investors. Therefore, I expect gold to have a significant correction soon after completing the upward move above the area.
You can read my previous analysis here:
There has been the appearance of long put contracts from CME traders being deployed into the market , which is a move to guard against a potential decline in gold in the future.
However, this is only the market’s preparation, and at present there is no sign of a reversal .
Continue to look for buy setups toward Targets 1 and 2. Pay attention to the Margin zone, where CME traders are concentrating a large number of contracts, which may cause price to reverse.
Key resistance:
Key strong support: ,
Margin zone:
Wait for confirmation of a Buy (Pull) signal from MagnetOsc Turbo on the lower timeframes after price breaks above the resistance zone and pullback. Place the stop below the most recent M5 swing low when the entry signal appears.
Continue to look for buy setups toward Target 1 & Target 2, while closely watching for reversal signal.
Please like and comment below to support our traders. Your reactions motivate us to produce more analysis in the future 🙏✨
Victor Dan @ ZuperView

XAU/USD Intraday Plan | Support & Resistance to WatchGold failed to hold above $3,883 yesterday, triggering a pullback into the $3,861 support where the 50MA is currently holding as dynamic support. Price is now consolidating just above this level.
If bullish momentum continues, a retest of $3,883 is likely, with a breakout opening the path toward $3,903.
A break below $3,861 would expose the $3,842–$3,828 supports, with risk of a deeper pullback into the First Reaction Zone and a possible 200MA test.
📌 Key Levels to Watch
Resistance:
$3,883
$3,903
$3,920
Support:
$3,861
$3,842
$3,828
$3,812–$3,796 (First Reaction Zone / MA200 confluence)
🔎 Fundamental Focus – Thu, Oct 2
The spotlight today is on US Unemployment Claims.
👉 With NFP tomorrow, traders should expect positioning swings and volatility around today’s data.

XAU/USD Intraday Plan | Support & Resistance to WatchGold is recovering from yesterday’s sharp pullback and is currently trending just above the $3,861 level. A sustained break above this area could see price push toward the $3,883 resistance, with a possible extension to $3,903.
Failure to hold above $3,883 could trigger another pullback into lower support zones.
📌 Key levels to watch:
Resistance:
$3,883
$3,903
$3,920
Support:
$3,861
$3,842
$3,828
$3,796
$3,753
$3,734
🔎 Fundamental Focus – Wed, Oct 1
Key US data on deck today:
🚩ADP Non-Farm Employment
🚩ISM Manufacturing PMI
🔶ISM Manufacturing Prices
👉 Expect high volatility and swings.

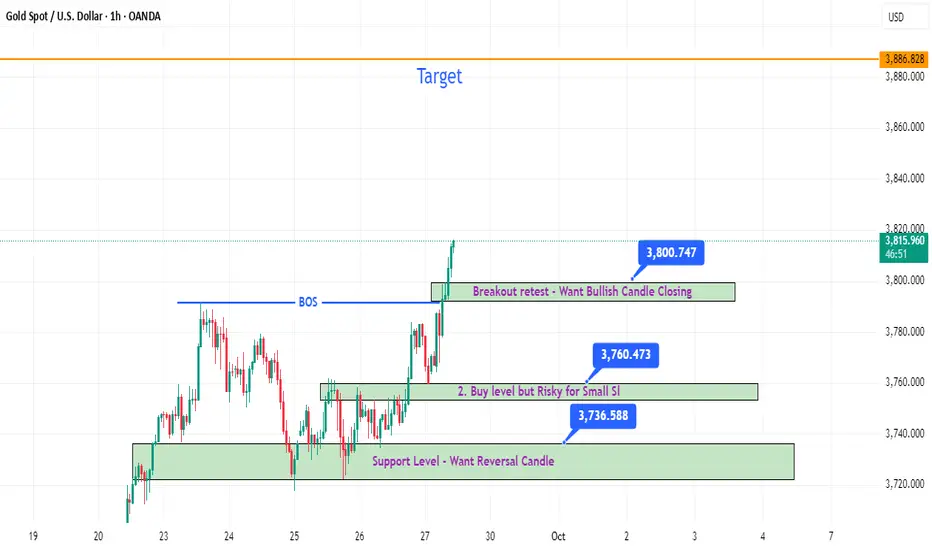
4 Hour Strong - Gold Next Level - DroidTradingGold Buying Level
Every Price Mention Possible Entry Zone.
If Tapped Take Entry as per your Risk - SL previous Candle low , Calculate SL right know.
3801 retest Level want Bullish Candle Closing - Target ( 3840-50 or 3885-90 ).
Keep SL, Book Your Daily Target
XAUUSD: Trend is your friend, follow it!Price remains in a strong uptrend with no clear signs of momentum weakness yet. That said, this appears to be the final leg of the current advance, so chasing highs is risky. I prefer to stand aside for now and wait for price-action confirmation of a top.
1) Analysis
Price has broken above the prior high at 3.791, but the Superior RSI has not reached the overbought zone and is showing early signs of divergence on 1h timeframe.
The area is a high-activity auction zone on CM E, from here I expect a short pullback into lower supports.
Key support: , , .
2) Primary Scenarios
Scenario A (bearish): If price breaks below and drives into lower supports, then 3.818 will likely mark the swing high, and a deeper correction should follow.
Scenario B (bullish extension): If price respects the support zone and breaks above 3818 then I expect price to at least top at 3866 where CME traders place a large amount of auction contracts and start a correction.
Please like and comment to support our traders. Your feedback motivates us to produce more analysis in the future 🙏✨

XAU/USD Intraday Plan | Support & Resistance to WatchGold is extending its rally, now trading around $3,813 after breaking out of the $3,796 resistance. Momentum accelerated once price cleared $3,776, with strong follow-through toward the next upside targets.
Current resistance sits at $3,828, while support is established at $3,776.
A clean break above $3,828 would keep momentum intact, opening the path to $3,846. Failure to clear $3,828 may trigger a retracement into $3,796 or deeper toward $3,776.
The $3,753 -$3,734/ First Reaction Zone remains a major pullback area if sellers regain control.
📌 Key levels to watch:
Resistance:
$3,828
$3,846
Support:
$3,812
$3,796
$3,776
$3,753
$3,734
🔎 Fundamental Focus – Week of Sep 29–Oct 4
It’s a heavy week for USD with key risk events:
🚩JOLTS Job Openings, Consumer Confidence
🚩ADP Employment, ISM Manufacturing, OPEC Meetings
🚩Jobless Claims
🚩NFP, Unemployment Rate, Average Hourly Earnings, ISM Services PMI
👉 This is jobs week — labour market data will dominate. Expect high volatility, especially into Friday’s NFP release.

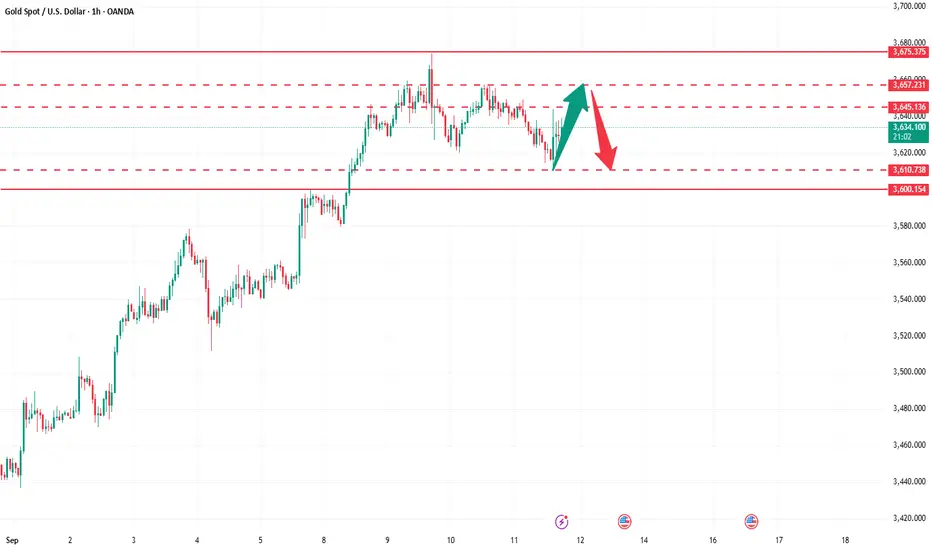
1 hour TF Gold Level -DroidTradingWait for Strong Resistance Breakout 3765-70
Strong Buying 3710-15, if Tapped, Also Entry if Retest On Trendline.
Keep SL ,Book your Daily Target
Comment on our Analysis

XAUUSD: Continuation of the pullbackPrice failed to break the Asian session high at 3,753 (no candle close above it). As a result, a deeper correction is likely before any new advance. The pullback targets are , and if extended, .
📉 Analysis
Wait for an Easy Trend sell signal on a break below the trendline with big volume.
Key resistance: , .
Key support: , , .
📊 Trading Plan
Wait for an Easy Trend confirmation when price breaks the trendline to the downside on strong volume, first target is 3717.
Example (SIGNAL): On 15m timeframe, price breaks the trendline with high volume — enter on the candle close, with the stop below the most recent swing low.
Risk management: Place the stop above/below the nearest 5m swing high/low, move to break-even at 1R (R:R = 1:1).
Please like and comment to support our traders. Your feedback motivates us to produce more analysis in the future 🙏✨

XAU/USD Intraday Plan | Support & Resistance to WatchGold is trading around $3,743, consolidating inside the First Reaction Zone after failing to hold above the $3,753 resistance. The 50MA is also acting as resistance. Price remains range-bound within this zone, with multiple tests of both the $3,753 and $3,728 levels.
A clean breakout and hold above $3,753 would open the path toward $3,768 and $3,782. Failure to clear $3,753/50MA risks further downside into $3,728, with extended weakness toward $3,712–$3,690 (200MA support).
📌 Key Levels to Watch
Resistance:
$3,753
$3,768
$3,782
Support:
$3,728
$3,712
$3,690
$3,665
🔎 Fundamental Focus – Fri, Sep 26
The spotlight is on Core PCE (2:30pm), the Fed’s key inflation measure, followed by UoM Consumer Sentiment (4:00pm).
👉 Expect volatility — strong prints may pressure gold lower, while weaker data could provide support.

How to accurately grasp gold trading opportunities?The market keeps falling, but we have no worries about taking profits. 3720 is the key short-term support level. Once it is effectively broken, gold is expected to accelerate its downward trend. For two consecutive days, we publicly suggested to arrange short orders near 3780 and 3760. Now the market has fallen sharply to the 3725 line, and we have achieved steady profits again. For two consecutive days, we accurately arranged short orders at the intraday high and steadily realized profits.
At present, gold is no longer in a unilateral upward trend, and the technical side has entered a repair stage. The operation idea is mainly to follow the trend, and the focus is on grasping the rhythm of bulls and bears. The most frequently asked questions recently are whether a big drop has begun and whether gold has peaked. From a structural point of view, although the daily line has been under pressure continuously, it closed in the negative yesterday and even formed a tombstone K-line pattern on the previous trading day, indicating that the short-term has encountered obvious suppression, but this cannot directly determine that the major trend has peaked. The weekly line is still dominated by bulls, and the short-term repair market has not destroyed the overall upward trend.
In terms of operation strategy, we still insist on shorting on rebound and long on pullback as a supplement. The lower support of the 4-hour chart focuses on the 3715-3700 area, and the upper pressure focuses on the 3760-3770 range. It is not advisable to blindly chase orders at the middle oscillation position. It is recommended to watch more and do less, and wait patiently for the key points to be confirmed before entering the market to seize the high winning rate opportunities.

XAU/USD Intraday Plan | Support & Resistance to WatchGold is following the analysis — after failing to break the $3,782 resistance yesterday, price dropped into the First Reaction Support Zone. Currently trading around $3,741, the rejection has pushed price below the 50MA, keeping near-term pressure on the downside.
A clean reclaim and hold above $3,753 could shift momentum back to test $3,768–$3,782.
Failure to hold above the First Reaction Zone risks a deeper pullback into $3,712–$3,690, in line with the 200MA, which may act as dynamic support. If this breaks, sellers may target the Deeper Support Zone $3,665–$3,642.
📌 Key Levels to Watch
Resistance:
$3,753
$3,768
$3,782
Support:
$3,728
$3,712
$3,690
$3,665
🔎 Fundamental Focus – Thu, Sep 25
Heavy data day for USD with several high-impact releases:
🔴Final GDP q/q
🔴Unemployment Claims
🔶Core & Durable Goods Orders
🔶GDP Price Index
🔶 Existing Home Sales
👉 For gold, today’s data cluster is critical — stronger numbers could weigh on price, while weaker outcomes may support upside. Expect elevated volatility.

XAU/USD Intraday Plan | Support & Resistance to WatchGold tested the $3,753 support during the Asian session and is currently trading around $3,775, holding just below the $3,782 resistance. A clean break above $3,782 would open the way to $3,796 and the major resistance at $3,806. Failure to break and hold above $3,782 could send price back towards $3,768–$3,753 and potentially deeper into $3,728. The moving averages may provide dynamic support on the way down.
📌Key levels to watch:
Resistance:
$3,782
$3,796
$3,806
Support:
$3,768
$3,753
$3,728
$3,712
🔎 Fundamental Focus – Wed, Sep 24
Yesterday, Powell signalled caution, stressing that rate decisions remain data-dependent — keeping gold supported but vulnerable to swings.
Today’s drivers:
🔶Trump speaks
🔶New Home Sales
Expect sharp swings and volatility spikes. Manage risk carefully.

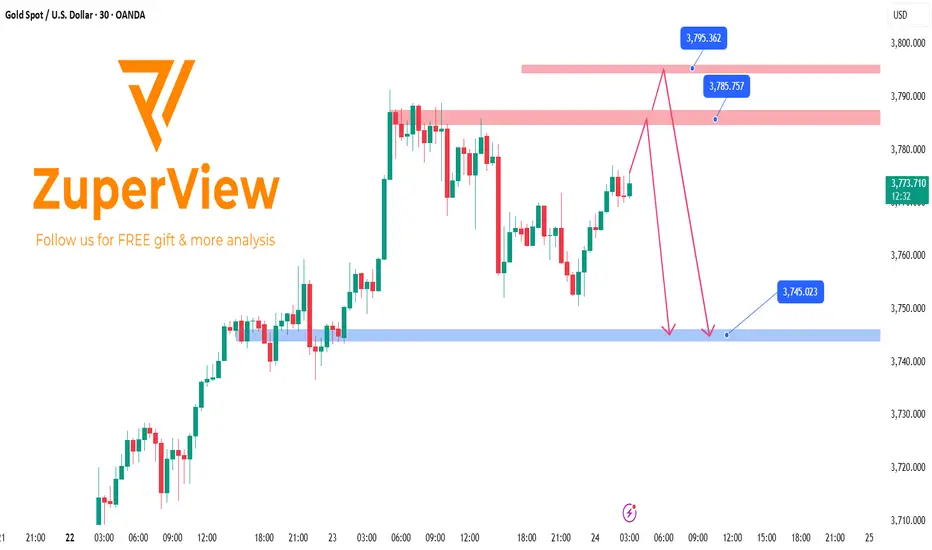
XAUUSD: Could 3790 Be the Top?After the 3740 → 3790 rally, upside momentum has weakened . Therefore, 3790 is likely a temporary top , and a short-term pullback may begin from here. However, we cannot rule out a retest of the top area or even a marginal higher high today before a sharper correction develops.
📉 Analysis
• After the push to 3,790 , price rotated within 3,778–3,788 and then broke the lower bound (3,778) on high volume . This supports the view that a swing high formed at 3,790 . However, price is currently drifting higher on lighter volume , so a retest of the top or even a marginal higher high before the pullback remains possible.
• Resistance zones: 3,784.5–3,787, 3,794–3,796 .
• Key support zones: 3,746–3,744, 3,723–3,718.
📊 Trading Plan
• Wait for reversal signals with heavy volume at the marked support/resistance zones.
• Highest-probability trigger: an 5m engulfing candle with high volume when price taps these levels.
Example: As in ENTRY 1 , if an 5m engulfing candle prints with high volume (as indicated by Superior Volume ) at a marked support/resistance zone, entry on the candle close .
• Entry on the signal and place the stop just above the signal candle (or above the resistance zone ). Move to break-even at +1R .
XAU/USD Intraday Plan | Support & Resistance to WatchGold continues its strong rally, now trading around $3,755 after breaking out of the ascending channel. To sustain momentum, we need to see a confirmed hold above $3,753, which would open the way toward higher resistance levels.
Failure to confirm this breakout could trigger a temporary pullback into lower support zones, with a potential retest of the 50MA if bears take short-term control. The higher price extends, the greater the risk of sharp swings and volatility spikes.
📌 Key Levels to Watch
Resistance:
$3,768
$3,782
Support:
$3,753
$3,728
$3,712 (MA50 retest zone)
🔎 Fundamental Focus – Tue, Sep 23
Key drivers today: US PMIs, Trump remarks + Richmond Index, and the main event — Powell speech.
Gold’s rally is extended, so expect headline-driven swings and possible volatility spikes around these releases.

XAU/USD Intraday Plan | Support & Resistance to WatchGold is trading just above $3,712 after breaking the mid-line of the rising channel and the $3,690 level. The next resistance sits at $3,728, which also aligns with the channel’s upper boundary. A clean break above this area would open the path toward $3,753.
On the other hand, failure to break $3,728 could trigger a pullback, with downside targets at $3,712 and $3,690.
📌Key levels to watch:
Resistance:
$3,712
$3,720
$3,728
$3,753
Support:
$3,690
$3,665
$3,642
$3,622
📌 Fundamental Focus – Week of Sept 22–27
This week brings a heavy U.S. data calendar, with key events that will guide gold and USD sentiment.
Tuesday: Flash PMI data and Powell’s speech – potential intraday volatility.
Thursday: High-impact releases including Final GDP, Unemployment Claims, and Durable Goods Orders – crucial for growth outlook.
Friday: The Fed’s preferred inflation gauge, Core PCE, along with Consumer Sentiment – the highlight of the week for markets.
⚠️ Expect increased volatility around Powell’s speech and PCE data.

Gold on the eve of interest rate cut: opportunity or trap?Gold Technical Analysis: Further analyzing gold's trend from a technical perspective, since its decline from the 3675 high, the daily chart has failed to show a clear unilateral direction. Instead, it has exhibited a pattern of alternating negative and positive fluctuations with narrowing amplitudes. Furthermore, the K-line chart continues to trade above the unilateral moving average. This pattern clearly points to a period of consolidation within a bullish trend, rather than a trend reversal. This week's daily chart should focus on two key support levels: the 3600 area represents a short-term watershed between strength and weakness. If broken, the market could shift from strong fluctuations to weak corrections. The 3500 area represents a medium-term bull-bear reversal line. A breach of this level could trigger a fundamental trend reversal. Therefore, 3600 should be the primary defensive line.
The 4-hour chart shows more volatile gold: the Bollinger Bands continue to narrow, and the moving averages are highly converging. This indicates a complete lack of momentum needed for a unilateral rise or fall. For the time being, the 3615-3660 range is the preferred range. Based on cyclical patterns, the probability of a breakout of the Bollinger Bands on Monday and Tuesday is extremely low before the bands open. Therefore, high-certainty trading can be conducted on these two trading days around 3615 (lower support) - 3660 (upper resistance), without excessive expectations for a breakout outside the range.
Based on real-time trends, gold has completed a short-term correction since the opening. Based on the logic of oscillation, long positions can be established within the day based on support near the lower edge of the range: enter near 3625-3620 (aligned with the lower edge of the 4-hour range), targeting upward fluctuations. Focus on the 3650-3660 area (where the upper edge of the 4-hour range overlaps with key resistance on the daily chart). If the price rebounds to the 3660-3655 range and finds resistance, a small position can be used to test short positions, targeting a pullback to the 3635-3630 area, forming a closed-loop buy-low-sell-high strategy within the range. Note that after the adjustment, the current price is in the middle of the range. Direct entry is not recommended for now. Wait until the price approaches the -3625-3620 support level or the 3655-3660 resistance level before placing orders based on K-line stabilization/pressure signals to improve trading accuracy. Overall, the recommended short-term trading strategy for gold today is to primarily buy on dips, supplemented by higher rebounds. Focus on the 3655-3665 resistance level on the upside, and the 3625-3615 support level on the downside.

With the interest rate cut coming, will gold fall or soar?The market is ever-changing. It's important to follow the trend; the trend is king. Plan your trades, trade your plans. How far one can go depends on who they walk with. How much a person can achieve in the market depends on who guides him. Let's witness what kind of turmoil gold will face next week with the Federal Reserve interest rate.
Gold has grasped the overall rhythm very well this week, the trading plan was executed smoothly, and the profit performance was satisfactory. After a slight pullback on Friday, gold rose again, and was suppressed near 3655-3660 above, and the oscillation stopped. This position also plays a role of connecting the above and the following. If this position continues to fail to break through, gold may pull back again next week to test the support position below. Although it is still in a high sideways trend at the close, the upward momentum has also declined significantly. I think whether the bulls can regroup next week is particularly important, which directly affects the later trend. Next week's interest rate decision has become the focus. Both market news and technical aspects are bullish for gold. Let us wait and see next week. If you feel your recent trading results are unsatisfactory and would like to avoid detours through clearer trading strategies and risk control, please feel free to discuss this with me.
Gold is currently in a high-level volatile pattern. After rising sharply and falling on Tuesday, it fell into a yin-yang alternating sweeping market. Before the Fed's interest rate decision, it is expected that the deadlock will be difficult to break. The market is waiting for guidance on policy direction. The key support is at the top and bottom conversion point and starting point of the 3610-3600 area. The bullish trend is maintained above it. If it breaks down, it may peak in stages. The trend suppression below Tuesday's highest point of 3674 is obvious. Next week, focus on the short-term support of the 3635-3630 area. If the Asian session tends to test the decline, the focus of the support below is near Thursday's low of 3610. If it breaks down, look at the 3600 and 3580 areas. If it breaks through the 3655 resistance above, it will turn strong in the short term and look at 3660 and the previous high. After breaking the high, focus on the 3680-3690 area. Maintain the overall range operation idea and follow the break.

CPI data is confusing,gold is fluctuating in a bearish directionGold Technical Analysis: Looking back at the recent trend, gold surged and then retreated on Tuesday, forming a shooting star pattern. However, the decline did not continue on Wednesday, indicating that the pullback was merely a one-off adjustment and lacks sustainability. It is a normal correction after a significant rally. Even if the market peaks, it will not be so simple. It will at least undergo a process of "high-level fluctuations turning bearish" or "second upward attack to lure more investors and then decline." In the short term, the rebound will continue to fluctuate, and it is unlikely to see significant rises or falls in a short period of time. Looking at the daily gold chart, the daily gold line has slowed down slightly. After continuous large volume, the daily line has turned into a small Yinxing candlestick pattern for consolidation. There is a need for a short-term pullback. Considering the short-term chart, the second high-point test failed to break through the previous high, the previous continuous large volume without a pullback, and the pressure from the second upward test. If there is no new high in the short term, there will be a partial correction around 3675-3657. The pattern will determine whether it is a deep pullback or a sideways consolidation.
Judging from the 4-hour gold chart, yesterday's gold price failed to achieve results in its attempt to rise again. There are signs of a downward correction. The 4-hour chart lost the middle track, breaking the unilateral upward momentum. At the same time, there is a need to further retrace to the lower track. Combined with the second high in the hourly chart near 3657, the second pressure turned into a decline. The strong market is to retrace and then break the high. Once the breaking power is stopped, it will go into a shock correction. Overall, today's short-term gold operation strategy recommends shorting on rebounds as the main strategy, and buying on pullbacks as the auxiliary strategy. The short-term focus on the upper side is the 3640-3650 resistance line, and the short-term focus on the lower side is the 3610-3600 support line.
Gold trend analysis continues to rise after consolidationGold trend: Today, gold focuses on the impact of CPI data, which may impact the temporary technical view. Today, the Asian and European sessions maintain a low-long bullish trend, with support at 3620-3610 and short-term focus on 3645-3655. The US data has little impact, so it depends on the range. If the data has a large impact, focus on 3600 below and 3680-3690 above. Gold has risen unilaterally in two transactions and fluctuated for one trading day this week. The current high of gold is 3675, and the decline is only around 3620. Therefore, it is obvious that gold is rising slowly under the bullish trend, and even if it fluctuates, it will not fall much. Then, to determine the direction, we must look at the upward space under the direction. We still don’t guess the top, but under the influence of data, we still have to discuss whether there will be a change in direction or a shift in strength in the near future.
From a technical point of view, the daily line is still above the support of the 5-day moving average. If the 5-day moving average is not broken, there is no possibility of weakening. Although the 4-hour Bollinger Bands have closed, the middle track has not broken, and it is difficult to have a major adjustment. Therefore, the current market is still in a strong position. It is not clear whether gold has peaked or has a larger adjustment space. Therefore, if you want to trade, you still have to go long on the decline. So, today's market can be viewed in two steps. The European session is expected to fluctuate upward. Operate at key points and go long in the 3620-3610 support area below. Look at the 3645-3655 area above. If the US data has a greater impact, pay attention to the gains and losses of the 3600 key point below. It is still a good time to go long if it does not break.

XAU/USD Intraday Plan | Support & Resistance to WatchGold is trading around $3,626, under pressure after failing to reclaim the $3,658 resistance yesterday. Price has slipped below the 50MA (pink), turning the short-term structure more bearish.
Bulls need a sustained recovery back above $3,644 to regain momentum. A break above $3,658 would confirm strength, targeting $3,674 and $3,690.
Immediate support sits at $3,617, followed by the key $3,594. A clean break below would expose the next support at $3,564.
📌Key Levels to Watch
Resistance:
$3,644
$3,658
$3,674
$3,690
Support:
$3,617
$3,594
$3,600
$3,564
🔎Fundamental Focus
Attention is firmly on U.S. CPI data (today). This will be a decisive driver for gold.
⚠️ Expect sharp intraday volatility as markets position around inflation expectations and Fed policy outlook.

XAU/USD Intraday Plan | Support & Resistance to WatchGold tested the $3,674 resistance yesterday before pulling back to the $3,620 area, where the 50MA provided dynamic support. Price is now trending around $3,646, attempting to recover from the pullback.
For bulls to regain control, we need a clean break above $3,658, which would open the path toward $3,674, followed by $3,690, and an extension to $3,706.
However, a rejection at $3,658 resistance could trigger a deeper pullback into lower support levels.
📌Key Levels to Watch:
Resistance:
$3,658
$3,674
$3,690
$3,706
Support:
$3,644
$3,630
$3,617
$3,594
$3,564
📌 Fundamental Focus – Sept 10
The fireworks start today with U.S. inflation data. Core PPI and PPI figures will be released this afternoon, kicking off a packed midweek that continues with CPI tomorrow and ends with Consumer Sentiment & Inflation Expectations on Friday.
⚠️ Expect volatility to pick up from today onward, with sharp moves likely around each release.
