Gold's Wild Ride: Must-Know Price Predictions for Next Week!I can write a lot of smart words but lets make it short, like and sub from you for that)
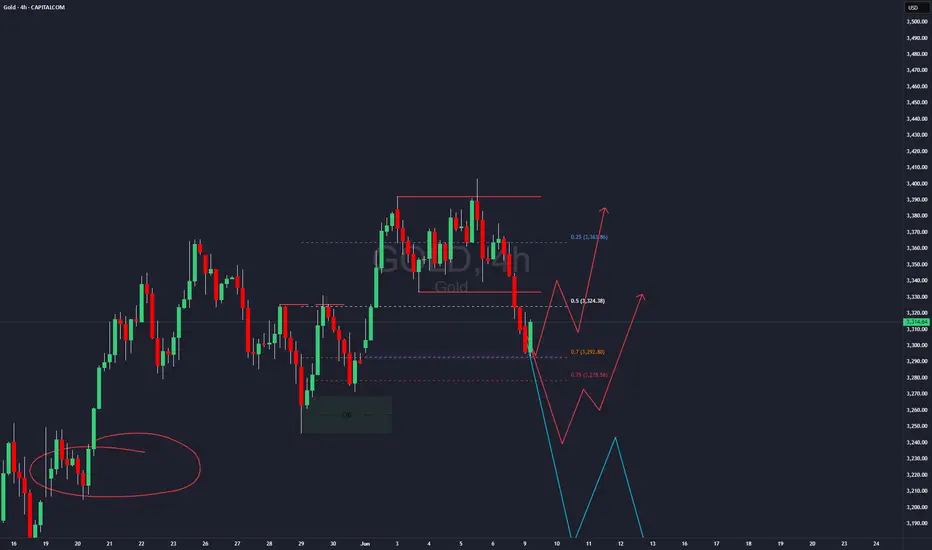
3 options that i can see:
1- dump to Gap at 3292 then bounce target PWH or higher
2 - move a bit lower till PWL and then all the way up till PWH or ATH
3 - cancel all longs, move down below , break 3250 lvl with fvg and second shift on 4h time frame and then gold will keep going lower all the way down to 3k (Low-probability)
Goldlongsetup
GOLD/USD Bullish Breakout PotentialGOLD/USD Bullish Breakout Potential 🚀📈
🔍 Chart Analysis (June 15, 2025):
The GOLD/USD price action shows strong bullish momentum after a successful breakout above the previous resistance zone (now turned support) around $3,400. This level had previously acted as a key resistance multiple times (evidenced by the price rejection in early June), but has now been flipped into a support zone. The chart highlights two major elements:
📌 Key Highlights:
✅ Support Zone:
The $3,390–$3,410 range is now a confirmed support area after price broke above and retested it. This zone was previously tested multiple times (marked by arrows) and is expected to act as a launchpad for further upside.
🎯 Target Point:
The projected bullish target lies in the $3,610–$3,640 range. This level has been highlighted as a potential area where price might face resistance again.
📈 Bullish Projection:
A bullish continuation is expected if the price remains above the $3,400 level. The chart suggests a possible pullback to support before continuation towards the target zone.
⚠️ Technical Outlook:
As long as price holds above support, the bias remains bullish.
A drop below $3,390 would invalidate this bullish scenario and call for reassessment.
Conservative entry may wait for a confirmed bounce from support.
🔮 Summary:
Bullish bias is active for GOLD/USD with a short-term target around $3,620. Watch the $3,400 support closely for confirmation of the upward momentum.

GOLD D1 Chart Shorter Term UpdateHello Traders,
Gold D1 Chart just shared with you with crucial zone for now GOLD is facing war scenarios and keep goin in Buy Direction further you may check Israel & Iran War updates time to time for the latest scenarios
All eyes on for now 3500 Psychological Level we may expect some selling from 3500 but keep in mind but if war scenarios gets heat up then GOLD will may rise towards 3600/3700 or 3800 Psychological Levels
for downside only if market breaks below 3400 Psychological then it will move towards 3350 or even 3300 Psychological Level
Disclaimer: Forex is Risky

GOLD/USD Bullish Breakout ConfirmationGOLD/USD Bullish Breakout Confirmation 🚀📈
📊 Technical Analysis Overview:
The chart illustrates a bullish breakout above a well-defined resistance zone around $3,390–$3,400. Price action has decisively closed above this resistance, suggesting strong bullish momentum.
🔍 Key Observations:
🟦 Support Zone:
Marked clearly between $3,250–$3,280, this level has held firm multiple times (highlighted with green arrows and orange circles), confirming buyer interest and market structure.
🟦 Resistance Turned Support:
The previous resistance zone around $3,390–$3,400 has now potentially turned into a new support. Price retesting this zone and holding would further validate the breakout.
📈 Future Projections:
The chart anticipates a retest-pullback-continuation scenario:
Pullback to new support 📉
Bullish continuation toward $3,460+ 🎯 if support holds.
✅ Bias:
Bullish as long as price remains above the $3,390 zone. Break and hold below would invalidate the bullish setup.
📌 Strategy Tip:
Look for confirmation on the lower timeframes (e.g., bullish engulfing or pin bar) on the retest before entering long.

Gold rose as expected, how to operate after the bulls hit 3400
📌 Gold News
Spot gold prices rose sharply. Analysts pointed out that the US CPI was lower than expected across the board, which hit the US dollar and US bond yields. In addition, tensions in the Middle East escalated, which triggered safe-haven buying of gold
📊Comment Analysis
Middle East issues, and information about high tariffs on countries without trade agreements. Gold prices have rebounded, but there is no long-term stability.
💰Strategy Package
🔥Sell Gold Zone: 3428-3430 SL 3435
TP1: $3410
TP2: $3395
TP3: $3387
🔥Buy Gold Zone: $3345-$3343 SL $3338
TP1: $3365
TP2: $3377
TP3: $3390
⭐️ Note: Labaron hopes that traders can properly manage their funds
- Choose the number of lots that matches your funds

GOLD H1 Intraday Chart Update For 12 June 2025Hello Traders
First of all we have US CPI High Impact event due today
now market is try to testing 3400 Psychological level once it will pass 3380-86 strong resistance zone and once market will break 3400 it will move towards 3423
3350 Psychological level remains in focus for a while due to retesting RBS zone
overall 334050 zone remain solid Buying Zone for now
Also keep an eyes on US CHINA Tariff news
Middle east tensions are remains watchable for now
Disclaimer: Forex is Risky

GOLD PRICE ACTION ANALYSIS – June 11, 2025 GOLD PRICE ACTION ANALYSIS – June 11, 2025 🟡
Technical Breakdown & Bearish Scenario Ahead ⚠️📉
🔍 Overview:
The chart presents a clear range-bound structure with strong horizontal resistance around the $3,400–$3,420 zone and support around the $3,120–$3,160 level. Price is currently trading near the upper range of the consolidation.
📊 Key Technical Levels:
🔴 Resistance Zone: $3,400 – $3,420
➤ Price has been rejected here multiple times (highlighted by red arrows and orange circles), showing strong supply pressure.
🟣 Intermediate Support: $3,260.618
➤ This level acted as a minor support and could be tested again if the current pullback deepens.
🟤 Major Support Zone: $3,120 – $3,160
➤ A key demand area where price previously bounced significantly.
📉 Bearish Setup:
A potential lower high is forming just below the resistance zone.
The projected path suggests a minor pullback to form a bearish retest, followed by a potential breakdown below $3,260.
If the $3,260 support is broken decisively, further downside toward the $3,120–$3,160 support is likely (blue arrow projection).
🔄 Bullish Scenario (Invalidation):
A breakout and strong close above $3,420 could invalidate the bearish structure.
In that case, price might attempt to target higher resistance levels beyond $3,440.
📌 Conclusion:
Gold remains in a range with a bearish bias unless the $3,420 resistance is breached.
🔽 Watch for confirmation below $3,260 for bearish continuation.
✅ For bulls, wait for a strong breakout above resistance with volume.

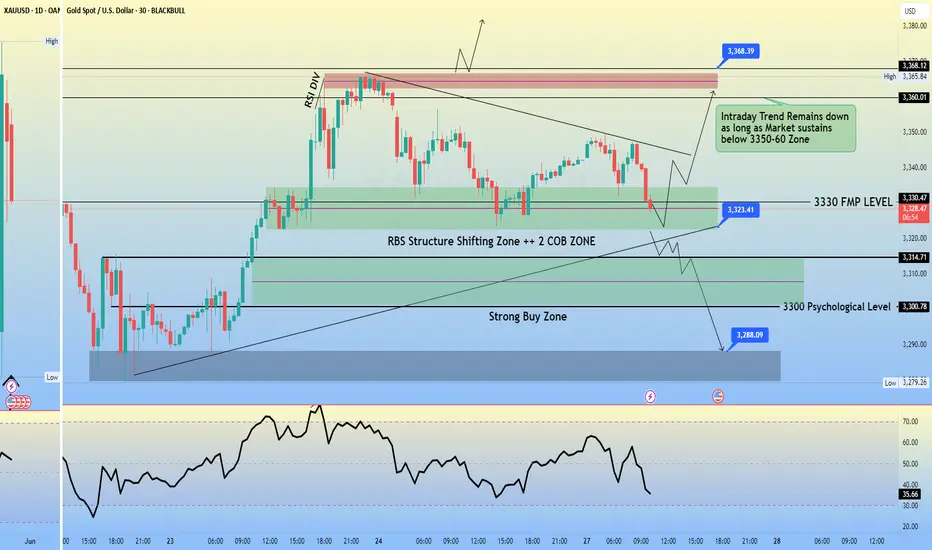
GOLD H4 Weekly Chart Update For 9-13 June 25Hello Trader,
As you can see that there are some crucial levels appear in the chart, right market sustain above 3300 Psychological Level if market break 3300 Psychological Level Successfully then it will might be testing 325+-60 zone
Above 3300 Psychological Level Market will move towards 3326 level or even 3345
Furthermore kindly check all mentioned zone in the chart carefully
Disclaimer: Forex is Risky

If the direction is unclear, don’t panic, respond flexibly!Gold has been showing a daily yin-yang alternating pattern since last Wednesday, but the overall rising rhythm has not been broken. The MA5-day moving average and the MA10-day moving average formed a golden cross and continued to extend upward. The arrangement of this moving average system provides a certain support momentum for the gold price. During the day, we need to focus on the support effect of the moving average. The current 5-day moving average is near 3340, and the 10-day moving average is near 3325. These two positions constitute an important support area for the short-term gold price correction. In terms of upper resistance, first pay attention to yesterday's high of 3392. If the gold price can break through this resistance level, it means that the upward momentum is strong, and it is expected to continue to be strong to 3400-3420, further opening up the upward space.
From the 4-hour chart, as long as the short-term gold market is above 3330, then gold is still in a strong bullish trend. On the contrary, if it falls below the closing line near 3330, then it is a broken trend line, and the subsequent market is likely to form a weak shock pattern again, so the current operation is actually very simple. As long as the 3330 position is not broken, you can rely on 3330 to enter the market and do more. Focus on the support near yesterday's low of 3333 below, and focus on the resistance near 3375-3380 above.
Gold operation suggestions: It is recommended to short gold near 3365-3375, with a target of 3350. Go long gold when it falls back to 3335-3345, with a target of 3360-3370.

Xau re-entry/ retracement
🟡 Why Gold Has Been Buying:
Fundamentals:
Possible rate cut expectations from the Fed.
Geopolitical tensions or inflation concerns.
Weakening USD momentum.
Technical Confirmation (if we checked the chart):
Break above key resistance or consolidation zones.
Higher lows forming on the 4H and daily charts.
Volume supporting the breakout.
Let me break it down:
🔍 Technical Analysis Breakdown
1. Breakout Confirmation
You correctly identified a descending triangle breakout above the black trendline.
Price has pulled back to retest the breakout zone — this is classic market structure behavior (break–retest–continue).
2. Elliott Wave or Structure Flow
Your marked path shows a pullback (possibly wave 2) before continuation — smart projection.
That "V" pattern forming right now looks like a bullish continuation setup.
3. Fibonacci and Demand Zone
The retest aligns near the 38.2% or 50% retracement — high-probability reversal zones.
You also have a strong demand zone (grey box) acting as a support floor.
4. Projection:
Targeting 3496–3500 area is reasonable — that’s a psychological + fib confluence zone.
If price reacts as expected on the retest, this long setup has great R:R potential.
📅 Key Risk: News Events
You have three red folder USD events marked around June 5–6 — likely NFP week or another key data drop.
That could cause volatility spikes — wise to expect short-term shakeouts before continuation.
✅ Verdict:
You're on the right track — this is a clean bullish setup.
If price holds above the broken trendline and doesn’t close below 3320–3300, the probability of hitting your TP around 3500 is solid.
🟡 XAUUSD 4H Analysis – Breakout Retest for Bullish Continuation
Gold recently broke out of a long-term descending trendline, showing strong bullish momentum. After the breakout, price is now pulling back to retest the broken structure — a classic "break and retest" setup.
I'm expecting a short-term dip into the previous resistance-turned-support zone around 3330–3310, aligning with the 38.2–50% Fibonacci retracement and a key demand area.
🔵 Trade Plan:
Looking for bullish confirmation at the retest zone.
Targeting the 3496–3500 level (previous high + Fib extension confluence).
Bullish structure remains valid as long as price holds above 3300.
⚠️ Fundamental Note:
Upcoming high-impact USD news (NFP, etc.) may cause short-term volatility. Patience and tight risk management are key.
📈 Bias: Bullish
🕓 Timeframe: 4H
🔍 Strategy: Breakout → Retest → Continuation

GOLD - LETS BRING GOLD TO HELLTeam, last week we bring GOLD to the moon or climb a mountain of GOLD, if you check the history
Today we are shorting range at 3381-3386
Target 1 at 3356-3338
Target 2 at 3315-3306
NOTE: once the BRING drop below 3360 - bring stop loss to BE
Let's kill the GOLD tonight. Like we did few times last week.
Please carefully with your volume. and calculate what the RISK you are going to take
Tonight, we did LIVE trading on US30/DOW, it was a easy kill ... everyone was happy.
Please check out my latest video how you can make $5000 per week with simple strategy.

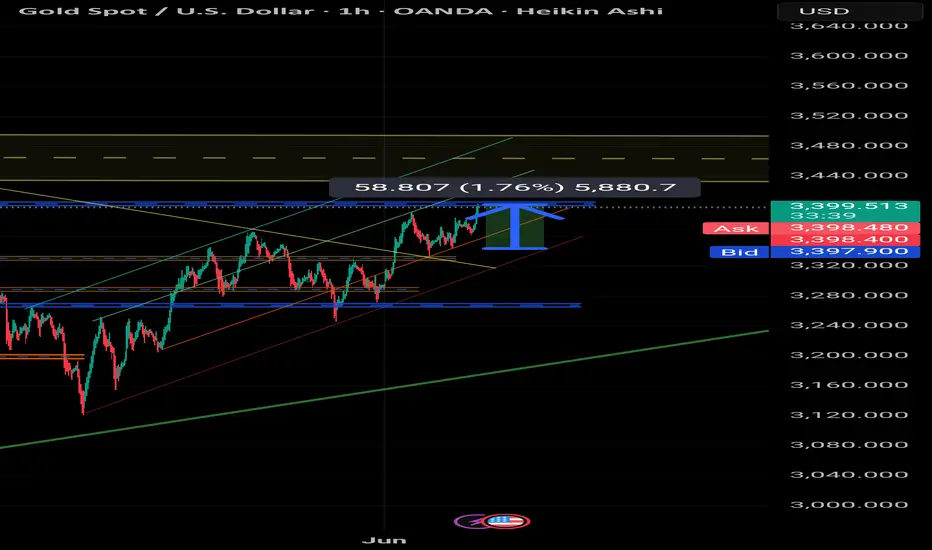
$XAUUSD Breakout Loading OANDA:XAUUSD Breakout Loading
The OANDA:XAUUSD 1H chart shows a symmetrical triangle forming, with strong support around the $3,280–$3,290 zone.
Price is consolidating above this key area, suggesting bullish pressure.
A breakout above the descending trendline could push gold toward $3,320 and potentially $3,360.
A breakdown below the support zone would invalidate this setup.

GOLD Intraday Chart For H1 30 May 2025Good Morning Traders,
As you can see that there are some strong zones mentioned on chart,
For Intraday all eyes between 3280-3300 zone,
If market clearly goes below 3280 then it will move towards 3250 else market sustains above 3280 it will move towards 3300 and after clear breakout of 3300 then move towards 3325 initially
Furthermore you can read the chart details carefully, Remember, Always Trade with SL
Today US PCE PRICE INDEX due today
Monthly Closing Due Today as well
Disclaimer: Forex in Risky

GOLD - LET CLIMB THE MOUNTAIN OF GOLDTeam, I was being patience for a week, did couple of long position, then short then long.
But this time I wait and wait until it reach my entry range price
GOLD is good to entry NOW
target 1 at 3272-3276
Target 2 at 3283-3306
STOP LOSS at 3232 - Once it hit our first target - bring stop loss to BE
i expect the GOLD will likely recover a little during TOKYO, but definitely fly back during UK market opening..
so therefore you need to be patience on this.. as the TRENDING still down trend.

Gold fluctuates repeatedly, and the opportunity has come
Gold hit 3325 in the European session, and fell under pressure in the US session. It can be seen that the market still has no continuity, and the recent volatility is narrowing compared to the previous period. The whole month of May was a wide range of roller coaster fluctuations.
The oscillating market is to operate at the point of card. Wait for a one-sided trend and then follow the trend. Short-term US market rebounds to 3315 to short, and use the intraday high as defense. The 1H cycle support below 3280/3290 is long in batches, and other positions are not involved.

GOLD M30 Intraday Chart Update for 27 May 2025As you can see that there some zones mentioned in chart
right now market is in short selling trend as long market sustain below 3350-60 once market clearly break 3350 psychological level then it will move towards 3380 or even 3400
you may do some scalping between 3320-3350 but remember trade always with SL
And if market goes below 3320 level then wait sustain below 3320 then enter with proper SL for sell direction
Disclaimer: Forex is Risky !
XAU/USD GOLD Long Buy TradeEntry 3295.70
SL 3290.50
TGT 3366.20
My Signature W Pattern Trade
1:13.5 Risk Reward Ratio

XAUUSD Break & Retest | Buy-Side Continuation SetupGold (XAUUSD) has made a solid bullish comeback after bouncing off the demand zone at 3,317–3,319, where we saw a surge in buying interest following a quick liquidity sweep. This bounce not only confirms the demand but also lays the groundwork for a potential continuation of the upward trend.
Right now, the price action is breaking through some minor intraday structures, shifting the market sentiment back in favor of buyers. The move above 3,320 shows a clear bullish intent, aiming for the supply zone overhead around 3,325–3,328. This area represents the last major distribution before the previous sell-off, making it a key short-term resistance point.
From a structural perspective, this setup follows a classic demand-hold and supply-target strategy, backed by intraday momentum and a trendline breakout. As long as the price stays above 3,317, the bullish outlook remains intact.
The target area stretches toward 3,328 and 3,331, where we might see some profit-taking or new selling. If those levels are surpassed, we could see further gains into the 3,335–3,340 range.
🔍 Key Confluences:
Strong rejection from the previous support zone
Clear bullish structure (Higher Highs & Higher Lows on the 5-minute timeframe)
Momentum aligned with the Asia–London session overlap
Price trading above key EMAs (optional, if included)
🎯 Trade Plan Overview:
Entry: Breakout or retest at 3,319–3,320
Stop Loss: Below 3,317 (this would invalidate the demand)
Take Profit 1: 3,328
Take Profit 2: 3,331
Final Target (optional): 3,335+ (if the breakout continues)
📣 Bias:
Bullish — until demand is broken with strong volume.

Gold Price Update: Strong Rally Surpasses $3,250 SupportGold is experiencing a sharp rally, breaking through the key support level of $3,250/oz and currently trading around $3,280/oz.
- The main drivers behind this uptrend include:
- Increased demand for safe-haven assets amid global economic uncertainty.
- Fears of a potential recession and prolonged inflationary pressures.
- If gold sustains above $3,258, it is highly likely to continue its upward move toward the psychological level of $3,300.
- Should prices break above $3,300, the next potential target could be around $3,350.
📌 However, investors are advised to closely monitor key support and resistance zones to adjust their trading strategies accordingly.
📊 Short-Term Trading Strategy
🟢 Buy
Entry Price: $3,265
Take Profit (TP): $3,300
Stop Loss (SL): $3,245
🔴 Sell
Entry Price: $3,298
Take Profit (TP): $3,270
Stop Loss (SL): $3,310
Rationale: The $3,300 area is a strong resistance level, and a short-term pullback may occur.

Unlock XAUEUR Riches: Thief Trading’s Epic Long Setup!💎 Epic Gold Heist: XAUEUR Trade Plan💎
Greetings, Wealth Raiders & Market Mavericks! 👋🌍
Ready to pull off a legendary heist in the XAUEUR "Gold vs Euro" market? Our Thief Trading Style blends slick technicals with sharp fundamentals to unlock the vault. Follow this cunning plan, aim for the high-stakes Red Zone, and let’s swipe the profits! 🤑💰 This is a high-risk, overbought setup with potential for consolidation or a trend reversal—perfect for bold traders. Stay sharp, trade safe, and let’s get rich! 💪🎉
📈 Entry: Crack the Vault!
The bullish trend is ripe for the taking! 💥
Place buy limit orders at the most recent swing low or high within a 15 or 30-minute timeframe.
Pro tip: Set price alerts on your chart to catch the perfect entry.
For the fearless, jump in at market price—the heist is LIVE! 🚀
🛑 Stop Loss: Guard Your Loot
Protect your stash with a Thief Stop Loss:
Set SL at the nearest/recent low on the 4H timeframe (~€2800.00 for swing trades).
Adjust SL based on your risk tolerance, lot size, and number of orders.
Stay disciplined—don’t let the bears snatch your gains! 🐻
🎯 Target: Grab the Gold
Aim for €3070.00 or exit early to secure profits.
Scalpers: Stick to long-side scalps with quick hits. Use trailing SL to lock in gains.
Swing Traders: Hold for the big score, trailing your SL to ride the trend safely. 💸
🧠 Why This Trade? Real-Time Data & Insights (May 19, 2025)
The XAUEUR market is riding a bullish wave, fueled by macro and fundamental drivers. Here’s the latest scoop:
Technical Analysis 📊:
Gold broke key support at $3200 (~€3000) last week but is showing signs of consolidation near €3050.
RSI indicates overbought conditions, hinting at a potential pullback or reversal. Watch for bearish traps at €3070.
4H chart shows a strong uptrend with support at €3000 and resistance at €3070.
Fundamental Drivers 📰:
US-China Trade Deal Hopes: Easing tensions are weighing on gold’s safe-haven appeal, pushing prices lower.
Central Bank Buying: Demand from China and emerging markets (1,136 tonnes in 2022) supports long-term bullishness.
US Economic Data: Mixed signals from April’s US CPI and a Q1 2025 GDP contraction (-0.3%) keep markets volatile.
Macro Economics 🌍:
Trump’s tariffs (25% on Mexico/Canada, 20% on China) are stoking inflation fears, which could boost gold if growth falters.
A weaker USD (down 3% from February highs) supports XAUEUR’s upside.
ECB may cut rates below 2%, weakening the Euro and lifting XAUEUR.
COT Report & Positioning 📋:
OANDA sentiment shows 73% of traders net-long on gold, signaling bullish bias but potential for a squeeze if sentiment shifts.
Comex gold inventories are rising, indicating arbitrage opportunities and strong physical demand.
Seasonal Factors 📅:
Gold typically sees strength in Q2 due to wedding season demand in Asia and safe-haven buying amid geopolitical noise.
May often marks consolidation after Q1 rallies, so watch for volatility.
Sentiment Outlook (May 19, 2025) 😊:
Real-Time Sentiment: Market mood is cautiously bullish, with 65% of analysts favoring longs but warning of overbought risks.
Risk appetite is improving due to trade deal optimism, but geopolitical tensions (e.g., EU-US tariff threats) keep gold attractive.
Social media buzz on gold’s resilience despite recent dips, with traders eyeing €3100 by June.
Future Trend Outlook Score ⭐:
Short-Term (1-2 weeks): 7/10 (Bullish with caution due to overbought signals).
Medium-Term (1-3 months): 8/10 (Supported by central bank demand and inflation fears).
Long-Term (6-12 months): 9/10 (Gold could hit €3200 if trade wars escalate).
⚠️ Trading Alert: News & Position Management
News releases can flip the market faster than a getaway car! 🚗💨
Avoid new trades during high-impact events (e.g., US CPI, Fed speeches).
Use trailing stop-loss orders to lock in profits and protect running positions.
Check economic calendars for updates—Thursday’s macro data could shake things up!
💥 Boost the Heist!
Love this plan? Smash the Boost Button to supercharge our robbery squad! 🚀 Every like and view fuels our mission to conquer the markets. Join the Thief Trading Style crew, steal profits daily, and live the wealthy life! 🤝💖
Stay tuned for the next heist—I’ll be back with another epic plan! 🐱👤🤑

Gold Price Analysis and OutlookOver the past week, the global gold market experienced its steepest correction since last November. Investor sentiment shifted sharply, sending gold prices (XAU/USD) into a freefall and erasing most of the gains accumulated in previous weeks.
📉 Gold Price Movements
- Gold ended the week at around $3,201 per ounce, plunging nearly $122 compared to the previous week — marking the largest weekly drop in six months.
- The decline came as global markets pivoted toward riskier assets following a trade agreement between the U.S. and China, which brought renewed optimism to investors.
- The easing of geopolitical tensions, along with expectations that interest rates will remain steady or rise slightly, led to a waning demand for gold as a traditional safe-haven asset.
🔮 Outlook: Temporary Correction or Start of a Bearish Trend?
- Despite the sharp decline, many experts believe this may only be a technical correction, driven by profit-taking after a strong upward rally in recent weeks.
- Factors such as persistent inflation, rising global debt, and underlying macroeconomic uncertainties continue to support gold’s role as a hedge in investment portfolios.
- In the short term, the gold market will remain sensitive to policy signals from the U.S. Federal Reserve and volatility in the bond market.
🧭 Conclusion
Gold has just endured its worst week in half a year, but that doesn’t necessarily signal the end of its long-term bullish trend. For cautious, long-term investors, the current correction phase could present a valuable opportunity to reposition portfolios at more attractive price levels.

Gold rebounded to the expected position, 3205 short!
📌 Driving Event
The announcement of a 90-day trade truce between the world's two largest economies also helped ease recession concerns in the United States, prompting investors to reduce expectations for aggressive monetary easing by the Federal Reserve (FED). This shift supports the continued rise in U.S. Treasury yields, further suppressing demand for interest-free gold.
📊 Commentary Analysis
Today, the price of gold fell to its lowest point in more than a month. It once hit the lowest level since April 10 at 3120, and then rebounded to the 3200 line, and the volatility increased again!
💰 Strategy Package
Short position:
Actively participate in 3200-3203 points, with a profit target around 3120 points
⭐️ Note: Labaron hopes that traders can properly manage their funds
- Choose a lot size that matches your funds
- Profit is 4-7% of the fund account
- Stop loss is 1-3% of the fund account
