Gold, adjustment is a buying opportunity
📌 Driving events
At the critical moment of the tariff war, there were signs of easing, but the market did not buy it when it came to the gold market. The US policy changed faster than turning a book, which made the market overwhelmed. Therefore, even if the latest US statement was somewhat easing, gold did not fall as a result. The current market is an extreme casino, which depends entirely on whether the correct trading signals and entry timing are grasped in time.
After the tariff war, major investment banks have recently raised their expectations for gold prices this year. Goldman Sachs' latest forecast is that the gold price may rise to $3,700 this year. In extreme cases, the gold price may hit $4,200. This forecast seems unreliable, but it is actually very mysterious. Goldman Sachs' forecasts cannot be all accurate, nor can they be all inaccurate. What does this extreme situation refer to? Obviously, there are only two points, the first is the economy, and the second is the war. Apart from these two points, there is no more significant news that can push the gold price to $4,200.
So, is it possible for the current fundamentals to have the situation predicted by Goldman Sachs? Obviously, there is. The global trade war initiated by Trump will cause all economic turmoil, and the economy will enter an accelerated recession. In addition, the United States attempts to take down Iran in order to control the Middle East and raise oil prices. If a war breaks out in Iran, the Strait of Hormuz, the lifeline of oil in the entire Middle East, will be blocked, and oil may rise to a rare height. This is the purpose of the United States. Once the above two situations occur at the same time, it is not surprising that the price of gold rises to $4,200. Therefore, instead of predicting how much the price of gold will rise, it is better to pay attention to the real-time dynamics of the United States' tariff war and layout in the Middle East.
With 36 trillion U.S. debts hanging over his head, Trump is like a child who is desperate to lose, betting on the credit of the United States. Of course, the United States has the possibility of winning the bet. The tariff war is naturally impossible for the United States to win, but the United States will not lose. In the layout of the Middle East, the United States still has the probability of winning. Although Iran is the strongest combat force in the Middle East, the United States has been deeply involved in the Middle East for many years and has also won almost all the expected goals, and is experienced. The world is calling Trump a madman, a psychopath, and a fool. In my opinion, Trump is not crazy, but may be a king.
📊Commentary Analysis and 💰Strategy
I have said that any pullback in gold is an opportunity to get on board. Buy more when the pullback is big and buy less when the pullback is small. Although it is at a high level and the risk is extremely high, it is all assumptions. The fact is that gold has always been strong. The only thing to remember is that once you are afraid of heights, don't go short. You can be timid and watch the war, but you can't go against the trend.
After the tariff war eased, gold did not fall. After a slight adjustment yesterday, it did not continue the decline. It is now strong again and stands above 3230. It rose sharply due to the tariff war, but it did not fall sharply due to the easing of tariffs. There must be a reason. In terms of technical trends, gold 3190 area forms a new support platform, and the 4-hour level forms a high-level shock pattern. This high-level shock pattern is still bullish. Once it breaks through, it will start a new wave of upward trend. At present, the trend is good and the bullish trend remains unchanged.
The market fluctuates rapidly. We have already entered long orders near 3210 in the morning. Any intraday retracement support level is a long opportunity. We should grasp it flexibly.
⭐️ Note: Labaron hopes that traders can properly manage their funds
- Choose the number of lots that matches your funds
- Profit is 4-7% of the fund account
- Stop loss is 1-3% of the fund account
Goldlongsetup

XAUUSD Technicals & FundamentalsA classic range-bound consolidation with a potential breakout setup forming.
🔧 Key Technical Levels:
Resistance: Around $3,280 — if price breaks this cleanly, bulls could push for a strong continuation.
Immediate Resistance Zone: $3,240–3,245
Support: Around $3,220 (key short-term structure)
Pivot Zone: Near $3,200–3,190 — a break below here could signal deeper downside toward $3,160
Volume: Noticeably dropping (marked by the red arrow), which often precedes a strong move. Low volume = indecision = potential volatility spike incoming.
🧠 Chart Pattern Insight:
A bullish flag/pennant type setup is visible — consolidation after an impulsive uptrend.
Arrows indicate the two primary scenarios:
📈 Upside: Break above $3,245 with volume could trigger a run toward $3,280+
📉 Downside: Break below $3,220 could drag price down to retest pivot zones or even $3,160
📰 Fundamental Factors to Watch Today:
📅 Key Events/Data Releases:
U.S. Economic Data:
Retail Sales (March) — A surprise in consumer spending could sway USD and gold.
Empire State Manufacturing Index — May affect interest rate expectations indirectly.
Fed Speak: Any comments by FOMC members on inflation, rate hikes, or balance sheet could jolt markets.
⚖️ Sentiment Snapshot:
Short-term: Neutral to bullish (sideways consolidation near highs)
Medium-term: Bullish bias remains intact above $3,200
Volatility Risk: High — expect fakeouts before a confirmed breakout.

Long towards 3244.00 area a quick one.Expecting Gold to push towards 3244 area... it will be a very quick one immediate the market opens.

GOLD Ready to Break Highs Again! 🔥 3058 Level in Sight – Are You Ready? 🔥
📊 Market is following H4 Structure
📈 H4 BMS & OB in Play – Strong Momentum Building!
For detailed analysis & real-time updates, follow our TradingView page! 📍📩

GOLD H1 Pro Levels Chart Update by FMPIn this chart you will find trend continuation levels of gold including psychological levels, blind structure levels with 3080 sequences

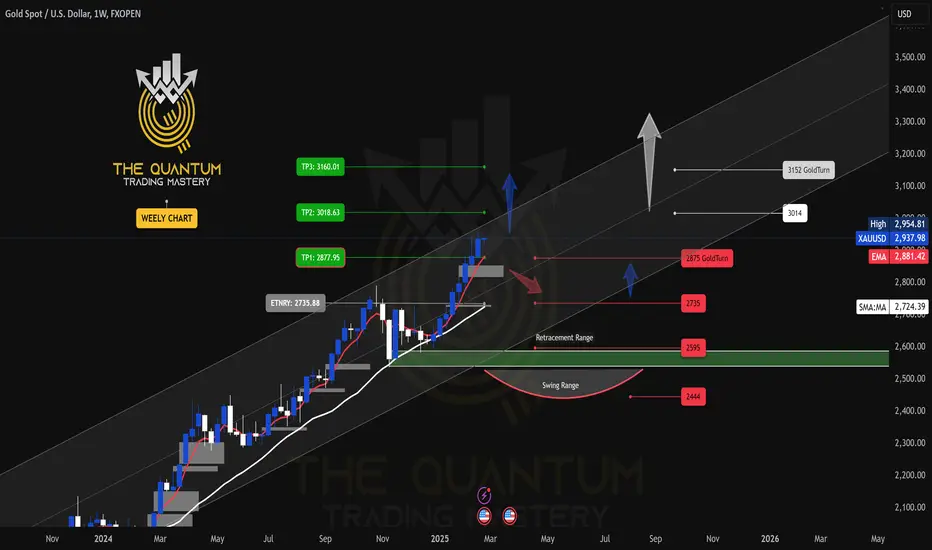
GOLD WEEKLY CHART MID/LONG RANGE ROUTE MAP UPDATEDWeekly GOLD Analysis: 17th February 2025
Hello Traders,
Here’s a weekly chart analysis of GOLD, offering an in-depth look at recent market trends and future outlook. Since October 2023, our consistent tracking has achieved 100% target accuracy, as shown by the Golden Circle markers on the charts. Let’s break down the highlights and what’s next.
Recap of Last Week’s Successes
Weekly Chart Highlights:
* EMA5 crossed and settled above Entry ✅ 2735 reached
* Bullish Target TP1: 2877 ✅ Achieved
* GoldTurn Levels at 2875 activated twice ✅ Reached
What’s Next for GOLD? Bullish or Bearish?
After hitting ENTRY LEVELS at 2735 and TP1 2877, we saw a small close above 2877 last week, leaving 3018 open as a potential target. We mentioned that an EMA5 lock would confirm this movement.
While EMA5 hasn’t locked yet, the close from last week provided a solid push upward, gaining over 500 pips. The long-term gap remains open, with more movement likely after last week’s candle body close.
Key Level: 2735 remains a critical zone.
GoldTurn Levels at 2875 and 2735 are active, and the price may revisit these levels before bouncing back to reach TP1 and beyond.
Recommendations & Strategy:
* Focus on EMA5: Watch its behavior around 2877 for key signals on short- and long-term trades.
* Support Levels: GoldTurn levels at 2875 and 2735 are vital for identifying reversal points and prime dip-buying opportunities.
* FVG Support: A range between 2835 and 2850 is also supportive.
For precise entry and exit points, check our daily, 12H, 4H, and 1H analyses for clearer market guidance.
We’ll continue to provide daily updates, insights, and strategies on our TradingView and YouTube channels every Sunday. Don’t forget to like, comment, and share to support our work and help others benefit!
The Quantum Trading Mastery

GOLD WEEKLY CHART MID/LONG RANGE ROUTE MAP UPDATEDWeekly GOLD Analysis: 24th February 2025
Hello Traders,
Here’s a weekly chart analysis of GOLD, offering an in-depth look at recent market trends and future outlook. Since October 2023, our consistent tracking has achieved 100% target accuracy, as shown by the Golden Circle markers on the charts. Let’s break down the highlights and what’s next.
Gold reached an all-time high of $2,954.80 last week. As previously noted, close attention to the movement of the 5-day Exponential Moving Average (EMA5) was advised. The anticipated Fair Value Gap (FVG) provided strong support at $2,850, with the EMA5 approaching the first take-profit (TP1) level at $2,877, leading to a bullish surge that touched the all-time high. However, the EMA5 has yet to cross and stabilize above $2,877.
This situation persists, with the EMA5 still not locked above $2,877, which is necessary for further bullish confirmation. If the EMA5 fails to cross and hold above this level, the price may reverse to test the GoldTurn level at $2,875 before potentially bouncing back upward.
The key level at $2,735 remains a critical zone. Active GoldTurn levels at $2,875 and $2,735 suggest that the price may revisit these areas before advancing to TP1 and beyond.
Recommendations & Strategy:
* Focus on EMA5: Watch its behavior around 2877 for key signals on short- and long-term trades.
* Support Levels: GoldTurn levels at 2875 and 2735 are vital for identifying reversal points and prime dip-buying opportunities.
* EMA5 detachment is still due on weekly chart.
For precise entry and exit points, check our daily, 12H, 4H, and 1H analyses for clearer market guidance.
We’ll continue to provide daily updates, insights, and strategies on our TradingView and YouTube channels every Sunday. Don’t forget to like, comment, and share to support our work and help others benefit!
The Quantum Trading Mastery
GOLD ROUTE MAP UPDATEHey Everyone,
Another awesome day on the markets with our Bullish targets getting smashed.
After completing all targets upto 3078 yesterday, we continued to get candle body close breakouts above 3078 opening 3094 and above 3094 opening 3119 and then ema5 lock above 3119 confirmed 3148 for the perfect finish to this chart idea.
We can now move over to our 4H chart idea and our remaining multi timeframe route maps to continue to track the movement for the rest of the week.
We will continue to buy dips using our support levels taking 30 to 40 pips. As stated before each of our level structures give 20 to 40 pip bounces, which is enough for a nice entry and exit. If you back test the levels we shared every week for the past 24 months, you can see how effectively they were used to trade with or against short/mid term swings and trends.
BULLISH TARGET
3055 - DONE
EMA5 CROSS AND LOCK ABOVE 3055 WILL OPEN THE FOLLOWING BULLISH TARGET
3078 - DONE
EMA5 CROSS AND LOCK ABOVE 3078 WILL OPEN THE FOLLOWING BULLISH TARGET
3094 - DONE
EMA5 CROSS AND LOCK ABOVE 3094 WILL OPEN THE FOLLOWING BULLISH TARGET
3119 - DONE
EMA5 CROSS AND LOCK ABOVE 3119 WILL OPEN THE FOLLOWING BULLISH TARGET
3148 - DONE
BEARISH TARGETS
3034 - DONE
EMA5 CROSS AND LOCK BELOW 3034 WILL OPEN THE FOLLOWING BEARISH TARGET
3015 - DONE
EMA5 CROSS AND LOCK BELOW 3015 WILL OPEN THE FOLLOWING BEARISH TARGET
2999 - DONE
EMA5 CROSS AND LOCK BELOW 2999 WILL OPEN THE FOLLOWING BEARISH TARGET
2975 - DONE
EMA5 CROSS AND LOCK BELOW 2975 WILL OPEN THE SWING RANGE
SWING RANGE
2950 - 2922
As always, we will keep you all updated with regular updates throughout the week and how we manage the active ideas and setups. Thank you all for your likes, comments and follows, we really appreciate it!
Mr Gold
GoldViewFX

30-minute candlestick chart on Gold (XAU/USD)Market Structure Labels:
CHoCH: Change of Character – indicates a shift in trend direction.
BOS: Break of Structure – confirms a continuation in trend direction.
Price Zones:
Supply Zone (Red Rectangle): Price area near the 3,114 level, where selling pressure may exist.
Demand Zones (Blue Rectangles): Areas around 3,052 and 2,950 levels where buying pressure may step in.
EQH (Equal Highs): Indicates potential liquidity resting above that high, possibly a target for price.
Weak Low: Marked below 2,950, suggesting it's vulnerable and may be swept.
Current Price Action:
Price is currently at 3,082, up 3.35% for the session.
A recent CHoCH to the upside, followed by a BOS, suggests bullish intent.
The price appears to be pulling back into a smaller demand zone (~3,064–3,052 area).
Forecasted Move (Blue Arrow):
The trader anticipates a short-term dip into the highlighted demand zone.
After tapping into demand, price is expected to bounce and move back up toward the supply zone, potentially testing or breaking the EQH around 3,114.
Trade Setup (Marked Zone):
Entry Zone: Around the demand area (~3,064–3,052).
Target Zone: Toward the top red zone (~3,114).
Risk Zone: Below 3,052.

Gold Analysis April 7The D1 candle on Friday clearly identified selling pressure and the amount of fomo pushed the price to 2972.
The H4 structure is still showing that the downward force will continue to be maintained when 3054 was rejected by the buyers.
Back to the trading plan The 3018 and 3035 border areas are considered sideways compression borders. If the price breaks 3018, wait for a retest and sell to 3003. If the US session breaks 3003, then push to 2955.
If the 3018 border remains strong, wait for a break of 3035 to BUY to the exchange price zone of 3054. BUY signals for short-term city and are considered to be against the trend at the moment. When the US session fails to break 3055, you can sell and hold long. If it breaks 3055, waiting for 3080 to sell will be safer than fomo to BUY against the trend.

XAU/USD potential Longs from 2990 back up to 3,100This week, I’m considering both short- and long-term opportunities on gold. We’ve recently seen a change of character to the downside, and there’s a clean 1-hour supply zone that could trigger a short-term bearish reaction.
That said, there’s also a lot of nearby liquidity resting below, which I expect price to sweep first. If that happens, I’ll be watching the 20-hour demand zone—a strong area that could spark a new bullish rally from the lows.
Confluences for GOLD Buys:
- Price has recently cleared a new all-time high (ATH), indicating continued bullish strength.
- Market structure remains overall bullish, suggesting this move down may be a temporary correction.
- The 20-hour demand zone sits just below key liquidity and looks highly valid.
- Untouched Asia session highs remain above, which price is likely to target.
- The DXY is moving bearish, aligning with a bullish outlook on gold due to their inverse correlation.
Note: If price reacts from the current demand zone (which is also valid), we could see Scenario B play out first—a rally followed by a short move to clear liquidity before heading higher.
Stay patient and trade safe, everyone!

GBPJPY APRILIsland v Island, which will you choose?
We buying this son of a bullion. Ultra short on the YEN. Don't ask me why. Sell peaks, because you never go all in on an island.

How will gold perform after the super rollercoaster market?Gold's 1-hour moving average still shows signs of turning downwards. Although gold bulls have made a strong counterattack, it is also because of the risk-aversion news that stimulated a retaliatory rebound. However, gold continued to fall after rising, and gold began to return to volatility. In the short term, gold is supported near 3100. If gold falls below the support near 3100 again, then gold shorts will still have an advantage in this war. Overall, the impact of today’s non-agricultural data is expected to be dim. What is more important is the stimulation of the news. However, it may be noted that if gold holds the 3100 mark for a long time, then gold is expected to fluctuate upward above 3100.
Trading idea: short gold near 3115, stop loss 3125, target 3100
The above is purely a sharing of personal views and does not constitute trading advice. Investments are risky and you are responsible for your profits and losses.

Gold - Looking To Buy Dips In The Short TermH1 - Bullish trend pattern in the form of higher highs, higher lows structure
Strong bullish momentum
Expecting retraces and further continuation higher until the two Fibonacci support zones hold.
If you enjoy this idea, don’t forget to LIKE 👍, FOLLOW ✅, SHARE 🙌, and COMMENT ✍! Drop your thoughts and charts below to keep the discussion going. Your support helps keep this content free and reach more people! 🚀
--------------------------------------------------------------------------------------------------------------------
Disclosure: I am part of Trade Nation's Influencer program and receive a monthly fee for using their TradingView charts in my analysis.

GOLD DAILY CHART MID/LONG TERM UPDATEGOLD Daily Chart Update: 24th FEB 2025
Hi Everyone,
Here’s the latest update on the GOLD daily chart, which we've been closely monitoring and trading. Below, we break down recent price movements, updated key levels, and provide actionable insights for the days ahead.
Recap of Recent Chart Success!
Gold recently achieved a record high of $2,954.80. Our analysis has consistently highlighted that after reaching each target level, prices tend to reverse by over 40+ pips to the GoldTurn level. This pattern was evident when, after hitting TP3 at $2,933, the price retraced more than 40+ pips to the GoldTurn level at 2870, which acted as a support, before rebounding bullishly to surpass resistance and reach the all-time high of $2,954.81.
Current Outlook: Bullish or Bearish?
Presently, gold's price is oscillating between a resistance gap at $2,990 and a support gap at $2,933. The $2,990 level serves as a key resistance, while $2,933 acts as support. Additionally, the Fair Value Gap (FVG) offers support at $2,920.
In summary, while the long-term outlook remains bullish due to factors like central bank demand and economic uncertainties, short-term fluctuations between the $2,933 support and $2,990 resistance levels are expected. Traders should monitor these key levels and indicators closely to inform their strategies.
KEY LEVEL: 2870
Resistance Levels: 2990, 3052
Support Levels (GoldTurn Levels): 2933, 2870, 2801, 2744, 2671, 2595
EMA5 Behavior:
* Or If EMA5 crosses and locks above 2933, it strengthens the bullish case.
* If EMA5 fails to hold above 2933, cross and lock below this level 2933, expect a pullback to key GOLDTURN levels below.
Recommendations:
* Capitalize on Dip Opportunities: Use smaller timeframes (1H, 4H) to trade around GOLDTURN levels, targeting 30–40 pips per trade.
* Stay focused on shorter trades in this range-bound market to manage volatility effectively.
Long-Term Bias:
Maintain a bullish outlook while viewing pullbacks as buying opportunities.
Accumulate positions near key support levels for a safer approach instead of chasing highs.
Final Note:
Trade with confidence and precision. Our analysis ensures you’re well-prepared to navigate the evolving market landscape. Stay updated with our daily insights across multiple timeframes for deeper clarity.
Thank you for your continued trust! Don’t forget to like, share, and comment to support our work.
Best regards,
The Quantum Trading Mastery Team

GOLD 12H CHART ROUTE MAP ANALYSIS FOR THE WEEKGOLD 12H CHART UPDATE: 24th FEB 2025
Hello Everyone,
Here’s the latest 12H GOLD chart update, offering a thorough review of recent price movements and key insights for the upcoming sessions. Since October 2023, our careful tracking has maintained 100% target accuracy, as reflected by the Golden Circle markers on the charts. Let’s explore the highlights and what lies ahead.
* Gold touched ATH last week at 2954.81
* Gold price has been fluctuating between two weighted level above with a gap 2948 and with a gap below 2903 the whole week. The Resistance 2948 and support level 2903 reacted well.
What is next for GOLD?
* Resistance Levels: 2948, 2993, 3041, 3092
* Support Levels (GoldTurn Levels): 2900, 2856, 2813, 2770, 2710, 2664, 2599
* FVG is providing strong support at 2920 which might push price bullish
EMA5 Behavior (Red Line):
Current EMA5: 2937.47
Bullish Targets
EMA5 cross and lock Above 2948, will open the following bullish target 2993
EMA5 cross and lock Above 2993, will open the following bullish target 3041
EMA5 cross and lock Above 3141, will open the following bullish target 3092
Bearish Targets
EMA5 hold and cross Below 2900: will open the following bearish target 2856
EMA5 cross and lock Below 2856: will open the following bearish target 2813
EMA5 cross and lock Below 2813: will open the following bearish target 2770
EMA5 cross and lock Below 2770: will open the following bearish target 210
EMA5 cross and lock Below 2710: will open the following bearish target 2664 (Retracement Range)
Long-Term Outlook:
Maintain a bullish bias while using pullbacks as buying opportunities.
Buying near key support levels ensures better entry points and mitigates risks, avoiding the pitfalls of chasing tops.
Trade with precision, discipline, and confidence. Our accurate, multi-timeframe analysis equips you to navigate the market effectively. Stay updated with daily insights to remain ahead of market trends.
We appreciate your support! Don’t forget to like, comment, and share this post to help others benefit.
Best regards,
📉💰 The Quantum Trading Mastery Team

Will Gold Break 3000? (Potential Bullish Continuation)Gold price seems to exhibit signs of overall bullish continuation on the Longer Timeframes as the price action may break the previous All Time High of 2956.
A potential break may be indicative of another top OR a new high.
We take our chance on the basis of a proper Bullish Breakout.
Trade Plan :
Entry @ 2967
Stop Loss @ 2822
TP 1 @ 3112

GOLD 1H CHAR ROUTE MAP & TRADING PLAN FOR THE WEEKGOLD 1H Chart – 12th Feb 2025
Dear Traders,
Here’s the latest 1H chart analysis, outlining key levels and targets for the week.
Gold is currently trading between two critical levels, with a gap above 2905 and below 2883. A confirmed EMA5 crossover and lock above or below these levels will indicate the next price direction. Until then, expect price fluctuations as these levels are tested repeatedly.
Keep in mind that Inflation and CPI data are due today and tomorrow. While fundamental analysis plays a role in predicting gold's movement, our advanced technical analysis is essential for precise entry and exit points during these volatile geopolitical times.
Our strategy remains focused on buying dips and monitoring key levels to identify potential bounce opportunities. Stay sharp!
Resistance Levels: 2905, 2920, 2942, 2963, 2982, 3001, 3021, 3043
Support Levels: Gold Turn Levels : 2883, 2852, 2837, 2817,
Retracement Range: 2802 - 2817
Swing Range: 2747
EMA5 (Red Line) Analysis:
* Currently fluctuating between 2886 and 2905
* EMA5 positioning will be crucial in determining the next trading direction.
Bullish Targets:
EMA5 cross and lock Above 2905 → will open the following bullish Target 2920 ✅Done
EMA5 cross and lock Above 2920 → will open the following bullish Target 2942 ✅Done
EMA5 cross and lock Above 2942 → will open the following bullish Target 2963
EMA5 cross and lock Above 2963 → will open the following bullish Target 2982
EMA5 cross and lock Above 2982 → will open the following bullish Target 3001
EMA5 cross and lock Above 3001 → will open the following bullish Target 3021
EMA5 cross and lock Above 3021 → will open the following bullish Target 3043
Bearish Targets:
EMA5 cross and lock Below 2883 → will open the following bearish Target 2852
EMA5 cross and lock Below 2852 → will open the following bearish Target 2837
EMA5 cross and lock Below 2837 → will open the following bearish Target 2817
EMA5 cross and lock Below 2817 → will open the following bearish Target 2802 (Retracement Range)
EMA5 cross and lock Below 2802 → will open the following bearish Target 2747 (Swing Range)
Trading Plan:
* Stay bullish and buy pullbacks from key levels.
* Avoid chasing tops—focus on buying dips.
* Use smaller timeframes for entries at Goldturn levels.
* Aim for 30–40 pips per trade for optimal risk management.
* Each level can yield 20–40+ pips reversals.
Trade with confidence and discipline. Stay tuned for our daily updates! Please support us with likes, comments, and follows to keep these insights coming.
📉💰 The Quantum Trading Mastery

GOLD 1H CHAR ROUTE MAP & TRADING PLAN FOR THE WEEKGOLD 1H Chart – 17th Feb 2025
Dear Traders,
Here’s the latest 1H chart analysis, outlining key levels and targets for this week trading plan
Gold is currently trading between two critical levels, with a gap above 2905 and below 2878. A confirmed EMA5 crossover and lock above or below these levels will indicate the next price direction. Until then, expect price fluctuations as these levels are tested repeatedly.
Keep in mind that Its president day today in the US and market will remain close today.
Our strategy remains focused on buying dips and monitoring key levels to identify potential bounce opportunities. Stay sharp!
Resistance Levels: 2905, 2920, 2942, 2949, 2972, 2994, 3011
Support Levels: Gold Turn Levels : 2878, 2852, 2837, 2817, 2802, 2776, 2747
Retracement Range: 2802 - 2817
Swing Range: 2747
GOLDTURN LEVELS ARE ACTIVATED!
EMA5 (Red Line) Analysis:
* Currently fluctuating between 2878 and 2905
* EMA5 positioning will be crucial in determining the next trading direction.
Bullish Targets:
EMA5 cross and lock Above 2910 → will open the following bullish Target 2928
EMA5 cross and lock Above 2928 → will open the following bullish Target 2949
EMA5 cross and lock Above 2949 → will open the following bullish Target 2972
EMA5 cross and lock Above 2972 → will open the following bullish Target 2994
EMA5 cross and lock Above 2994 → will open the following bullish Target 3011
Bearish Targets:
EMA5 cross and lock Below 2878 → will open the following bearish Target 2852
EMA5 cross and lock Below 2852 → will open the following bearish Target 2837
EMA5 cross and lock Below 2837 → will open the following bearish Target 2817
EMA5 cross and lock Below 2817 → will open the following bearish Target 2802 (Retracement Range)
EMA5 cross and lock Below 2802 → will open the following bearish Target 2747 (Swing Range)
Trading Plan:
* Stay bullish and buy pullbacks from key levels.
* Avoid chasing tops—focus on buying dips.
* Use smaller timeframes for entries at Goldturn levels.
* Aim for 30–40 pips per trade for optimal risk management.
* Each level can yield 20–40+ pips reversals.
Trade with confidence and discipline. Stay tuned for our daily updates! Please support us with likes, comments, and follows to keep these insights coming.
📉💰 The Quantum Trading Mastery

3.26 Technical analysis of short-term gold operationsGold is still supported by risk aversion, but it quickly fell back after rising. In fact, the support of safe-haven gold is not surprising. However, since the gold bulls did not continue, it means that the space for gold bulls is also limited. Gold rose and fell in the US market. Gold was directly short at 3032. Gold fell as expected. The US market rebounded high and was still short.
Gold's 1-hour moving average is still in a downward dead cross. Gold bulls cannot reverse the situation. Gold fell directly to 3035 in the US market under pressure.
Support level: 3018 3005 3000
We will update regularly every day and introduce to you how we manage active ideas and settings. Thank you for your likes, comments and attention, we are very grateful

Gold focuses on suppression near 3038 aboveThe hourly chart suppression point of gold is around 3038. As long as the trend line is not stable, gold may still retreat. At present, we need to pay attention to whether 3038 can be stabilized. As long as you do not stand firmly above this position, you can rely on the 3030-40 range to go short.

GOLD ALERT | BIG DROP LOADING!🏦 Institutions Are Taking Profits – Are You Ready for the Next Move?
For the last 4 weeks, institutions have been reducing their long positions on #GOLD ( OANDA:XAUUSD ). This is exactly what I warned about – profit-taking from big players, signaling potential downside ahead.
technical down

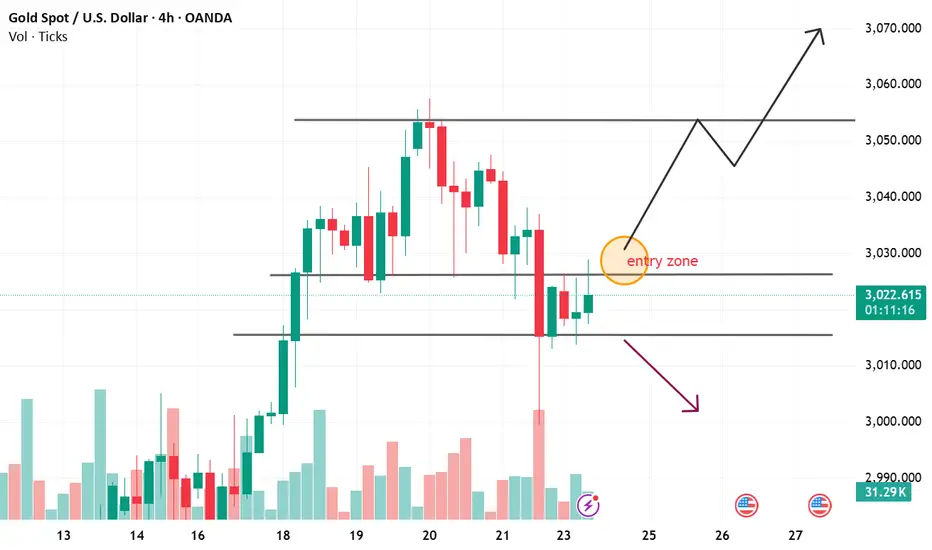
Gold (XAUUSD)📈 Current Price: $3,024.155 (+0.15%)
⏳ Timeframe: 4H (OANDA)
Volume: 27.16K
🔍 Technical Analysis
Entry Zone Identified ($3,030)
Gold is currently in a critical decision zone at $3,030, marked as the "Entry Zone."
If price breaks above this level with strong volume, it could rally towards $3,050–$3,070.
Key Resistance: Around $3,070 (previous highs).
Potential Rejection & Downside Risk
If gold fails to break the entry zone and faces rejection, it could decline towards $3,010 or even $3,000.
Support: Strong demand zone around $3,010; further support at $2,990.
Projected Move
The chart suggests a bullish breakout if gold holds above the entry zone.
Expected Upside: → $3,050 → $3,070
Bearish Scenario: If rejected, watch for a drop to $3,010 → $3,000.
🌎 Fundamental Drivers (Recent News & Market Sentiment)
📊 Fed's Rate Decision & Inflation Outlook
Fed Chair Jerome Powell has hinted at potential rate cuts by mid-2025, citing slowing inflation.
A dovish Fed stance is bullish for gold, as lower interest rates weaken the dollar and boost demand for non-yielding assets like gold.
📉 U.S. Dollar Weakness & Bond Yields
The U.S. Dollar Index (DXY) has softened, making gold more attractive to international buyers.
10-Year Treasury Yields remain volatile, but any decline favors gold.
📈 Geopolitical Tensions & Safe-Haven Demand
Rising concerns over Middle East conflicts and China-Taiwan tensions have increased demand for gold as a safe-haven asset.
Central banks (including China and India) continue to accumulate gold reserves, adding upward pressure on prices.
🏛️ Central Bank Buying
Reports indicate that China’s PBOC (People’s Bank of China) has increased gold reserves for the 17th consecutive month.
BRICS nations are also accumulating gold, signaling de-dollarization trends that could further boost prices.
🔮 Conclusion: What’s Next for Gold?
Short-Term View:
Bullish Above: $3,030, targeting $3,050–$3,070.
Bearish Below: If rejected, expect $3,010–$3,000 retest.
Long-Term View:
Given macroeconomic trends (Fed policy shift, central bank buying, geopolitical risks), gold remains in a strong uptrend.
If the Fed confirms rate cuts, $3,100+ levels become realistic in Q2 2025.
🚀 Gold traders should closely monitor the $3,030 entry zone for confirmation of a breakout or rejection. 🚀