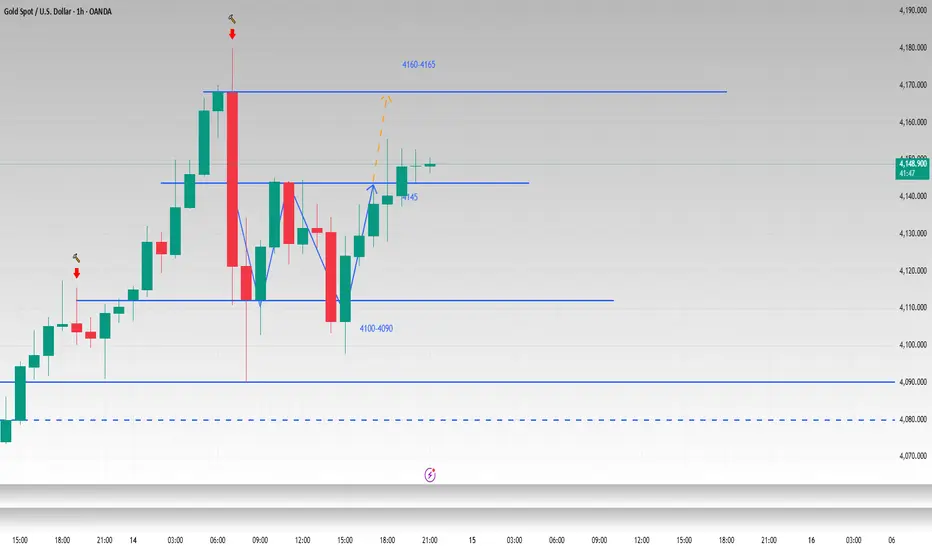
W pattern is established and the bullish pattern remain unchangeI have said before that gold is in a fluctuating upward state whether viewed from the weekly or daily charts, and there is no reversal signal. I mentioned in my previous post that from the hourly chart, gold has the prototype of a W shape, and the neckline is at 4145. In the evening of the US session, gold successfully broke through the neckline and touched around 4155. Although the bullish momentum of gold has stagnated slightly after a slow rise, I am still optimistic that gold will reach 4160-4165. If it falls back to around 4145-4135 again, we can still consider trying to go long on gold.
OANDA:XAUUSD
Goldlongsetup
Gold rebounds, uptrend intact1. Market Overview
After a brief dip to $4090, gold (XAU/USD) quickly rebounded strongly to around $4125, showing that buying pressure is still dominant.
Safe-haven demand remains solid as the USD stabilizes and U.S. Treasury yields ease slightly.
However, traders are now more cautious after the previous sharp volatility, keeping gold in a short-term accumulation phase around $4110–$4130.
2. Technical Analysis
• Near Resistance: $4132 – $4140
• Strong Resistance: $4155 – $4168
• Near Support: $4105 – $4090
• Deep Support: $4078 – $4060
• RSI (H1): 58 – Neutral, slightly bullish bias
• EMA20 (H1): $4110 – Trending upward, acting as dynamic support
• Price Structure: Higher low on H1 → confirms continuation of the bullish trend
3. Outlook
Gold remains in a strong bullish structure, and the recent decline is seen as a technical pullback for reaccumulation.
If the price holds above $4110, gold is likely to continue rising toward $4140–$4155 in the next sessions.
Conversely, a break below $4090 would signal a deeper correction toward $4075.
4. Trading Strategy
🔺 BUY XAU/USD
Entry: 4110 – 4105
🎯 TP: 40 / 80 / 200 pips
🛑 SL: 4100
🔻 SELL XAU/USD
Entry: 4150 – 4155
🎯 TP: 40 / 80 / 200 pips
🛑 SL: 4159

XAUUSD Delivered Excellent profits [ 1600 pips ]Thanks to those traders who followed us and made profits 📈🙏 keep grinding 💪.
I booked profits on buying orders during last 2 days session, entering around 4060-and exiting near 4120, while my shorter-term longs hit the 4130 target on today’s Tokyo session hike.
Going forward, I’ll continue buying dips from my key entry zones as long as Gold holds above the bullish trend till 4400
Also I took buy 3980 and exit 4130.

Gold’s Bull Run Continues – Target $4,080+Gold is clearly maintaining strong bullish momentum above $4,000. The market has maintained its upward trajectory since rebounding from the $3,900–$3,920 support zone. This zone acted as a solid demand area, leading to consistent higher highs and higher lows — a clear indication that buyers are dominating.
The recent price action shows a clean breakout above the $3,980–$4,000 resistance area, which has now turned into a new short-term support. The chart also marks a “Weak High” near the current level, suggesting that a minor pullback or consolidation could occur before another bullish push resumes. This retracement could test around $4,010–$4,020 before aiming higher.
The next major resistance levels are visible at $4,060, $4,075, and potentially $4,080–$4,100, which could be the next targets if bullish momentum continues. As long as gold stays above $4,000, the overall market bias remains positive. A sustained break below this zone might trigger a deeper correction toward $3,960 or even $3,940, but that currently looks less likely given the strong bullish structure.
In summary, the short-term outlook remains bullish with expectations of a possible brief dip before continuation toward $4,080+. The trendline support and consistent break of minor resistances confirm strong buyer confidence in the market.
Strong bullish trend continues
Key resistance: $4,072 → $4,132 → $4,150
Support to watch: $3,976 → $3,925
🔹 Buy Zone:
A potential buy zone lies between $4,010 – $4,025, where a short retracement is expected before the next upward move. This area aligns with minor structure support and trendline confluence, making it ideal for re-entry or fresh long positions.
🔹 Buy Trigger:
A strong buy trigger would be a bullish 1-hour candle closing above $4,045, confirming momentum continuation toward the next resistance targets at $4,065, $4,075, and $4,080+.
Note
Please risk management in trading is a Key so use your money accordingly. If you like the idea then please like and boost. Thank you and Good Luck!

Gold hits new high at $4180, correction risk rising1. Market Overview
During the mid-day session on October 14, gold prices (XAU/USD) continued their upward momentum, reaching $4180/oz, setting a new all-time high.
The main drivers remain expectations of a Federal Reserve policy easing and strong safe-haven demand amid rising geopolitical tensions.
However, after breaking above $4175 and testing $4180, the market is showing signs of mild profit-taking, indicating that bullish momentum is temporarily slowing.
2. Technical Analysis
• Strong Resistance: $4180 – $4192
• Near Support: $4165 – $4158
• Deep Support: $4142 – $4130
• RSI (H1): 81 – Clearly overbought
• EMA20 (H1): $4158 – Acting as dynamic support
• Candlestick Pattern: Consecutive long upper wicks near $4175–$4180 → signal short-term correction pressure.
3. Outlook
Gold continues to hold a very strong bullish trend, but the risk of a technical correction is rising as the market becomes heavily overbought across multiple timeframes.
The $4180–$4192 zone now serves as a key short-term resistance area that may trigger selling pressure.
If the price fails to close an H1 candle above $4180, a pullback toward $4165–$4155 is likely.
Conversely, a break above $4192 with strong volume could push gold toward $4205–$4215 in the short term.
4. Trading Strategy
🔺 BUY XAU/USD: $4158 – $4155
🎯 TP: 40 / 80 / 200 pips
🛑 SL: $4152
🔻 SELL XAU/USD: $4190 – $4193
🎯 TP: 40 / 80 / 200 pips
🛑 SL: $4196

Gold rebounds – Market eyes the $4090–$4100 target📊 Market Overview:
After hitting a new record high at $4,078/oz, gold briefly pulled back to $4,067 before rebounding to $4,075, showing strong buying interest 💰.
Risk aversion remains elevated amid ongoing US–China trade tensions and geopolitical uncertainty.
🧭 Technical Analysis:
• Trend: Strong bullish on H1–H4
• EMA: Price remains above EMA20–50 cluster → short-term uptrend intact
• Resistance: $4,078 – $4,095
• Support: $4,060 – $4,048
• Candle pattern: Bullish rejection candle near $4,067 confirms active buyers
• Momentum: RSI near 68 – strong, not yet overbought
💡 Outlook:
Gold is retesting the $4,078 peak; if an H1 candle closes firmly above it, the next target lies at $4,090–$4,100 🎯.
Otherwise, a short-term pullback toward $4,060–$4,050 could occur before another rally attempt.
________________________________________
🔺 BUY XAU/USD
Entry: $4.069 – $4.072
🎯 TP: 40 / 80 / 200 pips
🛑 SL: $4.066

GOLD (XAUUSD): Bullish! IRL To ERL! Look For Buys!In this Weekly Market Forecast, we will analyze the Gold (XAUUSD) for the week of Oct. 13-17th.
Gold is bullish on all HTFs. Selling is not an option. Moving from IRL to ERL. Only buys are valid.
Enjoy!
May profits be upon you.
Leave any questions or comments in the comment section.
I appreciate any feedback from my viewers!
Like and/or subscribe if you want more accurate analysis.
Thank you so much!
Disclaimer:
I do not provide personal investment advice and I am not a qualified licensed investment advisor.
All information found here, including any ideas, opinions, views, predictions, forecasts, commentaries, suggestions, expressed or implied herein, are for informational, entertainment or educational purposes only and should not be construed as personal investment advice. While the information provided is believed to be accurate, it may include errors or inaccuracies.
I will not and cannot be held liable for any actions you take as a result of anything you read here.
Conduct your own due diligence, or consult a licensed financial advisor or broker before making any and all investment decisions. Any investments, trades, speculations, or decisions made on the basis of any information found on this channel, expressed or implied herein, are committed at your own risk, financial or otherwise.

Gold hits new ATH at $4,078 – Bullish momentum remains strong📊 Market Overview:
Gold extended its rally on Monday, October 13, reaching a new all-time high at $4,078/oz before retracing slightly to $4,060. Safe-haven demand driven by escalating US–China trade tensions and global uncertainty continues to support the precious metal. Gold ETFs recorded their strongest inflows in the past three weeks.
🧭 Technical Analysis:
• Main trend: Strong bullish (H1–H4)
• EMA: Price firmly above EMA20–50 cluster → sustained uptrend
• Resistance: $4,080 – $4,095
• Support: $4,050 – $4,032
• Candle pattern: Strong bullish rejection candle near $4,050 (buyers still dominant)
• Momentum: RSI holding above 65, no clear overbought signal yet
💡 Outlook:
Momentum remains solid; gold may retest $4,080–$4,100 soon, especially if the USD weakens during the US session. However, traders should stay cautious around this resistance area due to potential technical pullbacks.
🔺 BUY XAU/USD
Entry: $4,057 – $4,060
🎯 TP: 40 / 80 / 200 pips
🛑 SL: $4,054

Gold vs Dollar – Bullish Confirmation & Risk Management PlanXAU/USD "The Gold vs US Dollar" - Metal Market Cash Flow Management Strategy ⚡ (Swing/Day Trade)
📊 Trading Plan:
✅ Bias : Bullish confirmation spotted as Hull Moving Average shows an upside pullback trend.
✅ Entry Idea : Flexible entry with layering strategy (scaling in with multiple limit orders) :
$3650
$3660
$3670
$3680
( You can add more layers depending on your risk and strategy preference. )
🛡️ Risk Management:
Suggested Protective Stop Loss : around $3630 (after breakout levels).
⚠️ Note : Please adjust SL based on your personal strategy and risk tolerance — this is not a fixed recommendation.
🎯 Target Outlook:
Short-term resistance expected near $3740 (where moving averages converge + overbought conditions may trigger profit-taking traps).
Idea: secure profits before market reversals.
⚠️ Note : Target levels are flexible. You can adjust according to your own plan and market conditions.
🔑 Key Points:
Hull MA Pullback → signals bullish continuation.
Layered Entry → improves average price & manages volatility.
Exit Discipline → respect your risk plan, don't rely solely on posted SL/TP.
🔗 Related Pairs to Watch (Correlation & Flow):
🟢 OANDA:XAGUSD (Silver/USD) → Often moves in tandem with gold, can confirm metal market strength.
🟢 TVC:DXY (US Dollar Index) → Inverse correlation with gold; weak USD = stronger gold.
🟢 FX:EURUSD → Euro strength usually aligns with gold bullish momentum.
🟢 FX:USDJPY → Safe-haven flows: when JPY strengthens, gold tends to follow.
✨ “If you find value in my analysis, a 👍 and 🚀 boost is much appreciated - it helps me share more setups with the community!”
#XAUUSD #Gold #Forex #DayTrading #SwingTrading #HullMA #TradingStrategy #RiskManagement #Metals #FXAnalysis #DXY #TechnicalAnalysis

Gold - Just buy the all time high!🔱Gold ( TVC:GOLD ) will rally even higher:
🔎Analysis summary:
Gold remains totally bullish. And after the recent all time high breakout rally of about +15%, traders are willing to accept much higher prices. Following the significant long term rising channel formation, Gold will rally another +25% before we will see a retracement.
📝Levels to watch:
$4.000, $4.500
SwingTraderPhil
SwingTrading.Simplified. | Investing.Simplified. | #LONGTERMVISION


Do you dare to follow the short selling?Judging from the hourly chart, gold rebounded after testing the lower support several times, and stagnated after rebounding to around 4040. After closing the hourly line with a doji, it formed a large negative line. This pattern means that gold may pull back to test the lower support in the short term. Secondly, gold is still under trend suppression in the short term, so we have good reasons to short it.
If gold rebounds again to around 4030-4040, we could consider a light short position, with an eye on 4015-4000.
For more real-time updates, please follow🌐

ANFIBO | XAUUSD - Buy and Win [10.8.2025]Hi traders, Anfibo's here!
XAUUSD Analysis – Daily Trading Plan
Technical Outlook:
> SUPPORT KEY / BUY ZONES : 4026 - 4000 - 3942 - 3926 - 3909 - 3900 - 3890
> RESISTANCE KEY / SELL ZONES : 4086 - 4139
Trading Plan for Today:
>>> SELL ZONE:
ENTRY: 4082 - 4092
SL: 4102
TP: 4026 - 4000 - 3942 - 3926
>>> BUY ZONE:
(1) ENTRY: 4025 - 4027
SL: 4019
TP: 4086 - 4139 - ATH
(2) ENTRY: 3885 - 3900
SL: 3880
TP: 3940 - 3970 - 3995 - ...
Risk Management:
- Maintain a minimum Risk:Reward ratio of 1:2.
- Manage position sizing carefully; avoid overtrading at psychological highs.
- Monitor U.S. economic data and geopolitical news closely, as these could act as catalysts for corrective moves.

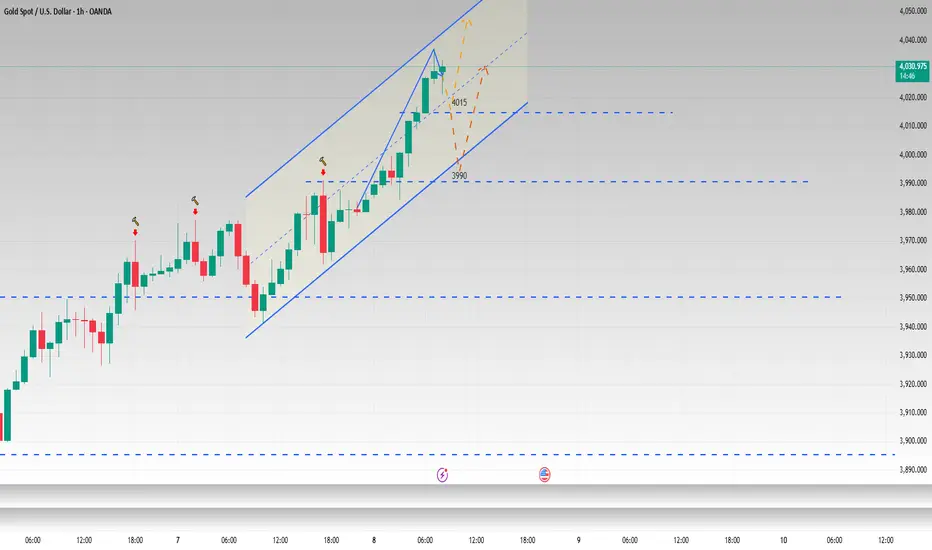
4015 can go long, 3990 is bullish if not brokenAs expected, gold continued its strong upward momentum, breaking through the 4,000 mark in the Asian session and nearly reaching 4,040. But from the news point of view, gold has now come to a critical moment. According to information revealed by U.S. Senator John Thune, the Senate will vote again on two short-term appropriations bills on the 8th and discuss the progress of the government shutdown. This will be the Senate's sixth attempt to pass a temporary spending bill to end the federal government shutdown. The previous government shutdown sparked market panic, leading many investors to flock to the gold market. If the government can be reopened this time, it will effectively alleviate risk aversion and cause gold prices to correct. On the contrary, the impact of continued closures and geopolitical factors may even cause gold to rise again.
Judging from the current gold trend, a new upward channel has been formed. Our trading strategy still focuses on long gold and short gold as a supplement. Then we should first focus on the small support of 4015-4010. When it falls back to here for the first time, we can try to go long with a light position. If it breaks, stop loss in time and pay attention to the important support of 4000-3900 to go long on gold. But it is worth noting that we must be wary of the possible rise and fall of gold today. The first reason is whether the US government shutdown issue can be resolved. The second reason is that China’s holiday is about to end. As a major gold holder, once it returns, the impact on the market will definitely be significant. On the upside, focus on the channel resistance level of 4050-4060. If gold rises near this resistance level, consider shorting it appropriately based on market conditions.
For more real-time updates, please follow my profile
Gold Price Analysis – Gold Retracement Setup $3,955 TargetGold remains in a bullish structure, holding above the ascending trendline. Price has recently faced rejection near $3,956, which marks the weekly high, and a short pullback is expected before the next leg up. The ideal buy zone lies between $3,905–$3,890, aligning with previous structure support and the trendline base. A bullish reaction from this zone could push price toward $3,956, and if momentum continues, an extended move toward $3,990 is possible. The stop-loss should be placed below $3,885 to protect against false breaks, keeping the bias bullish as long as price stays above $3,890.
Note
Please risk management in trading is a Key so use your money accordingly. If you like the idea then please like and boost. Thank you and Good Luck!

Gold weekly chart with both Buy and Sell levelsCheck out last weeks chart , I closed with 600 pips but the buy ran for over 1300 pips
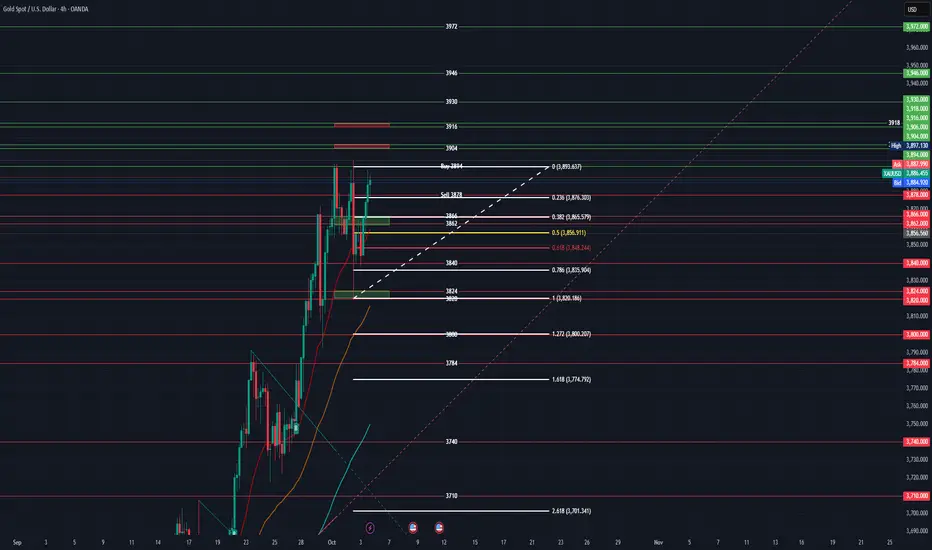
## XAUUSD 1-Hour Chart Analysis (Context: Late September/Early October)
The chart displays a clear **uptrend** leading into the marked entries, characterized by higher highs and higher lows, and price generally holding above the moving averages (the white and green lines). The current price action (as of the last visible bar on October 3rd/4th) shows some consolidation after hitting near the `Daily High 3897.130`.
### Key Technical Observations
1. **Trend:** Strongly bullish preceding the current consolidation.
2. **Levels:**
* The price is currently hovering between the recent swing high/Daily High and the previous day's open/close levels.
* The Fibonacci retracement (drawn from a recent swing low to the subsequent high) is prominent. The 50% level (`3855.926`) and the $0.618$ level (`3847.491`) are key potential support areas.
3. **Volume/Delta:** The chart indicates a "Macro Delta Volume" of 6.66% and "Premium/Discount" zones, suggesting the use of Order Flow or Volume Profile analysis, which generally confirms the bullish pressure leading up to the high.
### Analysis of Marked Entries
I have marked two entries based on a potential range breakout strategy:
* **Buy Entry:** `Buy 3894`
* **Sell Entry:** `Sell 3878`
These entries appear to be attempting to trade a **range breakout** or **breakdown** from the current consolidation zone. The area between 3878 and 3894 is likely the immediate trading range you are observing.
#### 1. Buy Entry: `Buy 3894`
* **Context:** This is placed just below the recent high (`Daily High 3897.130`) and the premium zone, aiming for a continuation of the prior strong uptrend.
* **Success Conditions:** Requires buyers to overcome the resistance at the recent high and push into new territory (potentially targeting `3900`, `3904`, or higher resistance at `3916`).
* **Probability Assessment:**
* **Pro:** The overall trend is bullish. Breaking the recent high suggests strong demand continuation.
* **Con:** The price has just experienced a significant move up and might be due for a deeper retracement (a "pullback" to the Daily Open or 50% Fib level) before breaking out. A breakout immediately after a large run can sometimes be a false breakout (a "trap").
* **Probability:** **Medium (50-60%)**. The success relies heavily on sustained momentum and failing to print a deeper retracement first. Aggressive buying pressure would be required to trigger this.
#### 2. Sell Entry: `Sell 3878`
* **Context:** This entry targets a breakdown below the immediate support of the current consolidation range, indicating a potential reversal or a bearish move toward key support levels (like the Fib levels or the Daily Low).
* **Success Conditions:** Requires sellers to push price past 3878, confirming the consolidation is resolving downward, likely targeting the Daily Open (`3864`) or the 50% Fibonacci retracement (`3856`).
* **Probability Assessment:**
* **Pro:** The strong momentum upward has paused, suggesting selling pressure might be starting to emerge. A move below 3878 validates a short-term bearish reversal or a deeper pullback.
* **Con:** The long-term trend remains strongly bullish. Selling into a strong trend, even for a pullback, is inherently riskier. The lower support structure (Fib levels) is generally robust in a bullish market.
* **Probability:** **Medium-High (55-65%)**. A retracement to the 50-61.8% Fib levels is a highly common and statistically probable event after a significant impulse move. If 3878 breaks, the road to 3864/3856 is quite clear.
---
1. **The Sell setup at 3878 has a slightly higher immediate probability** because pullbacks/retracements are common and expected after a large move, and a break below 3878 would signify the start of such a move.
2. **The Buy setup at 3894 offers greater reward potential** if the major trend continuation occurs, but it faces the immediate hurdle of the recent high and potential exhaustion.
**Risk Management Note:** For either trade, a failure to follow through quickly (i.e., if the price lingers around the entry level) should be a sign of caution.
---
## Look Ahead: Economic News and Impact on Gold (XAUUSD)
Assuming the current chart data is from early October (based on the time stamps), the focus for the coming week will be on the US Dollar (USD) strength, which is inversely correlated with the price of Gold, and overall risk sentiment.
Gold is highly sensitive to:
1. **Interest Rate Expectations:** Higher rates increase the opportunity cost of holding non-yielding Gold.
2. **Inflation/Economic Data:** Poor data often boosts Gold as a safe-haven asset, while strong data often boosts the USD (hurting Gold).
### Key Economic Events and Potential Impact (Hypothetical Oct Week)
| Event Category | Potential News | Usual Impact on USD | Probable Impact on XAUUSD |
| :--- | :--- | :--- | :--- |
| **Inflation/Rates** | FOMC Meeting Minutes / Speeches from Federal Reserve Members (Hawkish commentary) | Stronger USD | **Negative.** Confirms a "higher for longer" rate view, pressuring Gold. |
| **Employment** | US Non-Farm Payrolls (NFP) or Initial Jobless Claims (Strong report) | Stronger USD | **Negative.** Strong job market reduces recession fears and allows the Fed to remain tight. |
| **Manufacturing** | ISM PMI Data (Better than expected) | Stronger USD | **Negative.** Suggests economic resilience, supporting US assets over safe havens. |
| **Risk Sentiment** | Geopolitical Shocks or Banking Sector Instability | Weaker USD (as capital flows to safety) | **Positive.** Gold acts as the primary safe-haven asset during times of high uncertainty. |
**Overall Expected Bias:** Given the recent momentum in the chart, if the week's economic data (especially jobs/inflation) comes in *strong* or *as expected (hawkish)*, it will likely lead to **USD strength**, pushing Gold from its recent highs and favoring your **Sell 3878** scenario (at least as a deeper retracement).
If the data is **significantly poorer** than expected, or a major external risk event occurs, this would fuel USD weakness and boost Gold, favoring your **Buy 3894** scenario for a strong bullish continuation.
ANFIBO | XAUUSD - Fibo 2.618 at $4000 is coming soon [10.7.2025]Hi traders, Anfibo is here!
XAUUSD Analysis – Daily Trading Plan
Overall Picture:
It appears that gold OANDA:XAUUSD is moving exactly according to the two projected waves outlined in yesterday’s plan. The market continues to demonstrate strong bullish momentum, steadily seeking new all-time highs .
The current uptrend shows no significant signs of weakening, with safe-haven demand still dominating price action. However, the $4,000/oz level remains a key psychological resistance, which also aligns with the Monthly Fibonacci extension target. As price approaches this zone, a technical correction or profit-taking phase is highly likely to occur.
The degree of this potential correction will depend heavily on macroeconomic data and geopolitical developments, so it’s essential to closely monitor and reassess the market as new information unfolds.
Technical Outlook:
Primary Trend: Strong bullish momentum on both Daily and Monthly timeframes.
> SUPPORT KEY / BUY ZONES : 3942 - 3926 - 3909 - 3900 - 3890
> RESISTANCE KEY / SELL ZONES : 3970 - 3975 - 3984 - 3999
Trading Plan for Today:
>>> SELL ZONE:
ENTRY: 3995 - 4005
SL: 4010
TP: 3900 - 3800 - ...
>>> BUY ZONE:
ENTRY: 3885 - 3900
SL: 3880
TP: 3940 - 3970 - 3995 - ...
Risk Management:
- Maintain a minimum Risk:Reward ratio of 1:2.
- Manage position sizing carefully; avoid overtrading at psychological highs.
- Monitor U.S. economic data and geopolitical news closely, as these could act as catalysts for corrective moves.
Conclusion:
Gold continues to follow the planned technical path, reaffirming the strength of its bullish structure. The $4,000/oz zone will serve as a key psychological milestone — a level where temporary corrections or consolidations are likely before another potential leg higher.
For now, the strategy remains clear: prioritize the bullish side, and closely observe price reactions around $4,000 to adjust accordingly. In this market, “following the trend” remains the wisest approach.
GOODLUCK GUYS!

XAU/USD Short-Term Buy Opportunity Near $3,950 SupportCurrent price: around $3,949.60
Support zone: near $3,940
Resistance targets: around $3,962, $3,965, and $3,970
Setup type: A long position with a defined entry near current price, stop loss just below $3,940, and take profit around $3,962–$3,970.
The green box indicates the reward zone, while the red box shows the risk area.
✅ Interpretation: The trader anticipates a short-term bullish rebound after a corrective move down.

ANFIBO | XAUUSD Weekly Plan [10.6 - 10.10.2025]Hi traders, Anfibo is here!
XAUUSD Analysis – Daily Trading Plan
Overall Picture:
Gold’s bullish trend remains extremely clear, reflecting the market’s strong confidence in this safe-haven asset amid ongoing global economic and geopolitical uncertainties. The continuous series of new ATHs highlights that buyers are firmly in control of the market.
However, from a technical perspective, the $4,000/oz level stands out as a significant psychological round-number resistance. This zone also coincides with the Monthly Fibonacci extension target, making it highly likely that profit-taking will emerge once price approaches this level. Any reaction here will largely depend on external factors and key news events, which must be closely monitored.
Technical Outlook:
Primary Trend: Strong bullish momentum on both Daily and Monthly timeframes.
Momentum: Still positive, though $4,000 may trigger short-term corrections.
> SUPPORT KEY / BUY ZONES : 3800- 3787 - 3750 - 3723 - 3713 - 3703
> RESISTANCE KEY / SELL ZONES : 3825 - 3835 - 3865 - 3880
Trading Plan for Today:
>>> SELL ZONE:
(1) ENTRY: 3969 - 3973
SL: 3976
TP: 3900 - 3890
(2) ENTRY: 3995 - 4005
SL: 4010
TP: 3900 - 3800 - ...
>>> BUY ZONE:
ENTRY: 3885 - 3900
SL: 3880
TP: 3940 - 3970 - 3995 - ...
Risk Management:
- Maintain a minimum Risk:Reward ratio of 1:2.
- Manage position sizing carefully; avoid overtrading at psychological highs.
- Monitor U.S. economic data and geopolitical news closely, as these could act as catalysts for corrective moves.
Conclusion:
Gold remains in a powerful bullish cycle with no signs of cooling down yet. However, the $4,000/oz mark is a critical psychological and technical barrier where corrective pullbacks are likely to occur. Traders should continue to favor long setups but remain vigilant around this zone, closely observing price reactions to refine their strategies.
WISH EVERYONE A PROFITABLE NEW WEEK!

XAUUSD Delivered Excellent profits [ 600 pips]Thanks to those traders who followed us and made profits 📈🙏 keep grinding 💪.
I booked profits on buying orders during Friday session, entering around 3857-3855 and exiting near 3930, while my shorter-term longs hit the 3910 target on today’s Tokyo session hike.
Going forward, I’ll continue buying dips from my key entry zones as long as Gold holds above the bullish trend till 4000

Gold Price Analysis – Bullish Channel Points to $3,936+Gold is trading around $3859 and is moving within an upward channel, keeping the overall structure bullish. Price has recently tested support near $3844 and is showing signs of holding this zone. As long as gold stays above $3840, upside momentum may continue towards $3896 first, and then extend higher towards $3936–$3960 in line with the channel’s upper boundary. On the downside, a break below $3827 could trigger a deeper pullback towards $3793, which is the channel’s base support. In summary, gold remains bullish above $3840, but a drop below $3827 would shift momentum towards further correction.
Overall, the structure remains bullish while price stays inside the ascending channel, but short-term volatility and false breakouts should be expected.
🔑 Key Levels to Watch:
- Resistance: $3896 → $3936 → $3960
- Support: Immediate support $3844 → $3827 → $3805
Note
Please risk management in trading is a Key so use your money accordingly. If you like the idea then please like and boost. Thank you and Good Luck!

Gold XAUUSD: Double Top, Volume Profile, and VWAP Trade Plan📊 Gold (XAUUSD) has been trending higher overall, but recently formed a double top followed by a significant retracement ⚡. Despite that, price action is now beginning to show signs of a shift in structure back to the upside 📈.
🔎 In the video, we review both the VWAP and the anchored volume profile as part of the trade plan. For a potential long setup, I’ll be watching for price to break above the volume profile’s Point of Control (POC) 🎯.
❌ However, if price were to break below VWAP, that would invalidate the idea and I’d step aside until the next opportunity arises.
⚠️ Disclaimer: This analysis is for educational purposes only and not financial advice. Always manage risk appropriately.

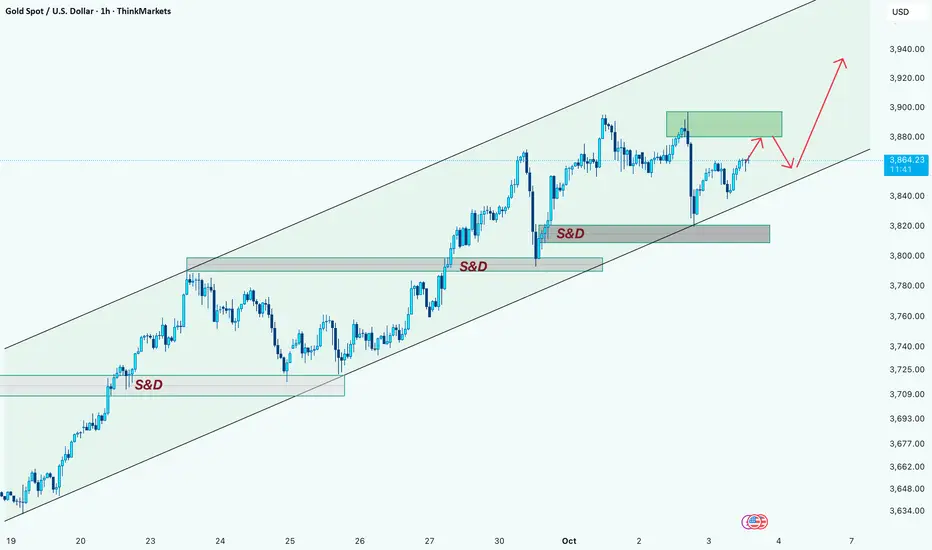
Gold Bulls Warming Up for the Next Rally After PullbackHi guys
Gold is still respecting the ascending channel structure, creating higher highs and higher lows. The price has already reacted strongly from the demand (S&D) zone around 3820–3840, pushing back toward the upper side of the channel.
🔎 At this stage, the key area to watch is the green supply zone near 3880–3900. I expect the price to test this zone, where a short-term correction is likely. After a possible pullback toward the mid/lower boundary of the channel, the bullish momentum should continue, with the next upside targets aligning with the 3920–3940 area.
Trend bias: Bullish
Key levels:
Resistance: 3880 – 3900 (supply zone)
Next target: 3920 – 3940
🚀 If the channel structure remains intact, dips should be seen as buying opportunities, with the overall trend pointing higher.
Disclaimer: As part of ThinkMarkets’ Influencer Program, I am sponsored to share and publish their charts in my analysis.