Gold Price Analysis – XAU/USD Hits New All-Time High at 3812🌍 Market Developments
Gold prices continue to surge, reaching a new record high at $3,810/oz in today’s session. The rally is driven by expectations that the Federal Reserve will maintain a dovish policy stance, a weakening US dollar, and falling US Treasury yields. Safe-haven demand is also supported by ongoing geopolitical tensions and fears of a global economic slowdown.
📈 Technical Analysis
• Key Resistance: 3815 – 3825
• Immediate Support: 3785 – 3770, with deeper support at 3750
• EMA 50 & 100: both trending upward, confirming strong bullish momentum
• H1 and H4 candles show powerful upward momentum, though RSI is approaching overbought territory → possible pullbacks or short-term volatility
💡 Outlook
The primary trend remains bullish, but the sharp rally after setting a new record may trigger profit-taking around the 3815 – 3830 zone. As long as gold holds above 3770, the bullish bias remains intact.
🎯 Trading Strategy Suggestion
🔺 BUY XAU/USD : 3780 – 3777
🎯 TP: 40/80/200 pips
🛑 SL: 3773
🔻 SELL XAU/USD : 3817 – 3822
🎯 TP: 40/80/200 pips
🛑 SL: 3827
Goldlongsetup

Gold Trade Setup - 27/Sep/2025Hi Traders,
I am biased for further upside in Gold.
The first trade that I will be looking for is from the highlighted zone and the price is already testing it.
If price corrects here , then I will expect it to drop further to the next marked POI.
Please follow me and like if you agree or this idea helps you out in your trading plan.
Disclaimer : This is just an idea. Please do your own analysis before opening a position. Always use SL & proper risk management.
Market can evolve anytime, hence, always do your analysis and learn trade management before following any idea.

Gold PCE data follows the trend
News:
Powell's speech was rather conservative, exacerbating the market's cautious sentiment, and the easing of geopolitical situation suppressed the demand for safe-haven assets, which led to the resistance of gold's rise and the adjustment of high-level fluctuations. However, the expectation of further interest rate cuts by the Federal Reserve provided important bottom support for gold prices, which limited the short-term decline space and created opportunities for bargain hunting. In terms of operations, we suggest that everyone pay attention to the support at $3,740, followed by $3,730, and the upper pressure at $3,780, followed by $3,800.
Specifically:
During Thursday's European session, gold rebounded to $3,760 before encountering resistance and falling in a volatile manner. After the US market opened, gold continued its decline, falling to a low of $3,720. After stabilizing, it rebounded and rebounded, reaching $3,758 before encountering resistance.
At the opening of Friday's session, gold fell back to $3,735 before stabilizing. It rebounded to $3,750 before encountering resistance and is currently trading at $3,750. Overall, despite the resistance to gold's rebound, its short-term decline is limited, and gold prices continue to fluctuate and consolidate at a high level.
On the daily chart, gold has stabilized above $3,700, maintaining a high and volatile range. For downward support, consider the lower limit of the 4-hour Bollinger Band at $3,720, which is also near the low point of gold's decline on Wednesday and Thursday. Secondly, consider the $3,700 level. If gold prices hold steady here, there's still a chance for further gains. For upward pressure, consider Thursday's rebound high of $3,760, followed by Wednesday's rebound high of $3,780.
The 5-day moving average maintains an upward golden cross, but the MACD indicator has slightly crossed downward, and the KDJ and RSI indicators have formed a small bearish cross. Short-term technical indicators suggest that gold needs a correction after its continuous rise.
Strategy:
Long Position3740-3750,SL:3725,Target:3780-3800

Gold Trade SetupI will risk!!!
It seems we are near at the end of correction wave...
The first target R/R is 2 and the second is 4...

Gold - Sell near 3753, target 3740-3722Gold Market Analysis:
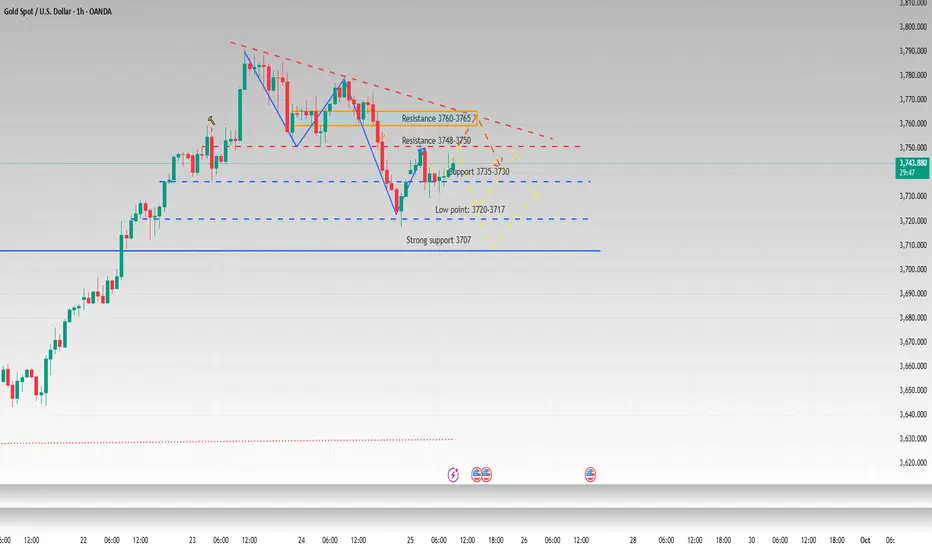
Yesterday, gold saw both buying and selling, and the market began a period of volatile correction, fluctuating up and down. This is a sign that markets can never rise continuously. When prices tire of rising, they need a break and a pause to recover. This is a normal technical correction after a significant surge. Today's strategy is for short-term volatility, with the broader trend bullish. The range of this correction is a bit unclear, so we can target the upper and lower highs of the 1-hour chart. The daily and weekly charts are closing today. Barring any major surprises, the weekly chart will close with a positive candlestick pattern. Next week, gold will continue to rise, and buying will continue to push prices higher. 3791 isn't the high point of this wave; a break above 3800 is just around the corner. The hourly chart shows gold forming a triangle consolidation pattern. Today, we'll focus on a breakout of this correction. The hourly correction range is 3722-3762. Until this range is broken, we'll maintain a short-term volatile trend. If it does, we can follow the trend. Once the volatility ends, there will undoubtedly be a significant move, whether it's a decline or a breakout. If the Asian session rebounds first, we'll consider selling near 3753.
Support at 3732 and 3722, strong support at 3717, resistance at 3753 and 3758, strong resistance at 3762, and the dividing line between strength and weakness at 3753.
Fundamental Analysis:
This week's fundamentals have limited impact on the market. The US dollar has also begun to fluctuate. The market awaits new data to drive it. The Federal Reserve's interest rate cuts in October remain a key focus.
Trading Recommendations:
Gold - Sell near 3753, target 3740-3722

Analysis of gold price intraday trend!Market News:
Spot gold fluctuated narrowly in early Asian trading on Friday (September 26), currently trading around $3,750/oz. Following the unexpected decline in US initial jobless claims last week, investors awaited key inflation data that could influence the Federal Reserve's next interest rate move. Following the release of the initial claims data, gold prices plummeted to $3,722/oz. The market logic is clear: the better the economic performance, the more confident the Fed will be in slowing or even pausing its rate cuts, and the higher the opportunity cost of holding non-interest-bearing gold. Currently, all market participants are focused on the upcoming release of the US Core PCE Price Index for August. This is the Fed's preferred inflation indicator, and its performance will directly provide the most critical basis for the Fed's next move. Investors will also need to monitor speeches by other Fed officials and news related to geopolitical developments.
Technical Analysis:
The US dollar index rose sharply, reaching a nearly two-week high, closing up 0.58%. Spot gold prices fluctuated, repeatedly testing the $3,760 mark during the session before facing pressure. Gold is currently fluctuating within a broad range, with intense buying and selling activity. Key support is forming below 3718/22, while resistance is forming above 3758/62. Continue to monitor this range for the day. Technically, the daily chart is trading above and below the 5-day moving average, with the RSI indicator trading above 70. The short-term hourly and four-hour moving averages are converging, and the Bollinger Bands are gradually closing. Prices are converging within the mid-range, with the RSI consolidating towards 50. Gold is expected to continue its broad range-bound trading on Friday. The day's trading strategy remains to sell high and buy low, with short-term participation.
Trading Strategy:
Short-term gold buy at 3722-3725, stop loss at 3714, target at 3760-3780;
Short-term gold sell at 3762-3765, stop loss at 3774, target at 3730-3710;
Key Points:
First support level: 3737, second support level: 3722, third support level: 3704
First resistance level: 3762, second resistance level: 3788, third resistance level: 3805

The trend has not changed, continue to shortAfter yesterday's high-level fluctuations, gold prices retreated significantly in the US market due to news, hitting a low near 3717.
Yesterday's daily gold price closed in the red, with the MA5 moving average near 3735. If today's daily closing price falls below the MA5 and reaches the MA10, bears will regain control of the market. Looking at the 4-hour Bollinger Bands, after breaking below the middle line, the price has fluctuated, briefly stabilizing near 3735. Currently, it is consolidating sideways, but if the European/US session breaks below 3735-3720, further declines to 3710-3700 are possible. The short-term downward trend is still under pressure and the market is in a weak state. Therefore, intraday gold trading is still mainly short selling, with long buying as an auxiliary.
The main pressure range above is 3750-3765. If the rebound touches the upper resistance range without breaking it, you can continue to short gold. The short-term support is at 3735-3720 below. If it falls back but does not break through, you can go long with a light position. Strong support focuses on the previous top and bottom conversion of 3710-3700.
GOLD (XAU/USD) – 4H: Triangle Breakout Play Toward 3850–3900Hello traders,
I’m watching Gold closely as it appears to be consolidating inside a descending triangle pattern (highlighted in purple), with key support/resistance levels clearly marked.
🔹 Current Setup:
Price is testing the lower boundary of the triangle near $3,700.
We’ve seen multiple rejections at the upper resistance (~$3,760–$3,780), forming lower highs — classic triangle behavior.
The recent dip to point C held strong, suggesting buyers are stepping in at this zone.
🔹 My Thesis:
I believe price will respect the triangle structure and bounce off the lower trendline, then surge upward toward the $3,850–$3,900 range — potentially breaking above the triangle’s upper resistance (red line) with momentum.
🎯 Why This Makes Sense:
✅ Volume & momentum indicators (QQE MOD below) show bullish divergence forming.
✅ Previous swing high at B ($3,780+) acts as psychological resistance — a breakout here could trigger FOMO buying.
✅ The triangle is nearing its apex — meaning a breakout (up or down) is likely soon. I’m betting on the upside given macro backdrop (Fed pause expectations, geopolitical risk).
⚠️ Risk Management:
Stop loss: Below $3,680 (below triangle support).
Target 1: $3,850 (previous consolidation zone)
Target 2: $3,900 (next psychological level + Fibonacci extension)
📌 Watch for: A bullish engulfing candle or RSI crossover above 50 to confirm the reversal.
Let me know what you think — are you long, short, or waiting for confirmation?
#Gold #XAUUSD #TechnicalAnalysis #TradingView #TrianglePattern #Breakout #Forex #Commodities #TradeSetup
✅ Pro Tip: Add your username or handle (@raheel007khan) at the top or bottom to build your brand. You can also add “Follow for more setups” to grow engagement.

Gold prices plummet! Analysis of the intraday gold price trend!Market News:
In early Asian trading on Thursday (September 25), spot gold prices fluctuated narrowly, currently trading around $3,750 per ounce. As investors digested comments from Federal Reserve Chairman Powell, the US dollar and US Treasury yields strengthened, sending international gold prices sharply lower. Powell signaled a cautious outlook for rate cuts, noting that the Fed must continue to balance the risks of high inflation and a weak job market in future rate decisions. Furthermore, Trump presented a Gaza peace outline to Arab leaders, the Russian and US foreign ministers reiterated their commitment to a peaceful resolution to the Ukraine crisis at a meeting, and the EU and US reached a tariff agreement, significantly cooling market risk aversion. Looking ahead, the market's attention is focused on two key US economic data releases later this week, which will provide further clues to the Fed's policy path and directly influence London gold prices. Thursday will see the release of weekly initial jobless claims data, while Friday's release of the US core personal consumption expenditures (PCE) price index, the Fed's preferred inflation indicator, will draw even greater attention.
Technical Analysis:
The US dollar index continued its upward trend during the day, briefly approaching the $98 mark. Gold prices adjusted under pressure, closing with a negative candlestick pattern on the daily chart. It retreated to the 5-day moving average at 3718, finding support at 3736. Since Tuesday's overbought top divergence from the RSI on the daily chart, gold has adjusted by over $70. Currently, the price of gold on the daily chart remains above the 10-day and 7-day moving averages, trading above 3700 and 3710, respectively. On the short-term four-hour chart, the price has retraced to the middle Bollinger Band, with the RSI indicator simultaneously adjusting to the 50 level to find support. The moving average formed a downward crossover at the high of 3767. Gold trading today is expected to continue with a wide range adjustment. Sell high and buy low, with the initial focus on the 3720/3760 range.
Trading strategy:
Short-term gold: Buy at 3717-3720, stop loss at 3708, target at 3750-3770;
Short-term gold: Sell at 3772-3775, stop loss at 3784, target at 3730-3710;
Key points:
First support level: 3732, second support level: 3720, third support level: 3713
First resistance level: 3763, second resistance level: 3780, third resistance level: 3800


LETS GOO GOLD FLY 3830 SOON Gold Have A Super Sharp X Setup
Gold Buy Now Hold Till Physcology Level 3830
Support + RBS + Buy Trendline + Sell TL Breakout
Lets gooo
Good Luck Guys !

Gold prices surge! Analysis of intraday gold price trends!Market News:
Spot gold fluctuated at high levels in early Asian trading on Wednesday (September 24), currently trading at $3,762 per ounce, not far from the all-time high reached overnight. Yesterday, gold prices experienced extremely volatile fluctuations, soaring to a record high of $3,791. However, following a speech by Federal Reserve Chairman Powell, the London gold price retreated significantly from this high. However, gold's overall upward trend remained intact, and the price ultimately closed higher that day. Powell's remarks last night largely reiterated his remarks at the press conference following last week's rate cut. He emphasized the challenges facing the Fed in achieving its dual objectives. "Two-way risks mean there is no risk-free path," Powell said. He noted that cutting rates too much, too quickly, could lead to inflation running persistently close to 3%, rather than the Fed's 2% target; while maintaining a restrictive policy stance for too long could lead to unnecessary labor market slack, driving gold prices lower. Investors' focus now turns to Friday's release of the US core personal consumption expenditures (PCE) price index, the Fed's preferred inflation indicator. If data shows easing inflationary pressures, it will strengthen the case for an interest rate cut, positive for gold. Conversely, if inflation remains stubborn, it could shake market confidence in a rate cut, causing short-term volatility in international gold prices.
Technical Analysis:
After three consecutive daily gains, gold prices are trading in the overbought zone at 80, signaling a divergence. This is also why, after yesterday's record high of 3790.97, gold prices retreated sharply to support at 51, driven by both technical and fundamental factors. Currently, after three consecutive daily gains, prices are trading significantly below the 10-day moving average at 3693, with the 5-day and 7-day moving averages at 3722 and 3707, respectively. On the short-term four-hour chart, prices are converging around the 10-day moving average. The RSI indicator has turned downward after overbought levels, and the hourly moving averages are converging, pushing prices back below the middle Bollinger Band. Gold prices could see further correction after their sharp rise, with the 3740/80 range being the initial target for the day.
Trading strategy:
Short-term gold: Buy at 3750-3753, stop loss at 3742, target at 3780-3800;
Short-term gold: Sell at 3782-3785, stop loss at 3794, target at 3650-3630;
Key points:
First support level: 3750, second support level: 3735, third support level: 3712
First resistance level: 3778, second resistance level: 3791, third resistance level: 3808

Gold All Time High Continue – Next Target?Gold is currently trading around $3688, just above the 3675–3680 breakout zone, which has now turned into a crucial support. Price is moving within an upward channel, but the recent breakout above equal highs and the labeling of a “weak high” suggest that buyers may still push towards the 3740–3750 resistance area before facing stronger rejection. A decisive break above the $3,700–3,750 zone would open the way to targets in the $3,800+ region and eventually toward $4,000 if the Fed proves dovish and ETF/central-bank demand remains strong.
However, failure to hold above 3680 would shift momentum back towards the lower channel, where immediate supports lie at 3565, 3530, and 3498. A deeper breakdown below these levels would open the door for further downside towards the 3440–3400 zone. Any surprise hawkish Fed commentary, a meaningful USD recovery, or a quick drop in inflation expectations could trigger sharper mean-reversion.
Buy Zone & Buy Trigger:
- Buy Zone: 3670 – 3680 area
- Buy Trigger: A clean breakout and 4H close above 3700 will be a buy trigger.
Note
Please risk management in trading is a Key so use your money accordingly. If you like the idea then please like and boost. Thank you and Good Luck!

Gold Analysis: Breakout Potential Toward $3,800Gold is trading around $3,715, showing strong bullish momentum after breaking out of the recent consolidation zone between $3,595 – $3,640. Price has respected the ascending channel and is now approaching the $3,725–$3,740 resistance zone, which is a key area to watch. A sustained break above this zone could open the way toward $3,760+ and possibly extend into the $3,800 region if bullish momentum continues.
Gold is consolidating after a strong rally. Holding above the trendline is key—breaking below may lead to a deeper pullback, while a breakout above resistance could push prices toward $3,800. Despite short-term swings, the longer-term outlook stays bullish.
On the downside, immediate support lies near $3,680–$3,660, followed by the support levels at $3,638 and $3,616. Holding above these levels will keep the bullish structure intact.
📌 Sell Zone & Sell Trigger:
- Buy Zone: $3,660 – $3,680 area
- Buy Trigger: A clean breakout above $3,725 – $3,740 resistance → Upside target $3,760 – $3,800.
Note
Please risk management in trading is a Key so use your money accordingly. If you like the idea then please like and boost. Thank you and Good Luck!

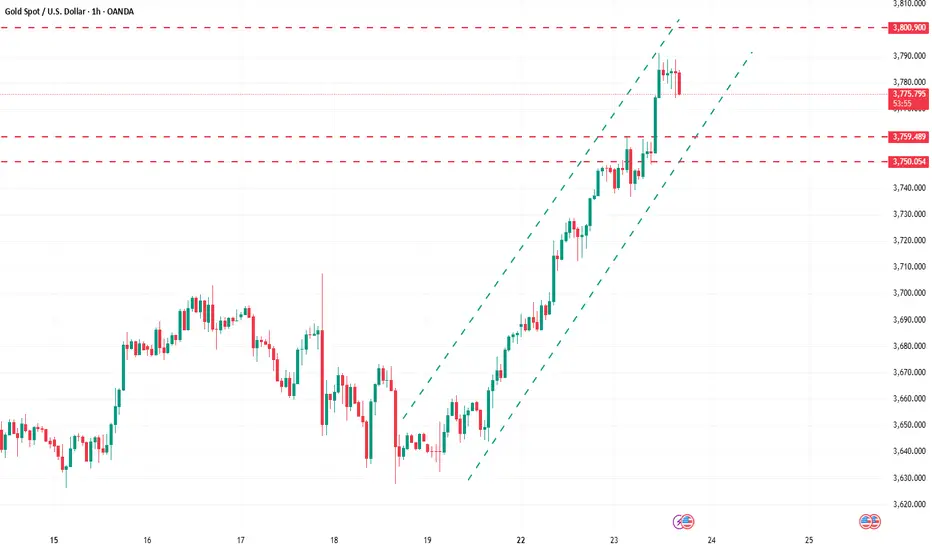
How to accurately arrange long and short positions?Gold is currently standing firmly above the 3750 line, with a maximum impact of 3791, just one step away from the 3800 mark. The overall bullish momentum has not weakened. If gold can continue to stabilize above 3750, it means that the 3800 mark will most likely be tested. The short-term market is still in a strong bullish pattern. We are currently focusing on the 3760-3750 support zone. If this area can effectively stabilize, it will be an ideal entry point for short-term bulls and has a strong reference value. From the 4-hour cycle, the effective support below is maintained in the area around 3760-3750, while the upper pressure is at the 3800 mark, which is the key balance point between a strong breakthrough and a technical pullback. In terms of operating strategy, it is still recommended to maintain the idea of "low-long as the main and high-short as the auxiliary". Specifically, if the price falls back to 3750-3760 without breaking through, you can go long with a light position, and target around 3800 first; if the price touches the 3800 area, you can try to go short with a light position, but you must enter and exit quickly and strictly control the stop loss; in the middle position, you should wait and see, watch more and do less, to avoid repeated consumption of funds by range fluctuations. Overall, the current bullish trend of gold still dominates the market, but as the price gradually approaches the integer mark, market volatility may intensify. Short-term operations must be steady and cautious, control the rhythm, wait for key points to enter the market, and respond flexibly. This is the core idea at the current stage.
Gold ATH , PULLBACK SHARP SETUP TO CREATE NEW ATH AGAIN Gold Buy Reasons
RBS / BRB / FVG / MSS
Gold Buy Zones
3760 , 3754
3750 , 3745
Got It Guys ? Use Proper MM
Good Luck With Your Trading 🤞
Gold spikes to 3760 then pulls back to 3745 📊 Market Overview:
Gold surged to a new ATH at 3760 USD/oz, then dropped quickly to 3735 USD/oz on profit-taking. Currently, it trades around 3745 USD/oz, showing a tug-of-war between buyers and sellers.
📈 Technical Analysis:
🔺 Resistance 1: 3755 – 3760
🔺 Resistance 2: 3775
🔻 Support 1: 3735
🔻 Support 2: 3720
• EMA 50 (H1) still pointing upward → bullish bias intact.
• Last H1 candle with long upper wick → short-term selling pressure.
📝 Outlook:
Trend remains bullish, but 3755–3760 is a key resistance zone. If it fails to break, price may retest 3735 or even 3720.
🎯 Trading Strategy:
🔺 BUY XAU/USD : 3735 – 3738
🎯 TP: 40/80/200 pips
🛑 SL: 3732
🔻 SELL XAU/USD : 3775 – 3780
🎯 TP: 40/80/200 pips
🛑 SL: 3785

Gold prices surge! Analysis of intraday gold price trends!Market News:
On Tuesday, as market expectations for further Federal Reserve rate cuts grew, spot gold prices surged dramatically, reaching a record high. The rise in London gold prices stemmed from a combination of policy, macroeconomic, and geopolitical risk factors, reflecting the market's conflicting mood between exuberance and panic. Amidst rising global risks and uncertainties, international gold is becoming a "must-have" investment for investors. Global central banks continue to increase their gold reserves, coupled with continued inflows into gold ETFs, demonstrating continued strengthening demand for gold as a strategic investment by institutional investors. This trend has been a key driver of international gold prices over the past few months. At the same time, the risk of a potential US government shutdown has risen again. These uncertainties have heightened gold's safe-haven appeal. The war between Russia and Ukraine appears far from over, further driving up gold prices. Several Federal Reserve officials will speak this week, with the market focused on Friday's release of the core PCE price index. A continued decline in inflation data would reinforce expectations of further rate cuts in October and December. A low interest rate environment helps reduce the cost of holding gold, significantly increasing its appeal.
Technical Analysis:
Gold prices maintain a strong bullish trend, with the daily chart maintaining a strong bullish trend and reaching a new all-time high. The continued weakness of the US dollar further boosted buying momentum for gold and silver. On the daily chart, gold broke through 3750, reaching a new all-time high. Yesterday, the price of gold rose by over $75 per ounce. The latest 10-day and 7-day moving averages continue to trend upward, and the price is trading within the upper Bollinger Band. The short-term four-hour moving averages are trending upward, as are the Bollinger Bands. At this rate of increase, gold prices could soon reach 3800. This simplified market trend suggests buying low on pullbacks, with selling at key resistance levels supporting historical highs. Trends are king, and yesterday's continued declines and repeated buying demonstrates our trend-following strategy. Today's target is 3733/26, watch for low-price buying opportunities!
Trading Strategy:
Short-term gold: Buy at 3730-3733, stop loss at 3722, target at 3760-3780;
Short-term gold: Sell at 3780-3783, stop loss at 3792, target at 3650-3630;
Key Points:
First Support Level: 3735, Second Support Level: 3720, Third Support Level: 3703
First Resistance Level: 3766, Second Resistance Level: 3780, Third Resistance Level: 3800

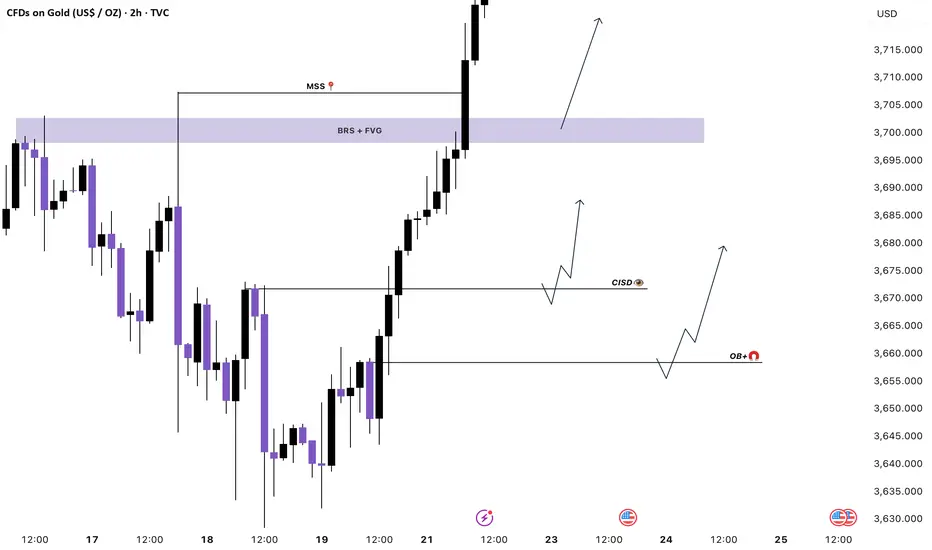
GOLD RETEST OR CONTINUE FLYING ? Gold Basic Buy Zones We Have
BREAKER BLOCK 3702 / 3698
FAIR VALUE GAP ZONE 3712 / 3700
CISD BUY 3671 / 3668
ORDER BLOCK ZONE 3658 / 3648
Follow The Trade , These Are Basic Zones Where Market Go Pullback Buy
Good Luck With Your Trading 🤞
Gold’s Bullish Run: Ascending Channel Targets $3715Hi guys!
Gold has been showing incredible strength lately. Earlier, it formed a Head and Shoulders pattern, broke out, and hit its target perfectly.
Now
Things are getting even more exciting. We’ve just seen a widening pattern develop , and price has already broken out of it to the upside. That’s another strong signal that bulls are firmly in control.
At the same time, gold is respecting a clear ascending channel, and with momentum pushing higher, the next key target sits around $3715, near the upper boundary of the channel.
As long as price holds above the broken pattern zone, the outlook stays strongly bullish, and dips are likely to be bought up quickly.
Trend: Bullish
Target: $3715
Disclaimer: As part of ThinkMarkets’ Influencer Program, I am sponsored to share and publish their charts in my analysis.

Analysis of gold price intraday trend!Market News:
In early Asian trading on Monday (September 22nd), spot gold prices saw slight fluctuations and are currently trading at $3,690 per ounce. Last week, after the Federal Reserve unanimously announced its first interest rate cut of the year on Wednesday as expected, the London gold price quickly broke through a record high of $3,700. The ongoing Middle East crisis and the Russo-Ukrainian conflict, now entering its third year, are also supporting gold's upward trend. This rally, which has lasted five consecutive weeks, is primarily driven by three factors: first, the market firmly expects the Federal Reserve to continue cutting interest rates in the second half of this year and even into 2026; second, the ongoing instability in the Middle East and the ongoing Russo-Ukrainian conflict; and third, the continued weakening of the US dollar. Although it rebounded slightly after the Fed's decision, it remains generally weak. The "sell on good news" principle seems to be reassuring. Looking ahead to this week, the market will be expecting a series of key data releases, including the September PMIs for the US, Japan, and Europe on Tuesday, the final US second-quarter GDP and durable goods orders on Thursday, the US PCE inflation report on Friday, and speeches by several Fed officials, particularly the views of new Fed member Milan. These data will directly impact the probability of a Fed rate cut in October, currently priced at 91.9%.
Technical Analysis:
Gold's daily chart showed a correction with consecutive declines. The New York closing price fell below the 10/7-day moving averages, with gold and the US dollar moving in lockstep. Friday's sharp rise saw a strong close in late trading, with the daily chart closing strongly positive. The New York closing price once again crossed above the 103660 MA, and the 7/5-day moving averages remained upward. Technically, the four-hour and hourly charts show gold prices re-entering the upper Bollinger Bands, with the moving averages forming a golden cross and opening upward, and the RSI indicator trading above its mid-axis. Early trading on weekly pullbacks is primarily for buying low, with selling high as a secondary consideration.
Trading strategy:
Short-term gold long at 3672-3675, stop loss at 3663, target at 3700-3720;
Short-term gold short at 3727-3730, stop loss at 3739, target at 3690-3670;
Key points:
First support level: 3675, second support level: 3662, third support level: 3646
First resistance level: 3703, second resistance level: 3716, third resistance level: 3728

ANFIBO | XAUUSD - What's the next plan today? [09.19.2025]Hello guys! It's me, Anfibo.
My previous OANDA:XAUUSD plan with the Sell entry at 3,670 – 3,674 delivered more than 400 pips in profit, confirming that the market reacted exactly as anticipated.
At present, observing the price structure, gold has completed a 5-wave Elliott impulse and is now transitioning into an ABC corrective phase. This is a classic scenario following a strong impulsive leg, where the market needs to rebalance before determining the next trend.
At the same time, the current price zone is also showing signs of forming a Head and Shoulders pattern, adding another layer of reliable technical confluence. This suggests that downside pressure remains in play, at least until the pattern is fully developed.
Key short-term resistance levels to watch are around 3,690 – 3,700 (maybe we will get a sell signal here)
Meanwhile, immediate support levels can be found near 3,630 – 3,620 – 3,615, with a deeper support at 3,590, which will be decisive for the longer-term bullish structure.
The preferred strategy is to wait for price reactions at these resistance confluence zones to look for short-term Sell signals, in line with the ongoing ABC correction.
Here's My Trading Plan
>> SUPPORT ZONES: 3645 - 3630 - 3615 - 3590
>> RESISTANCE ZONES: 3670 - 3680 - 3690 - 3700
>>> BUY SCALP
Entry: 3620 – 3615
SL: 3610
TP: 3650 – 3670
>>> SELL Scalp
Entry: 3670 – 3675
SL: 3680
TP: 3620 – 3590
Always set your Stop-Loss on every trade! Wishing everyone successful trading. XOXO

Gold Breaks Out of Range, Targeting Higher Resistance📊 Market Developments:
After consolidating in the 3643–3658 range, gold has broken out, moving up to 3665 in the US session. The rally is supported by safe-haven flows as expectations grow for further Fed easing, while the USD shows signs of stabilizing.
📉 Technical Analysis:
• Key Resistance: 3672–3675 (a breakout could extend toward 3685–3692).
• Nearest Support: 3658 (the breakout level) — if successfully retested, it may turn into new support.
• EMA 09: Price is now above EMA09 → confirming short-term bullish momentum.
• Candles / Volume / Momentum: A strong H1 breakout candle with higher volume confirms buyer dominance.
📌 Outlook:
• Gold has exited the sideways range and is trending higher in the short term.
• Holding above 3658 keeps the upside bias intact toward 3672–3685.
• Downside risk only emerges if price falls back below 3658.
💡 Suggested Trading Strategy:
• BUY XAU/USD at: 3658–3662 (on a retest after breakout)
🎯 TP: 40 / 80 / 200 pips
❌ SL: 3654
• SELL short-term only if a strong reversal signal appears around 3675–3685.
