Analysis of gold price intraday trend!Market News:
In early Asian trading on Monday (September 22nd), spot gold prices saw slight fluctuations and are currently trading at $3,690 per ounce. Last week, after the Federal Reserve unanimously announced its first interest rate cut of the year on Wednesday as expected, the London gold price quickly broke through a record high of $3,700. The ongoing Middle East crisis and the Russo-Ukrainian conflict, now entering its third year, are also supporting gold's upward trend. This rally, which has lasted five consecutive weeks, is primarily driven by three factors: first, the market firmly expects the Federal Reserve to continue cutting interest rates in the second half of this year and even into 2026; second, the ongoing instability in the Middle East and the ongoing Russo-Ukrainian conflict; and third, the continued weakening of the US dollar. Although it rebounded slightly after the Fed's decision, it remains generally weak. The "sell on good news" principle seems to be reassuring. Looking ahead to this week, the market will be expecting a series of key data releases, including the September PMIs for the US, Japan, and Europe on Tuesday, the final US second-quarter GDP and durable goods orders on Thursday, the US PCE inflation report on Friday, and speeches by several Fed officials, particularly the views of new Fed member Milan. These data will directly impact the probability of a Fed rate cut in October, currently priced at 91.9%.
Technical Analysis:
Gold's daily chart showed a correction with consecutive declines. The New York closing price fell below the 10/7-day moving averages, with gold and the US dollar moving in lockstep. Friday's sharp rise saw a strong close in late trading, with the daily chart closing strongly positive. The New York closing price once again crossed above the 103660 MA, and the 7/5-day moving averages remained upward. Technically, the four-hour and hourly charts show gold prices re-entering the upper Bollinger Bands, with the moving averages forming a golden cross and opening upward, and the RSI indicator trading above its mid-axis. Early trading on weekly pullbacks is primarily for buying low, with selling high as a secondary consideration.
Trading strategy:
Short-term gold long at 3672-3675, stop loss at 3663, target at 3700-3720;
Short-term gold short at 3727-3730, stop loss at 3739, target at 3690-3670;
Key points:
First support level: 3675, second support level: 3662, third support level: 3646
First resistance level: 3703, second resistance level: 3716, third resistance level: 3728
Goldlongterm

XAU/USD(20250922) Today's AnalysisMarket News:
Federal Reserve Board Governor Milan: Expects continued rate cuts in the coming months and will work to convince other policymakers to cut more quickly; Minneapolis Fed President Neel Kashkari: Two more rate cuts this year would be appropriate.
Technical Analysis:
Today's Buy/Sell Levels:
3667
Support/Resistance Levels:
3719
3700
3687
3647
3634
3614
Trading Strategy:
If the price breaks above 3687, consider entering a buy/sell position, with the first target at 3700.
If the price breaks below 3667, consider entering a sell position, with the first target at 3647.

Strategic Long-Term Perspective on GoldGold has delivered a strong bullish cycle after weeks of accumulation. The past phase showed a contracting range where liquidity was built up and multiple structural shifts occurred, signaling preparation for expansion. Once price broke out of that range in late August, momentum accelerated, leading to a clean and sustained rally into September.
The recent move highlights how market flow continues to favor the upside, with each correction acting as a re-accumulation zone rather than a trend reversal. Institutional order flow remains visible, supporting higher valuations as price respects bullish market structure.
Currently, gold is stabilizing after the sharp leg upward. This pause suggests a phase of healthy consolidation, likely absorbing liquidity before attempting the next impulsive wave higher. Overall sentiment remains constructive, with bullish continuation the dominant narrative unless a major structural shift occurs.

Has gold reached its peak?The Federal Reserve's meeting met expectations with a 25 basis point interest rate cut, which did not significantly stimulate the market.
Meanwhile, the market expects two more rate cuts in November and December this year. Gold briefly surged lower before retreating sharply. Is this a top or a normal correction in the bull market? The key to judging whether a market trend has ended is to look at the strength of the pullback.
From a technical perspective, the price of gold has fallen below the 5-day moving average and is currently between the 5-day moving average and the 10-day moving average. The focus below is on the support formed by the 10-day moving average. The support level is currently in the 3645-3640 range, and this range is also yesterday's low point. Gold's ability to hold above the 10-day moving average remains to be seen. If it holds, it is expected to continue its upward trend. Focus on the 3680 first-line pressure level. If it breaks through this pressure, gold is expected to hit above 3700 again. A break below 3645 could lead to further declines to the 3620-3600 range.

Gold is about to face a stormGold fell continuously but found support around the 3,660 level and began to rebound—just as mentioned yesterday, the 3,658-3,662 range is a top-bottom conversion zone. As long as this level remains unbroken, the bullish trend is not over. However, given the upcoming interest rate decision, we remain bullish but will no longer chase highs, as we need to be cautious of a sudden trend reversal. Remember: the unchanged long-term trend does not mean there will be no corrections amid the uptrend. When most people start celebrating, we must maintain awe for the market. Focus on resistance around 3,685-3,690 and support around 3,658-3,662.
Below are my personal views on the interest rate decision:
It can be said that a rate cut at this meeting is almost a foregone conclusion; the only uncertainty is whether it will be 25 or 50 basis points.
A 25-basis-point rate cut with a hawkish tone (45% probability)
Currently, market expectations for a Fed rate cut are extremely high. The mainstream expectation on Wall Street is three 25-basis-point cuts in September, October, and December, totaling 75 basis points. If the Fed’s statement and Powell’s press conference fail to hint at a further rate cut outlook or implicitly approve a consecutive cut in October, this could well be interpreted as a "hawkish rate cut," and market expectations will tighten afterward. This will be the biggest risk of this meeting—there is potential for a "buy the rumor, sell the fact" move in the short term, pushing the U.S. dollar higher. Conversely, assets like U.S. stocks and gold may face selling pressure due to "bad news after good news," combined with profit-taking and technical overbought conditions.
A 25-basis-point rate cut with neutral-to-dovish wording (45% probability)
Compared with the Fed’s June projections, both the number and magnitude of rate cuts have increased, but Powell maintains ambiguous and neutral wording. This will fully align with current market expectations. In this scenario, the U.S. dollar will likely trade sideways in a lower range in the short term, while assets like U.S. stocks and gold will consolidate in higher ranges. The market will wait for new signals to seek a breakout.
An unexpected 50-basis-point rate cut (10% probability)
This scenario would be like a shot in the arm in the short term. Although most assets (except the weakening U.S. dollar) will benefit temporarily, it may trigger market concerns that the Fed has surrendered to political pressure and lost its independence, as well as deep worries about the U.S. economic situation. At the same time, a sharp U.S. rate cut will drastically narrow the interest rate differential with overseas markets, leading to a tendency for large amounts of U.S. dollar capital to flow out of the U.S. market—this will put short-term pressure on U.S. stocks. Therefore, this scenario may not be a real positive for U.S. stocks. In contrast, gold will benefit as safe-haven demand continues to be boosted.

Don’t fight the market, act when the time is right!Driven by rising expectations of a Federal Reserve rate cut and a weakening US dollar, gold prices continued to climb this week, reaching a historic high of $3,700 on Tuesday. Market expectations are that the Fed will announce a 25 basis point rate cut in its upcoming meeting. If Chairman Powell further emphasizes concerns about the job market and confirms a path of three rate cuts this year in a subsequent press conference, gold prices are expected to gain renewed upward momentum.
From a technical perspective, the hourly chart shows solid support in the 3665-3660 range. If gold prices hold this level before the European session, it will provide a strong defensive foundation for bulls and can also be considered a useful reference area for short-term long positions. Once the price re-establishes itself at the 3700 level, it is expected to further challenge the 3710-3720 resistance level. A breakout with strong volume could open up further upside potential, continuing the bullish trend.
Prior to the Federal Reserve's interest rate decision, the market is likely to remain volatile at high levels, accumulating momentum for major news releases. We recommend primarily buying on dips. The current bull-bear watershed is 3650; if this level falls, be wary of the risk of a further correction.

Can gold break through the resistance level?Whether you go long or short, you can make money, the only exception is the greedy. To invest, you must block excitement, or at least don't get excited at the wrong time. Emotions play a key role in all transactions. Spend all your time studying trends, never go against the trends, learn to follow, and then you can learn the essence. There is no invincible general in the financial market, and a person cannot make money beyond the scope of cognition. Investing itself is an assessment of self-cognition.
After gold fell to 3626, it rebounded slightly. It is still in a state of volatility as a whole, and the volatility is narrowing. From a technical point of view, the bullish momentum has not been exhausted, and the sideways movement of the gold market at this stage is far from over. From a big cycle perspective, 3675 is not a high point. However, as the interest rate decision approaches, both bulls and bears may turn to wait and see, and the short-term market is expected to be dominated by fluctuations, waiting for the Fed's monetary policy guidance! The upper resistance level is the pressure level formed by the two recent high points, and the support is at the lower track of the rising channel and the strong support of 3600.

XAU/USD technical analysis Read The captionSMC Trading point update
Technical of Gold (XAU/USD) using the 4H timeframe. Let’s break down the idea behind it:
---
Key Technical Insights:
1. H4 FVG (Fair Value Gap) Zone:
The yellow box (~3602 zone) is marked as an imbalance area (FVG) where price is likely to retrace.
Market structure suggests that price may dip into this zone to fill the imbalance before continuing upward.
2. Price Pattern (Consolidation / Pennant):
Current price action shows a triangle/pennant-like consolidation after a strong bullish move.
This usually indicates continuation, but first, liquidity grabs may occur.
3. Liquidity Grab (Liquidity $$$):
The chart notes a liquidity sweep above resistance (~3659).
This suggests that price could fake out higher first, then drop to fill the FVG zone before resuming the bullish move.
4. Target Points:
Short-term downside target: 3602.487 (H4 FVG support).
Upside target 1: 3659.154 (liquidity area).
Upside target 2: 3699.778 (main bullish target).
5. RSI (Relative Strength Index):
Currently around 57–60, showing moderate bullish momentum but not overbought.
Supports the idea of a retracement before continuation.
---
Trade Idea Summary:
Bias: Bullish (after retracement)
Scenario:
1. Price may first grab liquidity (fake-out up) or directly retrace down.
2. Dip into the 3602 FVG zone.
3. Strong bounce expected → rally toward 3659 and 3699 targets.
Entry Idea: Look for long entries near 3602–3610 zone (confirmation with bullish candle patterns preferred).
Targets:
TP1: 3659
TP2: 3699
Stop-Loss: Below the FVG zone (~3580).
Mr SMC Trading point
---
Conclusion:
This is a bullish continuation setup where Gold could correct down into the H4 FVG zone before resuming its larger uptrend. The plan focuses on buying dips rather than chasing highs.
---
Please support boost 🚀 this analysis

Next week's Fed decision,Has the gold bull market peaked?Let's take a look at the trend of gold this week at the weekend. The strong bull market of gold has slowed down this week. After continuing to rise to 3600 on Monday, it rose and fell to a peak of 3675 on Tuesday. From Wednesday to Friday, it fluctuated at a high level. So, does gold still have the motivation to continue to rise in the current situation? Or is 3675 the ceiling? This recent surge in gold prices began at 3311, reaching a high of $364 at 3675. Based on previous upward trends, a bull market typically peaks just over $400. Therefore, with limited room above 3700, blind buying is discouraged. Be wary of a potential reversal of price action after reaching the peak, with the upper limit at 3750. All of this depends on the Federal Reserve's interest rate decision next week. The market will become increasingly cautious as we approach this date. Therefore, gold is currently adjusting at a high level, just shy of a final acceleration towards the top. The uncertainty remains as to whether this acceleration will occur before or after the Fed's decision. If the rate cut is just 25 basis points, gold will have no further momentum to rally. Buying on expectations and selling on facts will lead to a peak and decline upon the announcement. However, if the rate cut is aggressively implemented by 50 basis points, gold will likely experience further upward momentum, most likely leading to a decline after a sharp rise. Therefore, gold is currently in a tailspin. At the end of the bull run, it's best to be bullish rather than chasing the market. It's prudent to wait for a pullback at key support levels before resuming a bullish trend. Two key support levels to watch are 3580 and 3511-3512. Having already seen four consecutive weekly gains, there's a high probability of a negative correction next week. Even if gold does rally next week, it will be the final stretch. The world's largest gold ETF has been steadily reducing its holdings in recent days, with bulls gradually taking profits. We shouldn't be tempted to buy at high levels, especially for medium- and long-term investors. It's important to emphasize that the overall trend and direction of gold remains upward, directly linked to the weakening US dollar. However, market trends aren't linear. After each bullish cycle, there's a deep correction, and this cycle repeats. This is how trends form. See if this pattern persists. Trading, then, is a process of finding the right position, following the trend and the swings. A cost-effective position gives you the confidence to hold onto your position without panic. For gold on Monday, expect continued volatility. Upper pressure lies between 3655 and 3660. A breakout would undoubtedly trigger a test of the 3675 high, leading to a potential surge and then a decline. Whether it can reach 3700 depends on the strength of the market, but I don't think the probability is high, at least for Monday. Lower support lies between 3635 and 3630, the 618 golden ratio. A break below would signal a short-term bearish bias, potentially leading to further declines to the 3610-3600 support levels.

The decline is just an adjustment, gold still has new highsAccording to the strategy, we first arranged long orders near 3620, and the market rose smoothly to around 3650; then it fluctuated and consolidated, and according to the strength of the decline, we were prompted to go long again near 3640, and finally made a profit again near 3655, achieving two consecutive wins with open long orders, and reaping considerable profits overall. Congratulations to friends who have been paying attention. Many traders who blindly followed the trend and shorted in the market today are wailing, but we have always insisted on remaining unchanged in the face of change. After confirming the strong rhythm, we have made decisive and continuous attacks, steadily reaping profits, and the winning streak is still continuing.
Gold is fluctuating upward above the 3640 level. It is currently fluctuating around the 3650 level. The market's expectations for interest rate cuts have not cooled down. The market may continue to fluctuate at a high level in the later period. Although gold rebounded on Wednesday, it did not reach a new high. The main structure is still operating within the expected range. However, after the market has stood above 3650, it brings uncertainty to the trend. Therefore, gold is still treated with the idea of going long on pullbacks. Going long on pullbacks is still the general trend. In terms of operation, I believe that we will continue to go long as the pullback does not break.
From the 4-hour cycle, the bullish structure of gold remains stable. The short-term support below is around 3635-3625. The bullish strong dividing line has moved up to 3615. If this position is not broken, the pullback will rely on this area and continue to be bullish. At the daily level, as long as it stabilizes above 3615, the overall main tone of pulling back to low and long and following the trend will remain unchanged. In terms of operation, we should be patient and wait for the support to be confirmed. Low and long is still the general direction. As for the specific operation strategy of the counter-trend short position, I will remind you again at the key position, and everyone can pay attention to it in time.
Gold operation strategy: Go long when gold falls back to around 3640-3630, with the target at 3655-3660. Continue to hold if it breaks through.

Pullback for accumulation; bullish momentum remains promising.Gold broke upward against the resistance of the trendline, rising to a high of around 3,658. As indicated in the morning analysis, we have advised everyone to take partial profits first on positions entered below the 3,600 level to lock in gains. From the 1-hour candlestick chart, gold has consistently maintained a "gradual upward movement amid consolidation" rhythm, with lower lows continuing to move higher, and the stability of the trend structure is remarkable.
During a one-sided upward trend, the market's response to data is biased: bullish news will be amplified, while bearish news will be overlooked. One should not rely excessively on data for trading; more seasoned traders understand the logic behind the data and the current market environment.
For subsequent moves, when the price retraces to the hourly support level, those who have already taken profits can continue to follow up with long positions. We will closely track and analyze the market daily. If you lose your direction in such a market, you are welcome to follow us and leave a message for communication to obtain more targeted analysis and trading advice.

XAU/USD) Bullish trend analysis Read The captionSMC Trading point update
Technical analysis of Gold (XAU/USD) 1H analysis:
---
Technical Breakdown
1. Ascending Channel
Price is trending higher within a clear ascending channel, respecting both support and resistance trendlines.
The bullish structure remains intact as long as price holds above channel support.
2. Demand Zones (Yellow Boxes)
Price respected a Fair Value Gap (FVG) demand zone around $3,600 – $3,620, leading to bullish continuation.
Another demand area around $3,640 acted as a recent support after a market structure shift (MSS).
3. Market Structure
A bullish MSS confirms upside momentum.
Higher highs and higher lows support the ongoing bullish trend.
4. RSI (14)
RSI at 59.46, leaning bullish but not yet overbought — leaving room for continuation to the upside.
5. Target Point
Projection points towards $3,689 as the next target, aligning with channel resistance and Fibonacci extensions.
Mr SMC Trading point
---
Summary Idea
Gold is trading strongly within an ascending bullish channel, bouncing off demand zones and maintaining upward structure. As long as price holds above $3,640, the bias remains bullish with a target at $3,689.
---
please support boost 🚀 this analysis

Is gold at its peak?Gold has staged a "buy the rumor, sell the fact" move. The U.S. nonfarm payrolls data was bullish for gold, yet gold plummeted after the data release. There’s no need for confusion—it’s not as you might think, that bullish data means the price rises and bearish data means it falls. If it were that simple, everyone would be making money.
Data and fundamentals are reflected in prices, but such reflections can be ahead of time, lagging, exceeding expectations, or falling short of expectations. Judging which scenario it is depends solely on the historical database one has accumulated and long-term real-trading experience.
Today, I added to my gold positions twice and am still holding them. Even if the price falls further, my profits won’t decrease. This is because I believe today’s decline is most likely a result of some profit-taking traders closing their positions on the opportunity—after all, there have been no major bearish factors in the fundamentals yet. Whether a daily-level correction will occur still requires further observation. After all, since the rally started on August 20, there has been no real daily-level correction except for the sharp intraday pullback on September 4, and a correction would actually make the trend healthier.
The period from now to next week is a critical short-term window for gold. I will closely track and analyze the market every day. If you lose your direction in such a market, you can follow me or leave me a message.

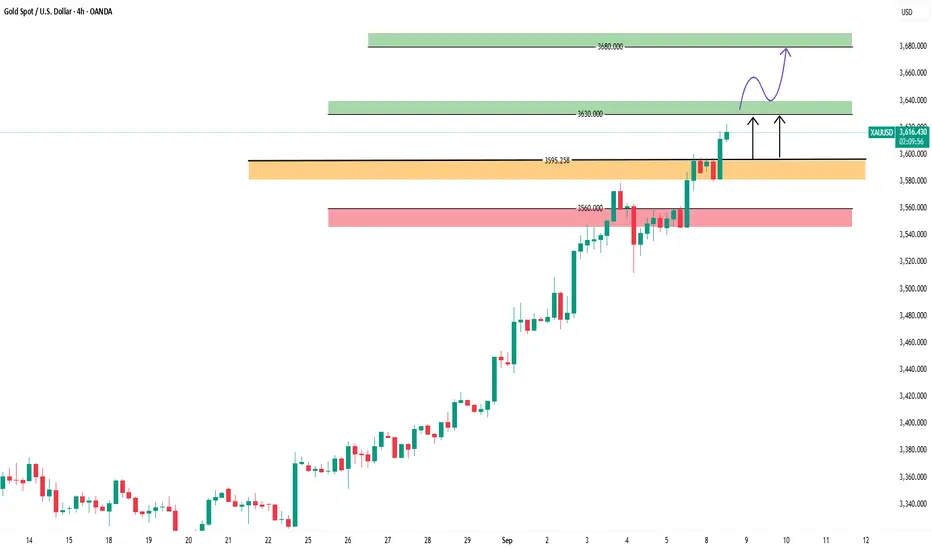
GOLD– Market Outlook
🔼 Bullish Scenario:
• If the price holds above 3635, the upward momentum is expected to continue.
• Target: 3675 (main resistance level).
• If 3675 breaks, the price may rise further and enter the bullish zone.
🔽 Bearish Scenario:
• If the price stabilizes below the retracement level, a temporary correction may start.
• Target: 3595 (strong support).
• If the price breaks below 3595 and closes under it (especially on the 1h or 4h timeframe):
→ The next bearish target will be 3546.
⚠️ However, if 3595 holds and is not broken, the price will likely bounce and resume the bullish trend.
⸻

GOLD analysis in time frame 4h
🔹 If price trades above 3595:
• The trend will likely continue upward toward the resistance level at 3630.
• A breakout above 3630 and holding above it (on the 4-hour or 1-hour candle) would confirm a continuation upward toward 3680.
⸻
🔹 If price fails and breaks below 3595:
• The trend will likely move downward toward the support level at 3560.
• This support is strong, but if it is broken, the trend may fully shift into a deeper decline.
⸻
📌 In short:
• Above 3595 → bullish trend (targets 3630 → 3680).
• Below 3595 → bearish trend (targets 3560 → further downside).
XAUUSD Ready for a slight Pullback ?XAUUSD Still way Bullish on every time frame. This could do a little pull back on H4 and D1 Analysis. What are your thoughts ? Check your support and resistances and open positions accordingly. Wait for Price Again and strong solid breakouts to enter the market.
Disclaimer:
The content presented in this IMAGE is intended solely for educational and informational purposes. It does not constitute financial, investment, or trading advice.
Trading foreign exchange (Forex) on margin involves a high level of risk and may not be suitable for all investors. The use of leverage can work both for and against you. Before deciding to participate in the Forex market, you should carefully consider your investment objectives, level of experience, and risk tolerance.
There is a possibility that you may incur a loss of some or all of your initial investment, and therefore, you should not invest money that you cannot afford to lose. Be fully aware of all the risks associated with foreign exchange trading, and seek advice from a licensed and independent financial advisor if you have any doubts.
Past performance is not indicative of future results. Always trade responsibly.

XAU/USD – Near-Term Trade Plan
📍 Current Price: 3416
🔼 Buy Setup
Entry: Above 3425–3430
Target 1: 3450
Target 2: 3480
Stoploss: 3395
🔽 Sell Setup
Entry: Below 3390
Target 1: 3360
Target 2: 3330
Stoploss: 3420
Right now, this is not a strong bullish breakout yet because volume is missing.
If gold closes above the upper trendline (around 3450+) with big volume, that’s a valid breakout → target = height of triangle (~300–400 points).
If it fails near resistance and comes back inside the triangle, expect pullback towards 3300–3250 zone (lower trendline).

WILL GOLD BREAK THE BOX : LETS ASK FROM GOLD Hello
Iam Expect From gold that i will see it will break the consolidation box
Buy Gold When Its Break The Box And Continuation Buying Gold
Gold Give A Bullish FVG So We Are Expecting Bullish Momentum
Gold Buy At Bullish FVG And 3376 / 3370 Buy Zone
Manage Your Trade , Good Luck With Your Trading

Gold Breaks Descending Trendline After Support RejectionHello guys!
Price touched the major support level at the recent low, confirming buyers’ activity.
After that, a QM (Quasimodo) pattern formed, often seen before reversals.
The descending trendline has been broken, showing weakness in bearish momentum and a potential shift to the upside.
A long entry can be considered in the QM blue zone, which is now acting as a demand area.
As long as price holds above this zone, the bias remains bullish, with potential for continuation higher.

Gold fell to 3325 after the US and EU reached a trade agreement📊 Market Overview
Gold is consolidating as traders await Fed Chair Powell’s speech at Jackson Hole. A slightly firmer USD is acting as a mild headwind.
Reuters reported spot gold trading around $3,340/oz earlier today with a wait-and-see tone.
📉 Technical Analysis
• Key Resistance: 3,361 → next levels 3,375–3,400.
• Nearest Support: 3,323 → next levels 3,300–3,285.
• EMA: Price is trading below EMA50, signaling short-term bearish pressure.
• Pattern / Momentum: Market is in a consolidation phase, with selling pressure emerging near resistance. Bearish bias likely if 3,350–3,361 fails to break.
📌 Outlook
In the short term, gold is expected to range-trade between 3,323 and 3,361.
• Holding above 3,323 favors a bounce toward 3,340–3,350.
• A break below 3,323 risks a move down to 3,315–3,310.
💡 Suggested Trading Strategy
SELL XAU/USD at: 3,350–3,360
🎯 TP: ~3,330 ❌ SL: ~3,370
BUY XAU/USD at: 3,330–3,322
🎯 TP: ~3,350 ❌ SL: ~3,312

XAUUSD/SELLAfter the release of the Federal Reserve minutes yesterday, gold prices rose to 3352 but didn't rise further. The minutes mentioned several key points, namely inflation and unemployment. Overall, the unemployment rate is more important than the inflation rate. Meanwhile, the renewed talks between Russia and Ukraine seemed uneventful, and the meeting went smoothly. As a result, gold prices fell again after the Asian market opened.
The current price is 3337, down approximately $15/ounce from 3352, indicating that upward pressure remains. During this pullback, we need to watch whether the decline can be halted around 3330-3335. If not, we need to wait for a lower level, around 3310. Today is Thursday. Focus on the impact of the initial jobless claims data on gold prices.
For trading, you can still refer to the current selling strategy. While waiting for a decline, confirm the presence of support below. Currently, there is no major news to boost gold prices. Remember to manage your trading risk. Set take-profit and stop-loss orders to prevent extreme market fluctuations from adversely affecting your account.

XAUUSD/BUYIt seems that bulls have seized a good opportunity. 3345 appears to have stabilized. Long positions can be more firmly established.
Buy at 3345, TP3360, SL3330

XAUUSD/BUYSure enough, gold prices rebounded after retreating to 3338, resulting in a short-term price increase of $8 per ounce.
The gold market is awaiting news to drive a rally. Just now, when it was about to hit 3350, it retreated. I interpret this as a tentative rise, as bulls are currently in control. This test is merely a test to see if bears will launch a counterattack. As expected, the bull-bear game is a tug-of-war. Both bulls and bears are now vying for the crucial 3345 level. This level serves as a short-term reversal point for the month. If bulls seize this level, the market will continue to rise. If bears seize this level, the market will experience short-term downward fluctuations.
In the latter half of the New York market, I believe the market will fluctuate within a range of approximately $10. The Swing Trading Center recommends continuing to buy.
