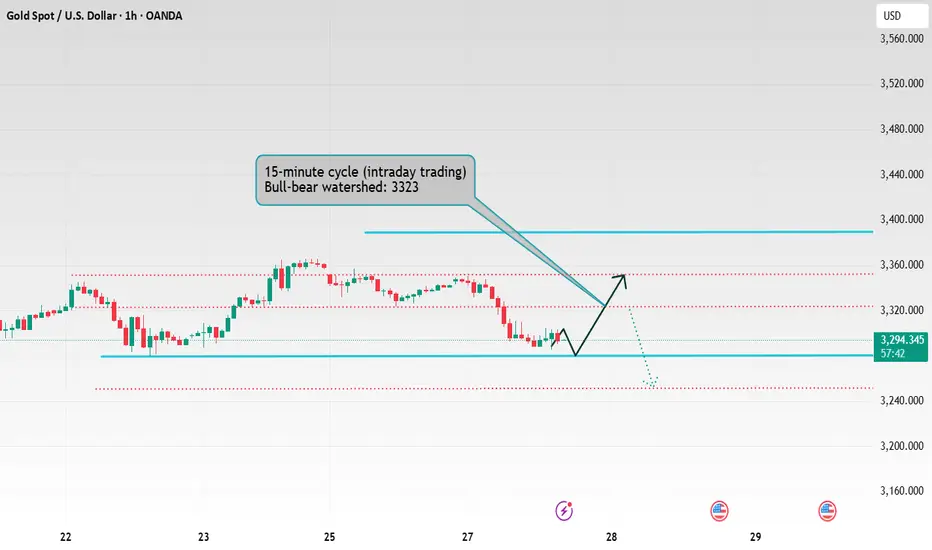
Gold 3315 gains and losses are the key
📌 Driving events
From the news perspective, data released by the U.S. Department of Commerce on Tuesday showed that U.S. durable goods orders in April plunged 6.3% month-on-month, with an expected value of -7.8% and a previous value revised from 9.20% to 7.50%. Volatile commercial aircraft orders plunged 51.5% in April after rising in March. Boeing said it received only eight aircraft orders in April, the lowest since May 2024, far lower than the 192 orders in March, the highest since 2023. Affected by the sharp drop in commercial aircraft orders, U.S. durable goods orders fell more than expected in April, with core capital goods orders (excluding aircraft and military hardware) falling 1.3%, the biggest drop since October last year. Under the influence of uncertainty in tariffs and tax policies, corporate investment willingness is weakening.
Through the data, it is not difficult to find that American companies have shown obvious caution in assessing the demand outlook and have shifted their focus to cost reduction, which directly reflects the impact of uncertainty brought about by Trump's trade policy. At the same time, the tax legislation being debated in Congress has also put companies on the sidelines, further suppressing the impulse to invest.
📊Comment Analysis
After the pullback on Monday this week, the decline accelerated on Tuesday, and the continuous decline came back, changing the strong upward trend of last week
💰Strategy Package
In terms of operation, in the short term, long and short operations can be carried out in the range of 3315-3297 US dollars, and the support position of 3285/80 should be paid attention to below; medium and long-term investors can buy on dips and take advantage of geopolitical risks and the trend of weak US dollars to gradually establish long positions.
⭐️ Note: Labaron hopes that traders can properly manage their funds
- Choose the number of lots that matches your funds
- Profit is 4-7% of the fund account
- Stop loss is 1-3% of the fund account
Goldlongterm

Spot gold fell below the 3330 mark
📌 Driving events
The trend of gold prices this week needs to focus on the following three major risk events:
First, the confrontation between Israel and the Houthis intensified this week. On May 25, the Houthis used hypersonic missiles to attack Israel's Ben-Gurion International Airport for the first time, resulting in the interruption of airport operations. Israel subsequently launched a retaliatory air strike. Iran has made it clear that it "will not give in on uranium enrichment activities" and warned that it will take hundreds of alternatives if it is sanctioned
Second, although the Trump administration's threat to impose a 50% tariff on the European Union has been postponed to July 9, the market is still concerned about it. If the trade war escalates, it may lead to increased global economic uncertainty, which will in turn boost the safe-haven demand for gold. However, the repetition of tariff policies may also trigger changes in market risk preferences and have a two-way impact on gold prices.
Third, record-breaking air strikes in the Russian-Ukrainian conflict Russia launched the largest air strike since the war on Ukraine on May 26, launching 355 drones and 9 cruise missiles, and many parts of Ukraine suffered heavy losses. The attack has heightened market concerns about geopolitical risks, pushing gold prices higher in the short term. However, due to expectations of a prolonged conflict, market demand for safe-haven assets may gradually weaken. Technically, gold has performed strongly at support levels near $3,330.
📊Commentary Analysis
This week, gold prices will remain highly volatile under the intertwined influence of multiple risk events. Investors need to remain vigilant and flexibly adjust strategies to respond to market changes. Analyze the market, make plans, and manage risk.
💰Strategy Package
In terms of operations, investors are advised to pay close attention to the situation in the Middle East and the progress of Trump's tariff policy. In the short term, short selling can be carried out in the range of $3,330-3,305, with a target of around $3,290-3,280. Profits can be taken in batches, and a light position can be taken long after breaking through $3,310, with a target of $3,360-3,380. Profits can be taken in batches, and medium- and long-term investors can make layouts on dips, taking advantage of geopolitical risks and the trend of a weak dollar, and gradually establish long positions.
⭐️ Note: Labaron hopes that traders can properly manage their funds
- Choose a lot size that matches your funds
- Profit is 4-7% of the capital account
- Stop loss is 1-3% of the capital account
Will gold remain high as it does not break previous highs?
📊Technical aspects
Gold's 1-hour moving average begins to flatten and turn, so gold may start to fluctuate. In fact, after the last breakout of the box-shaped oscillation, gold may start to build a new box-shaped oscillation, and it is still at a high level of oscillation, so you can continue to short at high levels. In addition, gold has already formed a double-top structure in one hour. If it cannot break through, then gold is likely to fall under pressure from the double top.
The market is changing rapidly, pay attention to the current market. If gold can strongly break through the previous high in the US market, then the volume of gold bulls may restart.
💰 Strategy Package
Short Position:3345-3350

Gold bulls push prices to around 3355
📌 Driving events
Gold prices rose more than 0.50% and held above the $3,300 mark, driven by renewed safe-haven demand and rising geopolitical tensions in the Middle East. As of writing, gold/USD is trading around $3,317, rebounding from an intraday low of $3,285.
Market sentiment remains fragile, with US stocks falling into negative territory and US Treasury yields slightly higher. All eyes are on the upcoming vote on President Trump's tax reform plan. According to estimates by the Congressional Budget Office (CBO), the plan could lead to an approximately $3.8 trillion expansion of the US national debt. Uncertainty about the fiscal outlook continues to stimulate demand for gold as a defensive asset.
📊Comment Analysis
Gold price recovery is good, pay attention to the 3358 price area, adjust downward, and continue to accumulate funds around 3300
💰Strategy Package
🔥Sell gold area: 3358-3360 SL 3365
TP1: $3350
TP2: $3337
TP3: $3322
🔥Buy gold area: $3284-$3276 SL $3270
TP1: $3300
TP2: $3320
TP3: $3340
⭐️ Note: Labaron hopes that traders can properly manage their funds
- Choose the number of lots that matches your funds
- Profit is 4-7% of the fund account
- Stop loss is 1-3% of the fund account

Will gold continue to rise as risk aversion heats up?
📌 Gold driving factors
At present, the current market sentiment has turned cautious, driving safe-haven funds into gold. Previously, Moody's downgraded the US sovereign credit rating, and President Trump's promotion of a large-scale tax cut bill is expected to be passed by Congress, further strengthening the theme of "selling the United States" and exerting continuous pressure on the US dollar.
In addition, the resurgence of disputes between the United States and China on the chip issue, and the news that the Group of Seven is considering imposing tariffs on cheap Chinese products, have exacerbated the uncertainty of the global economic outlook, further suppressing the US dollar, while supporting gold, a traditional safe-haven asset, to an eight-day high. Gold prices also benefited from the heating up of geopolitical tensions. CNN reported that several US officials revealed that Israel is preparing to launch a strike on Iran's nuclear facilities.
📊Commentary Analysis
The current market is still running in a range of shocks. Therefore, the US market is still trading repeatedly around the range for the time being. For the time being, the small range will temporarily look at the 3320-3285 line!
💰Strategy Package
Gold: Short when it retreats to around 3325-3320, stop loss at 3330, target around 3290! For long orders, look at the support situation and then enter the market at the right time!
⭐️ Note: Labaron hopes that traders can properly manage their funds
- Choose the number of lots that matches your funds
- Profit is 4-7% of the fund account
- Stop loss is 1-3% of the fund account

Gold breaks through 3300, where is the next stop
📌 Driving events
Beth Hammack, president of the Federal Reserve Bank of Cleveland, stressed that the current US government's policies make it increasingly challenging for the Federal Reserve to effectively guide the economy and fulfill its dual mission of maintaining price stability and full employment. She also warned that the risk of a stagflationary environment (characterized by stagnant growth and persistent inflation) is rising. In contrast, Alberto Musalem, president of the Federal Reserve Bank of St. Louis, recently said that the current monetary policy stance is still appropriately adjusted.
Despite rising US Treasury yields, gold has struggled to gain support, indicating that higher yields alone are not enough to drive safe-haven demand under the current circumstances.
However, global monetary easing policies may provide support for this precious metal. In the latest moves during the Asian trading session, the People's Bank of China (PBoC) cut its benchmark interest rate, followed by the Reserve Bank of Australia (RBA) unexpectedly cutting the cash rate from 4.10% to 3.85% - moves that usually support non-yielding assets such as gold.
📊Comment Analysis
Spot gold prices have extended gains in recent intraday trading, taking advantage of its stability above EMA50 and trading along a bullish trend line on a short-term basis, strengthening its ability to reach the main resistance level of $3,300 and break it. Some weak signals have appeared on technical indicators. We noticed that a negative overlap signal has formed on the RSI, and after reaching overbought levels, this indicates that a temporary adjustment is needed on the upward action. Therefore, gold has reduced some of its early gains and waited for clearer signals to continue the bullish trend.
💰Strategy Package
🔥Sell Gold Zone: 3354-3356 SL 3361
TP1: $3345
TP2: $3332
TP3: $3320
🔥Buy Gold Zone: $3252 - $3250 SL $3245
TP1: $3260
TP2: $3270
TP3: $3280
⭐️ Note: Labaron hopes that traders can properly manage their funds
- Choose the number of lots that matches your funds
- Profit is 4-7% of the fund account
- Stop loss is 1-3% of the fund account

Gold fell below 3,200 today?
📌 Driving Events
In early Asian trading on Tuesday, gold prices (XAU/USD) fell slightly to around $3,230, affected by a slight rebound in the US dollar (USD). However, continued concerns about the health of the US economy - especially after Moody's recent credit rating downgrade - may help limit further downside for precious metals. The rebound in the US dollar has curbed the upward momentum of dollar-denominated assets such as gold. Nevertheless, heightened economic uncertainty is still supporting safe-haven demand. Moody's downgraded the US sovereign rating from "Aaa" to "Aa1" on Friday, citing its rising debt levels and interest payments that have exceeded other similarly rated countries. These developments have kept risk sentiment fragile and provided potential support for gold prices.
📊Comment Analysis
Accumulating along the upper and lower trend lines, the gold price will break out and require more liquidity than the downward trend
💰Strategy Package
🔥Sell Gold Zone: 3224-3226 SL 3230 Scalping
TP1: $3215
TP2: $3208
TP3: $3200
🔥Sell Gold Zone: 3276-3278 SL 3283 Scalping
TP1: $3260
TP2: $3250
TP3: $3240
🔥Buy Gold Zone: $3152 - $3150 SL $3145
TP1: $3165
TP2: $3180
TP3: $3195
⭐️ Note: Labaron hopes that traders can properly manage their funds
- Choose the number of lots that matches your funds
- Profit is 4-7% of the capital account
- Stop loss is 1-3% of the capital account

Putin's phone call changed the market?
📌 Driving Events
Putin's "peace smoke bomb", gold is under short-term pressure
Just when gold was soaring due to risk aversion, a piece of news on Monday cooled the market instantly - after Putin and Trump talked on the phone, both sides released the signal that "Russia and Ukraine will soon ceasefire negotiations." Trump even announced loudly: "Russia and Ukraine will start ceasefire negotiations immediately!"
US President Trump said, "We will do everything we can to stop the conflict in Ukraine."
This news caused the market's risk appetite to rise briefly, and the gold price fell slightly to around $3,220 in the Asian market on Tuesday. But senior observers soon discovered that Putin's words were full of diplomatic rhetoric - he only said that the peace efforts were "on the right track" but did not promise a specific ceasefire time. Former Swedish Prime Minister Bilt pointed out: "This is Putin's victory. He successfully delayed the ceasefire pressure while continuing military operations."
Market truth: Geopolitical risks have not really subsided, and the safe-haven demand for gold is only a short respite.
📊Comment analysis
For investors, the question now is not "whether to buy gold", but "when to buy and how much to buy". At the moment when the global economic order is being reconstructed, the light of gold may have just begun to shine.
💰Strategy Package
Bullish breakout scenario: If the price breaks through the high of last Friday's rebound at $3,252 and continues to rise, you can go long with a light position near $3,260, targeting the $3,280-$3,290 range.
Bearish breakout scenario: If the price breaks below the key support level of $3,200 and further declines, you can go short near $3,190, targeting the $3,170-$3,160 range.
⭐️ Note: Labaron hopes that traders can properly manage their funds
- Choose a lot size that matches your funds
- Profit is 4-7% of the capital account
- Stop loss is 1-3% of the capital account

Beware! Gold Falls
📌 World Situation
Gold prices fell more than 1.5% on Friday and are on track to close the week with a loss of more than 4% as improving risk sentiment drove investors away from safe-haven assets and into stocks and other riskier investments. At the time of writing, XAU/USD was trading around $3,187, retreating from a daily high of $3,252.
The precious metal started the week lower following a reported significant de-escalation in the US-China trade conflict, including an agreement by both sides to reduce tariffs by 115%. Despite trading between $3,120 and $3,265 throughout the week, gold prices struggled to maintain bullish momentum, with weakening buyer interest becoming increasingly apparent against the backdrop of stronger risk appetite and encouraging US economic data.
📊Comment Analysis
Will be greatly affected by tariff news and Russia-Ukraine peace talks
💰Strategy Package
Resistance: $3265, $3357
Support: $3160, $3112
In this range, you can enter the market in batches in real time to flexibly grasp the market changes.
⭐️ Note: Labaron hopes that traders can properly manage their funds
- Choose the number of lots that matches your funds
- Profit is 4-7% of the capital account
- Stop loss is 1-3% of the capital account

Technical & Historical Key TakeawaysThis chart analyzes the historical price cycles of Gold (XAU/USD) over the past decades, focusing on the alternation between long bull runs and prolonged bear markets.
You highlighted clear phases:
1970 - 1980: 10-year Bull Run
Massive price rally, followed by a sharp correction.
1980 - 2001: 20-year Bear Market
Prolonged sideways and downward movement.
2001 - 2011: 10-year Bull Run
Strong upward trend, reaching new all-time highs.
2011 - 2016: 5-year Bear Market
Significant correction but shorter in duration.
2016 - 2025: 10-year Bull Run
Another strong bullish phase, possibly ending in May 2025.
🔮 Scenarios projected:
Scenario 1 (Blue path):
A shorter bear market (5 years) similar to 2011-2016 correction, then continuation of the long-term uptrend.
Scenario 2 (Yellow path):
Gold enters a long-term 20-year bear market, similar to what happened post-1980.
You are asking if Gold is now entering a short bear phase (Scenario 1) or will fall into a multi-decade bear market (Scenario 2).
Cyclicality of Gold:
Gold has shown repetitive cycles of 10-year bull runs followed by either short (5-year) or long (20-year) bear markets.
These cycles seem to reflect macroeconomic shifts (inflation, interest rates, global crises).
Current Cycle (2016 - 2025):
If we respect the pattern, May 2025 might mark the end of the current bull cycle, opening the door to a corrective phase.
Scenario 1 favors a soft correction:
Based on the last cycle (2011-2016), a 5-year bear market might occur.
This would keep the long-term bullish trend alive, especially if macroeconomic conditions stay inflationary or geopolitical risks remain high.
Scenario 2 warns of a harsh bear market:
If history repeats the 1980-2001 phase, gold could enter a multi-decade bear market, driven by reduced inflation fears, strong dollar cycles, or financial system stability.
Key Indicators to watch:
Real interest rates.
USD strength vs global currencies.
Demand from central banks and emerging markets.
Geopolitical tensions and inflation expectations.

Gold, false decline, real wash
📊Comment analysis
The recent surge and plunge of gold has also led to many different opinions on the market trend. If it rises, look at the ceiling, and if it falls, look at the floor. Most of them are such remarks, and the misleading nature of such remarks can be imagined. The first time I chased more at 3500, it was okay. After the beginning of the month, I soon got the opportunity to get out of the trap. But those who chased higher at 3400 twice last week were not so lucky. Opportunities cannot always be there, and not every time you can survive.
Once you have the idea of standing guard or holding on, it means you will lose. In the face of huge fluctuations in prices, short-term card points, and few positions can be grasped. You can't just rely on a rumor on the Internet to chase shorts and look at bear markets when prices fall, and chase longs and look at bull markets when prices rise. Investing and trading are two different things. Investment is a direction, focusing on large cycles, large directions, long-term, and profiting by time. Trading, on the other hand, makes money by rhythm and fluctuations, which are completely two concepts.
I have always said that the general direction is bullish and the rhythm is to get on board after every retracement. The transaction is divided into short, medium and long. The short-term is limited to intraday. Whether it is right or wrong, it is settled on the same day. The medium-term wave band, after each large retracement, insist on getting on board in batches, and leave after a phased rise. For the long-term, after each large retracement, build positions in batches and hold for a long time. First, make the logic clear, and then talk about the operation. We can't achieve the lowest or highest, but as long as we achieve a relatively low or high position, it will be fine.
The core of investment is the cycle, and the core of trading is the rhythm. If the rhythm is right, everything is right.
In the face of the sharp rise and fall of gold, first, don't hold a heavy position, and second, as long as it is not a relatively high or relatively low chasing order, there is no need to panic. First, if you hold a heavy position, first of all, you can't withstand the fluctuations, you can only bet on the win or loss of one order, and there will be no next chance. Secondly, as long as you chase long at high positions and short at low positions, even if you have a light position, you will not have a chance to get out of the trap, and you can only make up for the loss through new transactions. There is no other way, but to achieve unity of knowledge and action, and don't think about it. Heavy positions, plus chasing back and forth, plus the world lock, will only die faster and will not get out of the trap. Take care of yourself.
Let's talk about the market. First of all, the bull is still there. Secondly, the sharp drop and surge are wash-outs and adjustments, not the peak, but the base is large and the amplitude is large, so you have to reduce your position. At present, it is a large-scale range shock wash-out adjustment at the daily level, and a weekly level retracement, not the peak. It will be very clear if you look at the big cycle, and you must not listen to the rumors flying all over the sky. If it rises, chase high to see new highs, and if it falls, chase short to see new lows. It is not advisable. Again, remember one thing, grasp the relative highs and lows, let the wind and waves rise, and sit on the fishing boat steadily.
After the U.S. market plummeted, it directly reversed and surged. This kind of market will not continue. Don't chase it. Don't see the plummet and then the surge, and then shout that the bottom has been reached. The plummet means the peak, and the surge means the bottom has been reached. Isn't it a life-and-death situation every day?
The U.S. market directly talked about the next area. After the sell-off, gold rebounded sharply yesterday, which gave the trapped orders an opportunity to escape, not a direct reversal. Next, gold will enter a large range of shocks and washes with 3260 as resistance and 3150-3120 as support. After the shock, it will finally experience a wave of sell-offs and break the new low, and then it will bottom out. The bottoming logic is the same as the May Day period. Before May Day, gold continued to maintain above 3260 for washing. After May Day, it directly broke below 3260 and touched 3200 and then rose. Next, it will be the same. After a period of washing and shock, it will fall below the low of 3120 again, hit a new low and bottom out, and start to rise. The rhythm is like this, it depends entirely on courage, patience and technology, chasing ups and downs is not advisable. The rhythm is like this, watch more and do less, hold tight, and fasten your seat belts.
⭐️ Note: Labaron hopes that traders can properly manage their funds
- Choose the number of lots that matches your funds
- Profit is 4-7% of the capital account
- Stop loss is 1-3% of the capital account

Gold Holds Key Support Ahead of CPIOANDA:XAUUSD Gold (XAU/USD) edged higher to $3,255 early Tuesday as traders awaited the US April CPI report. While the 90-day US-China tariff truce improved market sentiment and limited gold’s upside, geopolitical tensions in Ukraine, the Middle East, and South Asia continue to drive safe-haven flows. A de-escalation in US-China trade tensions triggered the recent pullback, with price failing to reclaim the $3,271 resistance. The $3,213 area remains a major support. A break above $3,271 is needed to resume bullish momentum, while failure to hold $3,213 could expose $3,127.
Resistance : $3,271 , $3,305
Support : $3,213 , $3,127

Gold falls below 3200, continues to look at 3100
📌 Driving factors
As Sino-US trade tensions ease, market concerns about a global recession ease, investors' risk appetite rises, and gold's attractiveness as a safe-haven asset declines, gold prices fell on Wednesday (May 14). After the tariff truce announced over the weekend, the stock market rose sharply, weakening gold's safe-haven appeal in the short term, which was an important factor that pushed gold prices to new highs in the previous few months, and it is also the starting point for the current large-scale selling!
📊Commentary Analysis
The price trend of gold on Tuesday showed a significant repeated shock feature. Although it ended up rising, it experienced two tortuous processes of first falling and then rising in the process, which led to a relatively limited overall increase. After the previous day's correction, the current 5-day moving average and the 10-day moving average formed a dead cross and continued to extend downward. From the perspective of intraday trading, the resistance level formed by these two moving averages has become the focus of market attention.
In the morning article, I repeatedly emphasized that gold is expected to break below 3200. Sure enough, it broke below without hesitation today. It is currently at 3185. The short position of gold near 3250 that we gave yesterday has expanded its profit again today, and it is easy to make a profit of nearly 100 points. Today, the US market operation is still mainly shorting, and it can continue to short near the rebound of 3200.
💰Strategy Package
Today, the US market operation is still mainly shorting, and it can continue to short near the rebound of 3200, with the target near 3170-3180.
Labaron believes
Guaranteeing the principal is the bottom line for survival, controlling risks is the armor for survival, earning income is a staged medal, and long-term stable and continuous profit is the only proof that it can finally stand up from the mountains of corpses and seas of blood.

Gold has now fallen by 3200, and the next support level is 3160
📌 Driving factors
As Sino-US trade tensions ease, market concerns about a global recession have eased, investor risk appetite has increased, and the attractiveness of gold as a safe-haven asset has declined, and gold prices fell on Wednesday (May 14). After the tariff truce announced over the weekend, the stock market rose sharply, weakening the safe-haven appeal of gold in the short term, which was an important factor that pushed gold prices to new highs in the previous few months, and it is also the starting point for the current large number of sell-offs!
Driven by bargain hunting, gold prices rebounded on Tuesday, and the weaker-than-expected US inflation data released that day also helped gold prices rise. However, trade optimism limits the strength of gold's rebound.
📊Commentary Analysis
Gold began to fall in the early trading of the US market and is about to fall to our expected point. The support below is 3160!
💰Strategy Package
🔥Selling Gold Area: 3245-3240 SL 3250
TP1: $3230
TP2: $3210
TP3: $3190
🔥Buying Gold Area: $3167-$3165 SL $3160
TP1: $3178
TP2: $3189
TP3: $3200!
Labaron believes
Guaranteeing the principal is the bottom line for survival, controlling risks is the armor for survival, earning profits is a stage medal, and long-term stable and continuous profits are the only proof of being able to stand up from the mountains of corpses and seas of blood.

Gold fluctuates repeatedly and is expected to fall below 3,200
📌 Driving factors
The U.S. Department of Labor's Bureau of Labor Statistics announced on Tuesday that the U.S. Consumer Price Index (CPI) rose 0.2% month-on-month in April, lower than the 0.3% expected by economists. However, analysts warned that inflation may rise as tariffs gradually push up commodity prices.
The United States and China announced on Monday that they would suspend tariffs for 90 days. According to the statement made by both sides after the Geneva talks last weekend, the United States will reduce tariffs on Chinese imports from 145% to 30%, and China will reduce tariffs on U.S. imports from 125% to 10%.
Driven by bargain hunting, gold prices rebounded on Tuesday, and the weaker-than-expected U.S. inflation data released that day also helped gold prices rise. However, trade optimism limits the strength of gold's rebound.
📊Commentary and analysis
Gold fell and then rose yesterday, and the final rebound stopped at 3,266. The trend is in line with our bearish expectations. As for the repeated fluctuations in the market, it is just a futile effort! Yesterday, due to the influence of the US CPI data, although gold rose in the short term, it was still under pressure and weakened. Today, the Asian session continued to fall in the early trading. As the support position near 3210 points is approaching, aggressive shorting is no longer appropriate!
In terms of trend, the 4-hour level trend of gold is still under pressure. Yesterday, it was under pressure at the 3260 line, and then the market fell back. Recently, it has maintained a trend of continuously moving down lows, and the rebound highs are gradually decreasing. It can be seen that the bulls are less willing to attack, which is different from the previous surge. Gold adjustment has become inevitable.
💰Strategy Package
Rebound short: short near 3265, stop loss 3269, target near 3220!
Labaron believes that
Guaranteeing the principal is the bottom line for survival, controlling risks is the armor for survival, earning income is a stage medal, and long-term stable and continuous profit is the only certificate to finally stand up from the sea of corpses and blood.

Gold is also hesitating whether to break the position or not.
It is not unfair to say that gold fluctuates slowly.
I mentioned in my article yesterday that it depends on the closing level of gold. Different closings represent different meanings. 3235 was treated as the standard watershed on that day. As a result, gold fluctuated sideways in the afternoon despite the rebound of US stocks. In terms of the daily structure, it closed with a middle-yin candle with a lower shadow, and closed flat at 3235.
There is more than 200 points of pressure above, and it can close flat, which means that gold does have something. Of course, just closing flat does not completely mean that gold bulls are back. It can only be said that bulls are still in the market and have not completely fled. Then it is normal for gold to rebound after testing 3200 again and receiving support.
There are also reasons in terms of market sentiment. Judging from the main speculative sentiment report, it has been a long-term horizontal bullish trend. From the perspective of capital sentiment, global stock markets were soaring on Monday. The easing of the trade war between the world's two major economies encouraged funds to no longer simply entrench themselves in gold and began to bloom in multiple directions.
That being said, let's count them: 91% of retaliatory tariffs were canceled; 24% of reciprocal tariffs were suspended for 90 days; 20% of fentanyl tariffs were not mentioned; 10% of universal tariffs remained the same.
The current retained tariffs are still very high, and they will inevitably leave traces in the economy, such as stagflation effects such as price increases and economic slowdown. In this way, the temporary easing is actually still on the surface and has not really solved the fundamental differences that led to the dispute. The most important thing is that the US trade deficit with China still exists. It is impossible to reshape the sweater relationship between the two sides in the short term. Any disturbance during this period will directly affect the attitude of safe-haven funds.
Especially the CPI data released by the US market tonight, the expected value of the unadjusted CPI annual rate in April is the same as the previous value of 2.4%, and the monthly rate is relatively high.
At this time, there is a basic problem. April has entered the battle of tariffs. Throughout April, the market has regarded gold as a lifeline. For example, when you see that daily necessities are about to be taxed and raised in price, what will you do?
Right, so if nothing unexpected happens, inflation caused by tariffs will rise. The good thing is that in terms of energy in April, the price of crude oil is straight down, so it offsets part of inflation. In principle, the impact of this announcement should be small. As for the core data, I personally think that it will rise compared with the previous value, that is, no matter how it is collected, there will be a limited situation of favorable factors.
After the midday trading, gold once probed upward and has tested the resistance level of 3260. I just calculated gold. It is originally adjusted by fundamentals, so it is still treated as an adjustment, that is, rebound and open short, or break and follow up.
Secondly, draw a channel according to the four-hour chart, and combine it with Fibonacci. Pay attention to 77-91 in the middle track of the Bollinger Band. If a reversal signal appears in this range, you can consider entering the market based on the signal to see a decline. At that time, you need to pay attention to 3219 and 3207 below. If the integer level is broken, you can also consider further lowering the gold target to the range of 3160±10.
Hello traders, if you have better ideas and suggestions, welcome to leave a message below, I will be very happy

XAU/USD 13 May 2025 Intraday AnalysisH4 Analysis:
-> Swing: Bullish.
-> Internal: Bullish.
Analysis and bias remains the same as analysis dated 23 April 2025
Price has now printed a bearish CHoCH according to my analysis yesterday.
Price is now trading within an established internal range.
Intraday Expectation:
Price to trade down to either discount of internal 50% EQ, or H4 demand zone before targeting weak internal high priced at 3,500.200.
Note:
The Federal Reserve’s sustained dovish stance, coupled with ongoing geopolitical uncertainties, is likely to prolong heightened volatility in the gold market. Given this elevated risk environment, traders should exercise caution and recalibrate risk management strategies to navigate potential price fluctuations effectively.
Additionally, gold pricing remains sensitive to broader macroeconomic developments, including policy decisions under President Trump. Shifts in geopolitical strategy and economic directives could further amplify uncertainty, contributing to market repricing dynamics.
H4 Chart:
M15 Analysis:
-> Swing: Bullish.
-> Internal: Bullish.
Analysis and bias remains remains the same as analysis dated 07 May 2025.
As mentioned in yesterday's analysis that I would continue to monitor price and depth of bearish pullback following previous bullish iBOS.
Price did not pull back with any significance, therefore, I will apply discretion and not mark the previous iBOS. I have however marked this in red.
Price continued bullish and subsequently printed a bearish iBOS to indicate, but not confirm bearish pullback phase initiation.
Price is now trading within an established internal range, however, I will continue to monitor depth of pullback.
Intraday Expectation:
Price to trade down to either discount of internal 50% EQ, or M15 supply zones before targeting weak internal high priced at 3,435.055
Note:
With the Federal Reserve maintaining a dovish stance and ongoing geopolitical tensions, volatility in Gold prices is expected to remain elevated. Traders should exercise caution, adjust risk management strategies, and stay prepared for potential price whipsaws in this high-volatility environment.
Trump's tariff announcement will most likely cause considerably increased volatility and whipsaws.
M15 Chart:

CPI-Inflation Assessment, Gold Accumulation
📌 Drivers
In geopolitics, Indian Prime Minister Narendra Modi said on Monday that military action against Pakistan was only paused, warning that future actions would depend on Islamabad's position. Meanwhile, Ukrainian President Volodymyr Zelensky expressed his willingness to meet with Russian President Vladimir Putin later this week after U.S. President Donald Trump called on Zelensky to "immediately" accept an invitation to a peace summit in Turkey. These developments have heightened geopolitical risks, which could boost demand for safe-haven assets such as gold, thereby enhancing the appeal of gold amid continued global uncertainty.
📊Comment Analysis
CPI evaluates the inflation level of the US economy, and the price of gold continues to strive to maintain a price range of around 3200
💰Strategy Package
🔥Selling gold area: 3281-3283 SL 3288
TP1: $3270
TP2: $3260
TP3: $3250🔥
Buying gold area: $3176 - $3174 SL $3169
TP1: $3185
TP2: $3198
TP3: $3210⭐️
Labaron believes
Guaranteeing the principal is the bottom line for survival, controlling risks is the armor for survival, earning profits is a stage medal, and long-term stable and continuous profits are the only proof that can finally stand up from the sea of corpses and blood.

Shorts were active at the beginning of this week, and prices fel
📌 Gold driving factors
The joint statement of the Sino-US Geneva economic and trade talks has just been released. This development has hit the safe-haven demand for gold and has become the fuse for a new round of gold selling.
Coupled with the hawkish "holding back" of the Federal Reserve, the dollar has remained stable near its multi-week high and put pressure on gold. The trend of gold prices seems quite fragile.
📊Commentary analysis
The next resistance for gold prices is the static barrier of $3360-3365/ounce. If it can be decisively overcome, it will eliminate the recent bearish tendency and lay the foundation for gold prices to regain the $3400/ounce mark.
💰Strategy Package
⭐️Set Gold Price:
🔥Sell Gold Zone: 3315-3317 SL 3322
TP1: $3300
TP2: $3290
TP3: $3280
🔥Buy Gold Zone: $3223 - $3225 SL $3218
TP1: $3238
TP2: $3245
TP3: $3260
⭐️ Note: Labaron hopes that traders can properly manage their funds
- Choose the number of lots that matches your funds
- Profit is 4-7% of the fund account
- Stop loss is 1-3% of the fund account

Is GOLD still rising star? XAUUSD AnalysisHello everyone!
i Want share my idea about gold price action.
End of April we had some correction but beginning of May it still has buyer and why? at global market we see still misunderstanding, America and China still talk about rates, final talk will be soon between that to giant country, Russia-Ukraine war plus we have very hard situation between India and Pakistan, everyone was expecting peace, after trump inauguration, but how we see we are still far, no one knows what will be next and for big investors gold is safest place to invest money. If we look at gold for long term we can see it has pretty strong bull run.
For me i have other view - China and America will deal about rates, which will give market better view, i think before it will happen, Gold will test new High, where it will find sellers and from there we will have 2 quarter Bearish trend. New high will be between 3500 - 3550, also if we look at Dollar index (DXY) at 1D chart it found buyers and slowly showing reversal, but don't forget 1W chart because there we had 1W consolidation from 2023 and the last fall was stronger than other falls, at technical it tested weekly Fair Value Gap, but i cant see any reason yet for fall.
I think Gold will show us new high which will be between 3500 - 3550 and then we will get bearish trend and we will see correlation with dollar and dollar will start bullish trend.
With technical i will use simple technic, gold tested today daily fair value gap and it got strong reaction, we have resistance + 2h FVG but for me it will be not hard for gold to brake it.
This analysis is from my experience, i am not financial advisor.
FOR COLLABORATION TEXT ME !
ALWAYS MAKE YOUR OWN RESEARCH !

Gold prices face substantial short-term suppression
📌 Bearish drivers
Gold prices (XAU/USD) rebounded from a multi-day low in early Asian trading, and are now at the psychological level of $3,300. Ongoing geopolitical uncertainties, including the Russia-Ukraine conflict, heightened tensions in the Middle East, and renewed frictions on the India-Pakistan border continue to support gold prices. Even so, improved risk sentiment appears to have limited gold's upside due to renewed optimism around the US-UK trade agreement and the launch of US-China tariff negotiations over the weekend.
📊Commentary and analysis
As tariff trade negotiations become more active, gold prices are facing huge selling pressure. Gold prices may return to the 3233 price range and continue to rise.
💰Strategy Package
🔥Sell Gold Zone: 3351-3353 SL 3358
TP1: $3340
TP2: $3330
TP3: $3320
🔥Buy Gold Zone: $3232 - $3234 SL $3227
TP1: $3245
TP2: $3260
TP3: $3270
⭐️ Note: Labaron hopes that traders can properly manage their funds
- Choose the number of lots that matches your funds
- Profit is 4-7% of the fund account
- Stop loss is 1-3% of the fund account

Gold prices remain volatile, where is the profit range?
💢 Driving factors
Gold prices plunged nearly 2% yesterday, mainly due to the strengthening of the US dollar and the optimism brought about by the upcoming trade talks between the United States and China. The Federal Reserve kept interest rates unchanged on Wednesday, but pointed out that the risks of rising inflation and unemployment increased, which further clouded the economic outlook as the Fed struggled to assess the impact of Trump's tariff policy. When the US dollar strengthens, it means that gold is relatively expensive for buyers holding foreign currencies. But despite the decline in gold prices, it is still supported by global geopolitical risks and central bank buying.
📊 Commentary Analysis
Gold basically fluctuated in the 3400-3360 range today, which is a typical fluctuation. But for high-level fluctuations, we must worry about the breakthrough after the platform is sorted out, and we must also worry about the stagflation retracement, which depends on the time cycle. Therefore, the current trend, people who like fluctuations feel very good, and those who look at one-sidedness feel uncomfortable. Today's early trading operations are still temporarily carried out in the 3400-3360 range, and new layouts will be made after the break!
💰Strategy Package
The Asian session is expected to remain volatile, and both long and short positions have opportunities. You only need to operate at the right time. Go long when the short-term retracement reaches 3370 support, and go short when the upper resistance reaches 3410.
⭐️ Note: Labaron hopes that traders can properly manage their funds
- Choose the number of lots that matches your funds
- Profit is 4-7% of the fund account
- Stop loss is 1-3% of the fund account

Are gold bulls regaining control of the market?
📌 Driving factors
The latest news from the Chinese Ministry of Foreign Affairs on Wednesday showed that Chinese Vice Premier He Lifeng will visit Switzerland from May 9 to 12. During this period, he will serve as the Chinese leader of Sino-US economic and trade and hold talks with the US leader, US Treasury Secretary Benson.
Beijing said that on the basis of fully considering global expectations, Chinese interests, and the calls of the US industry and consumers, China decided to agree to engage with the US. Any dialogue and negotiation must be carried out under the premise of mutual respect, equal consultation, and mutual benefit. If the United States attempts to continue to coerce and blackmail under the guise of talks, China "will never agree."
The market is paying attention to the policy decision announced by the Federal Reserve on Wednesday. It is expected that the Fed will keep interest rates unchanged at the meeting, but this meeting may be the last meeting with such a clear result.
Federal Reserve Chairman Powell is unlikely to provide clear guidance on how the Fed plans to respond to U.S. tariffs. Macquarie analysts led by Thierry Wizman wrote in an investor report, "If traders naively believe that the Fed will save the world and use obvious "dovish" signals to alleviate the recent increase in policy and political uncertainty, then they should think again."
In addition, investors also need to pay attention to the impact of news related to the geopolitical situation. This week, Israel and the Houthi armed forces "fought hard", which also provided safe-haven buying support for gold prices. There have also been some conflicts between India and Pakistan, which investors need to pay attention to.
📊Comment Analysis
Gold price awaits today's interest rate result, rebounded well above 3400 but then fell immediately, indicating that the market is not ready for the first rate cut, and if there is, gold price may face strong selling pressure today
💰Strategy Package
Long position:
Actively participate near 3365 points, profit target is around 3420 points
⭐️ Note: Labaron hopes that traders can properly manage their funds
- Choose the number of lots that matches your funds
- Profit is 4-7% of the fund account
- Stop loss is 1-3% of the fund account
